
|
|||||
|
 | |
| |
| |
| |
| |
| |
|
Gene: HSD17B2 |
Gene summary for HSD17B2 |
| Gene information | Species | Human | Gene symbol | HSD17B2 | Gene ID | 3294 |
| Gene name | hydroxysteroid 17-beta dehydrogenase 2 | |
| Gene Alias | EDH17B2 | |
| Cytomap | 16q23.3 | |
| Gene Type | protein-coding | GO ID | GO:0000003 | UniProtAcc | P37059 |
Top |
Malignant transformation analysis |
| Identification of the aberrant gene expression in precancerous and cancerous lesions by comparing the gene expression of stem-like cells in diseased tissues with normal stem cells |
| Entrez ID | Symbol | Replicates | Species | Organ | Tissue | Adj P-value | Log2FC | Malignancy |
| 3294 | HSD17B2 | HTA11_2487_2000001011 | Human | Colorectum | SER | 4.16e-12 | 1.19e+00 | -0.1808 |
| 3294 | HSD17B2 | HTA11_347_2000001011 | Human | Colorectum | AD | 2.89e-02 | 2.87e-01 | -0.1954 |
| 3294 | HSD17B2 | HTA11_83_2000001011 | Human | Colorectum | SER | 8.22e-05 | 6.85e-01 | -0.1526 |
| 3294 | HSD17B2 | HTA11_866_3004761011 | Human | Colorectum | AD | 4.95e-03 | -2.72e-01 | 0.096 |
| 3294 | HSD17B2 | HTA11_7696_3000711011 | Human | Colorectum | AD | 1.42e-04 | -2.67e-01 | 0.0674 |
| 3294 | HSD17B2 | HTA11_99999970781_79442 | Human | Colorectum | MSS | 1.74e-07 | -2.71e-01 | 0.294 |
| 3294 | HSD17B2 | HTA11_99999971662_82457 | Human | Colorectum | MSS | 7.48e-08 | -2.73e-01 | 0.3859 |
| 3294 | HSD17B2 | HTA11_99999974143_84620 | Human | Colorectum | MSS | 1.86e-11 | -2.91e-01 | 0.3005 |
| 3294 | HSD17B2 | A002-C-010 | Human | Colorectum | FAP | 5.95e-10 | -2.77e-01 | 0.242 |
| 3294 | HSD17B2 | A015-C-203 | Human | Colorectum | FAP | 5.75e-10 | -2.61e-01 | -0.1294 |
| 3294 | HSD17B2 | A002-C-201 | Human | Colorectum | FAP | 3.07e-04 | -2.47e-01 | 0.0324 |
| 3294 | HSD17B2 | A002-C-203 | Human | Colorectum | FAP | 1.12e-07 | -2.74e-01 | 0.2786 |
| 3294 | HSD17B2 | A001-C-108 | Human | Colorectum | FAP | 2.47e-04 | -1.80e-01 | -0.0272 |
| 3294 | HSD17B2 | A002-C-205 | Human | Colorectum | FAP | 4.43e-06 | -2.62e-01 | -0.1236 |
| 3294 | HSD17B2 | A015-C-005 | Human | Colorectum | FAP | 9.16e-03 | -2.55e-01 | -0.0336 |
| 3294 | HSD17B2 | A015-C-006 | Human | Colorectum | FAP | 1.57e-05 | -2.91e-01 | -0.0994 |
| 3294 | HSD17B2 | A015-C-106 | Human | Colorectum | FAP | 2.49e-07 | -2.21e-01 | -0.0511 |
| 3294 | HSD17B2 | A002-C-114 | Human | Colorectum | FAP | 5.24e-03 | -2.23e-01 | -0.1561 |
| 3294 | HSD17B2 | A015-C-104 | Human | Colorectum | FAP | 3.85e-09 | -2.45e-01 | -0.1899 |
| 3294 | HSD17B2 | A001-C-014 | Human | Colorectum | FAP | 2.48e-06 | -2.20e-01 | 0.0135 |
| Page: 1 2 3 4 |
| Tissue | Expression Dynamics | Abbreviation |
| Colorectum (GSE201348) |  | FAP: Familial adenomatous polyposis |
| CRC: Colorectal cancer | ||
| Colorectum (HTA11) | 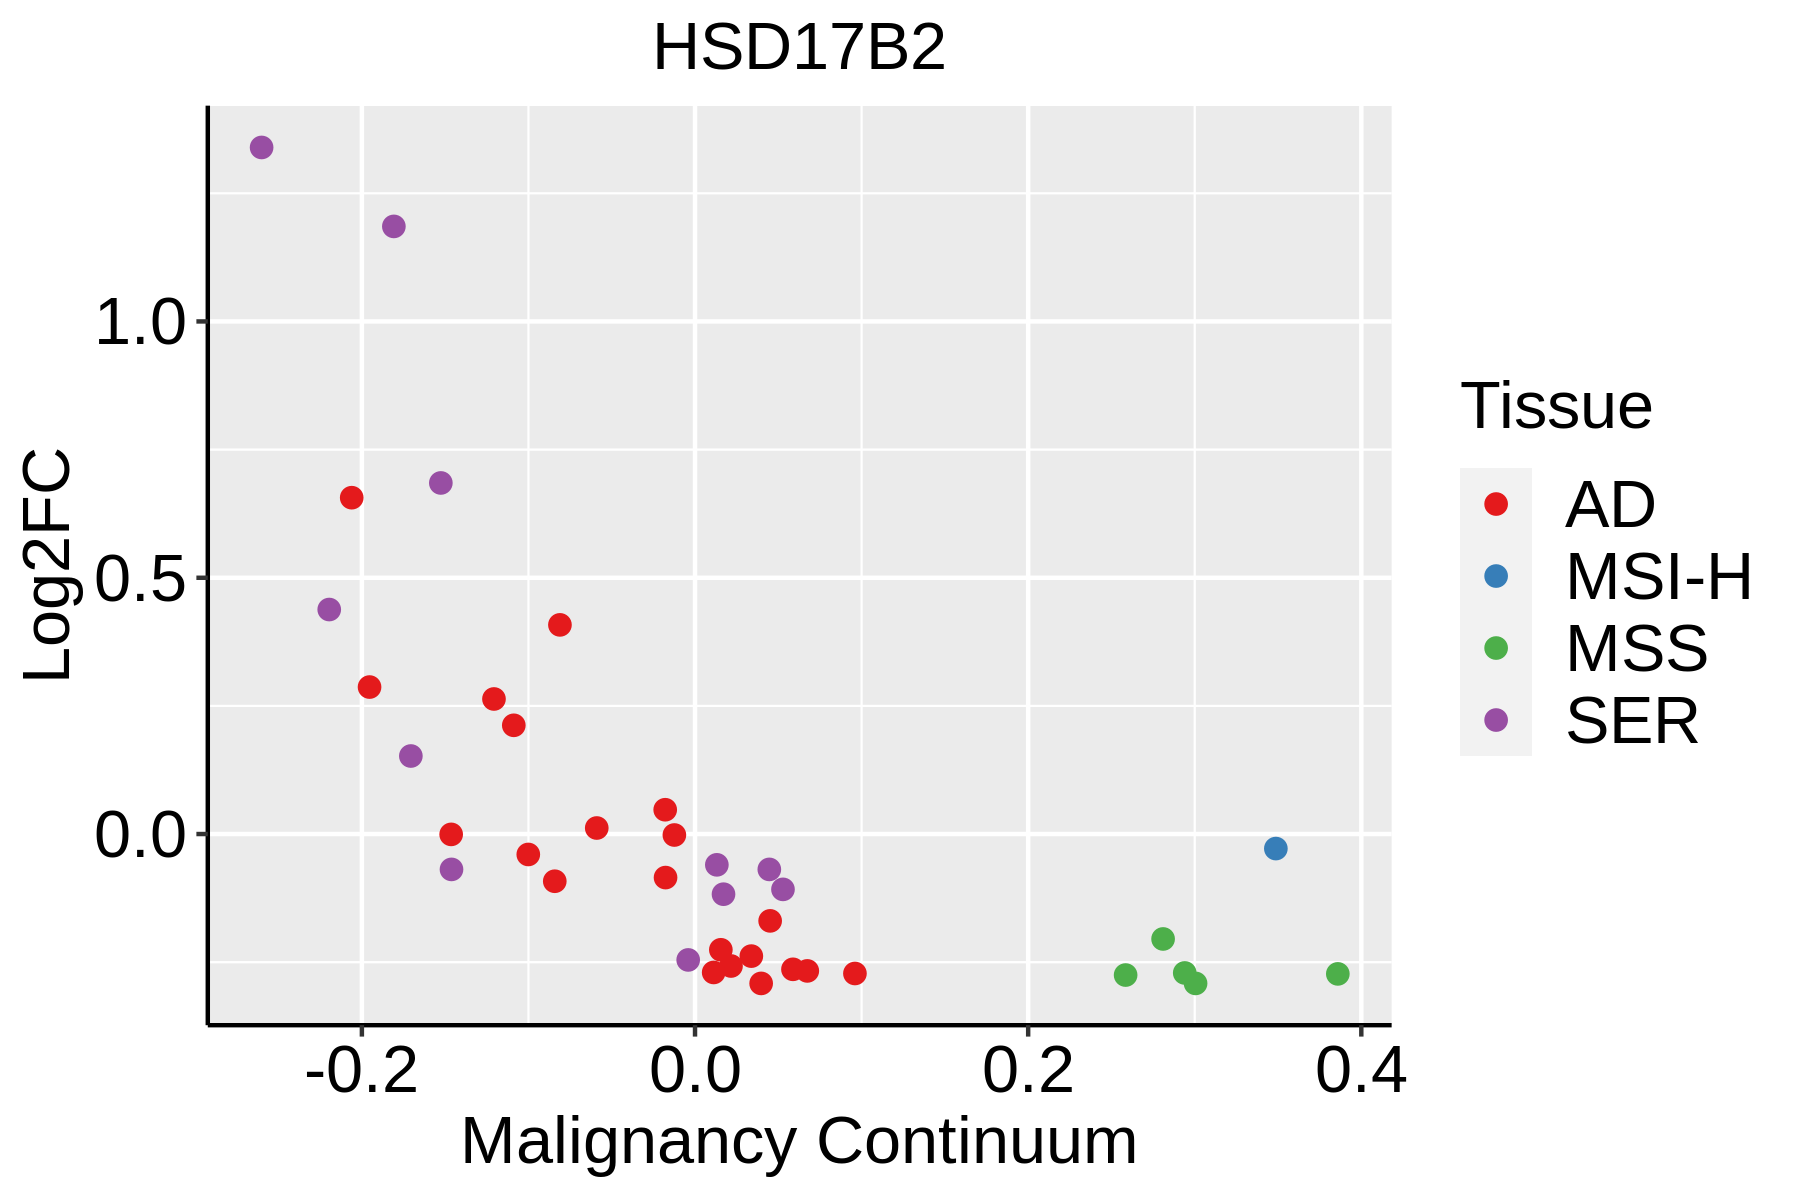 | AD: Adenomas |
| SER: Sessile serrated lesions | ||
| MSI-H: Microsatellite-high colorectal cancer | ||
| MSS: Microsatellite stable colorectal cancer | ||
| Esophagus | 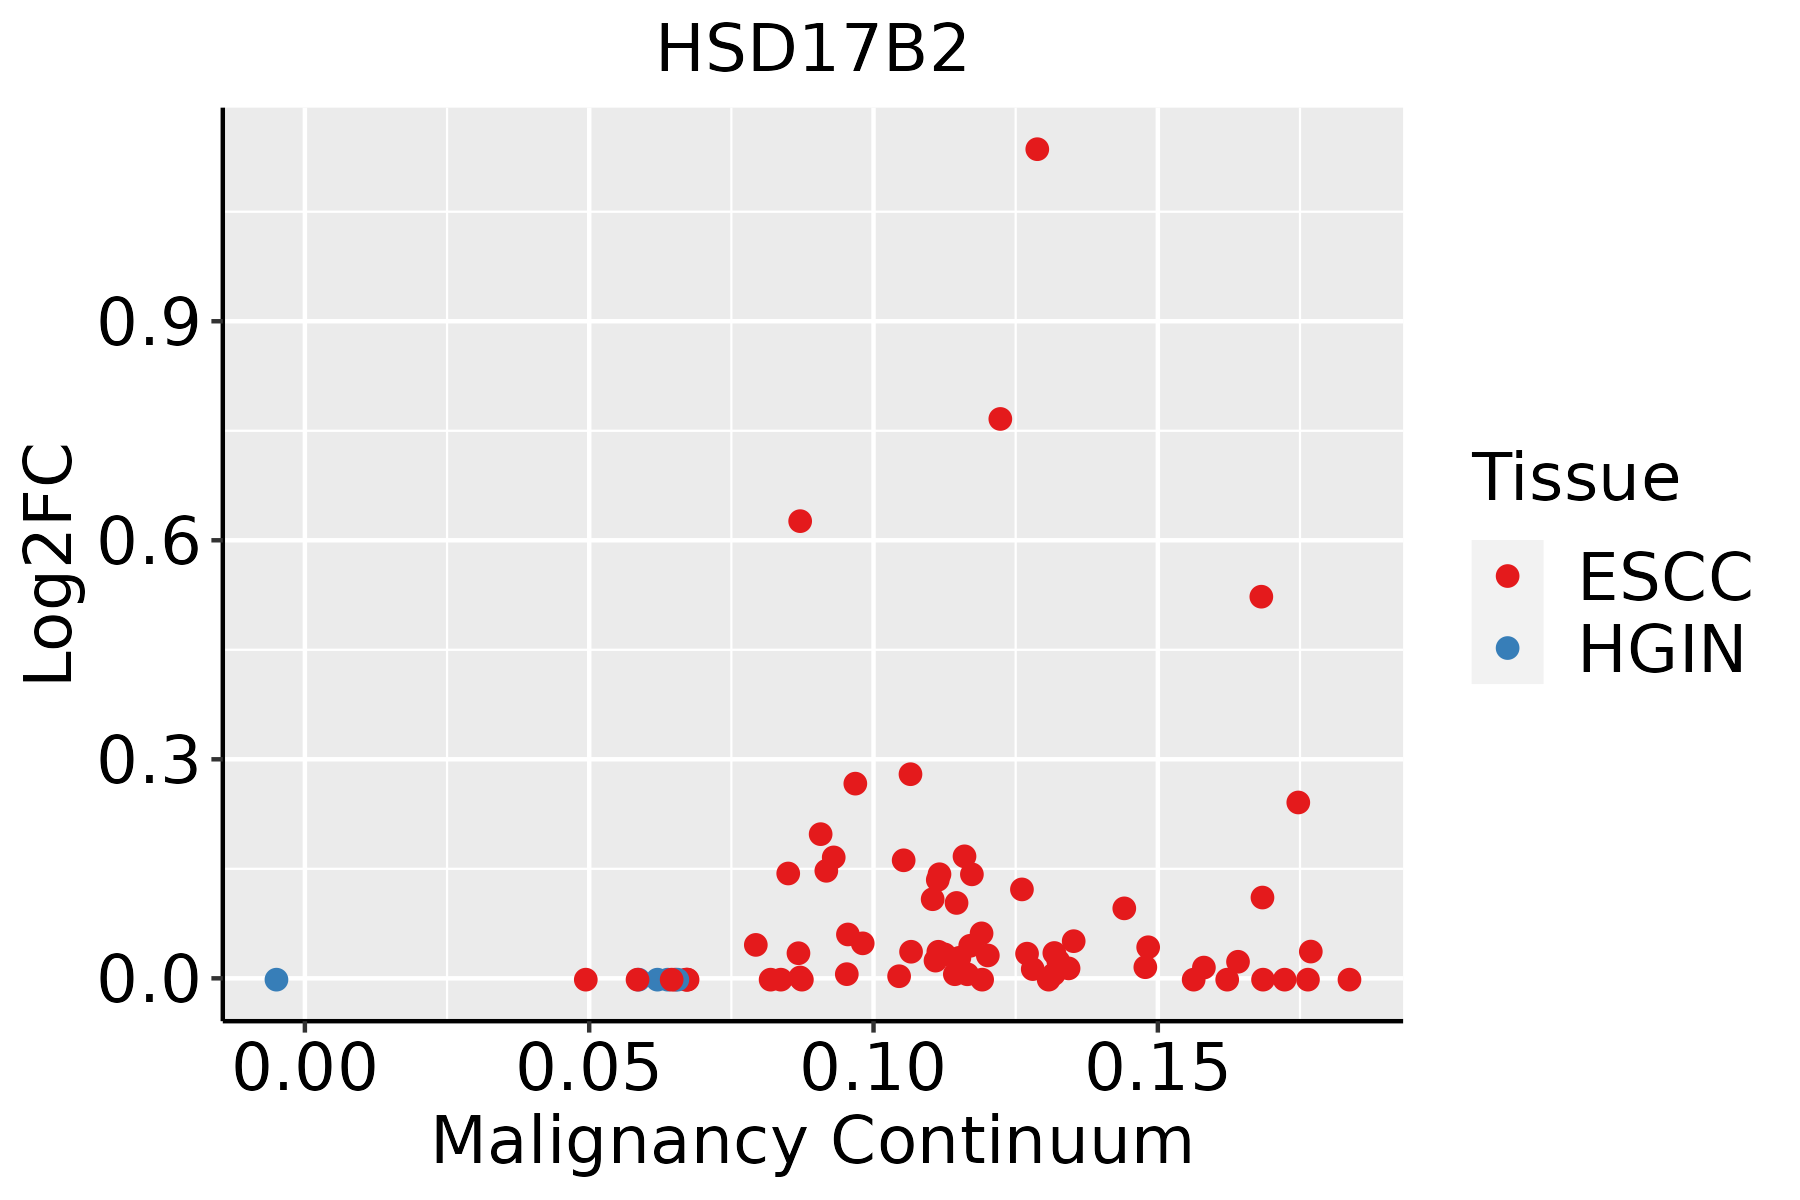 | ESCC: Esophageal squamous cell carcinoma |
| HGIN: High-grade intraepithelial neoplasias | ||
| LGIN: Low-grade intraepithelial neoplasias | ||
| GC | 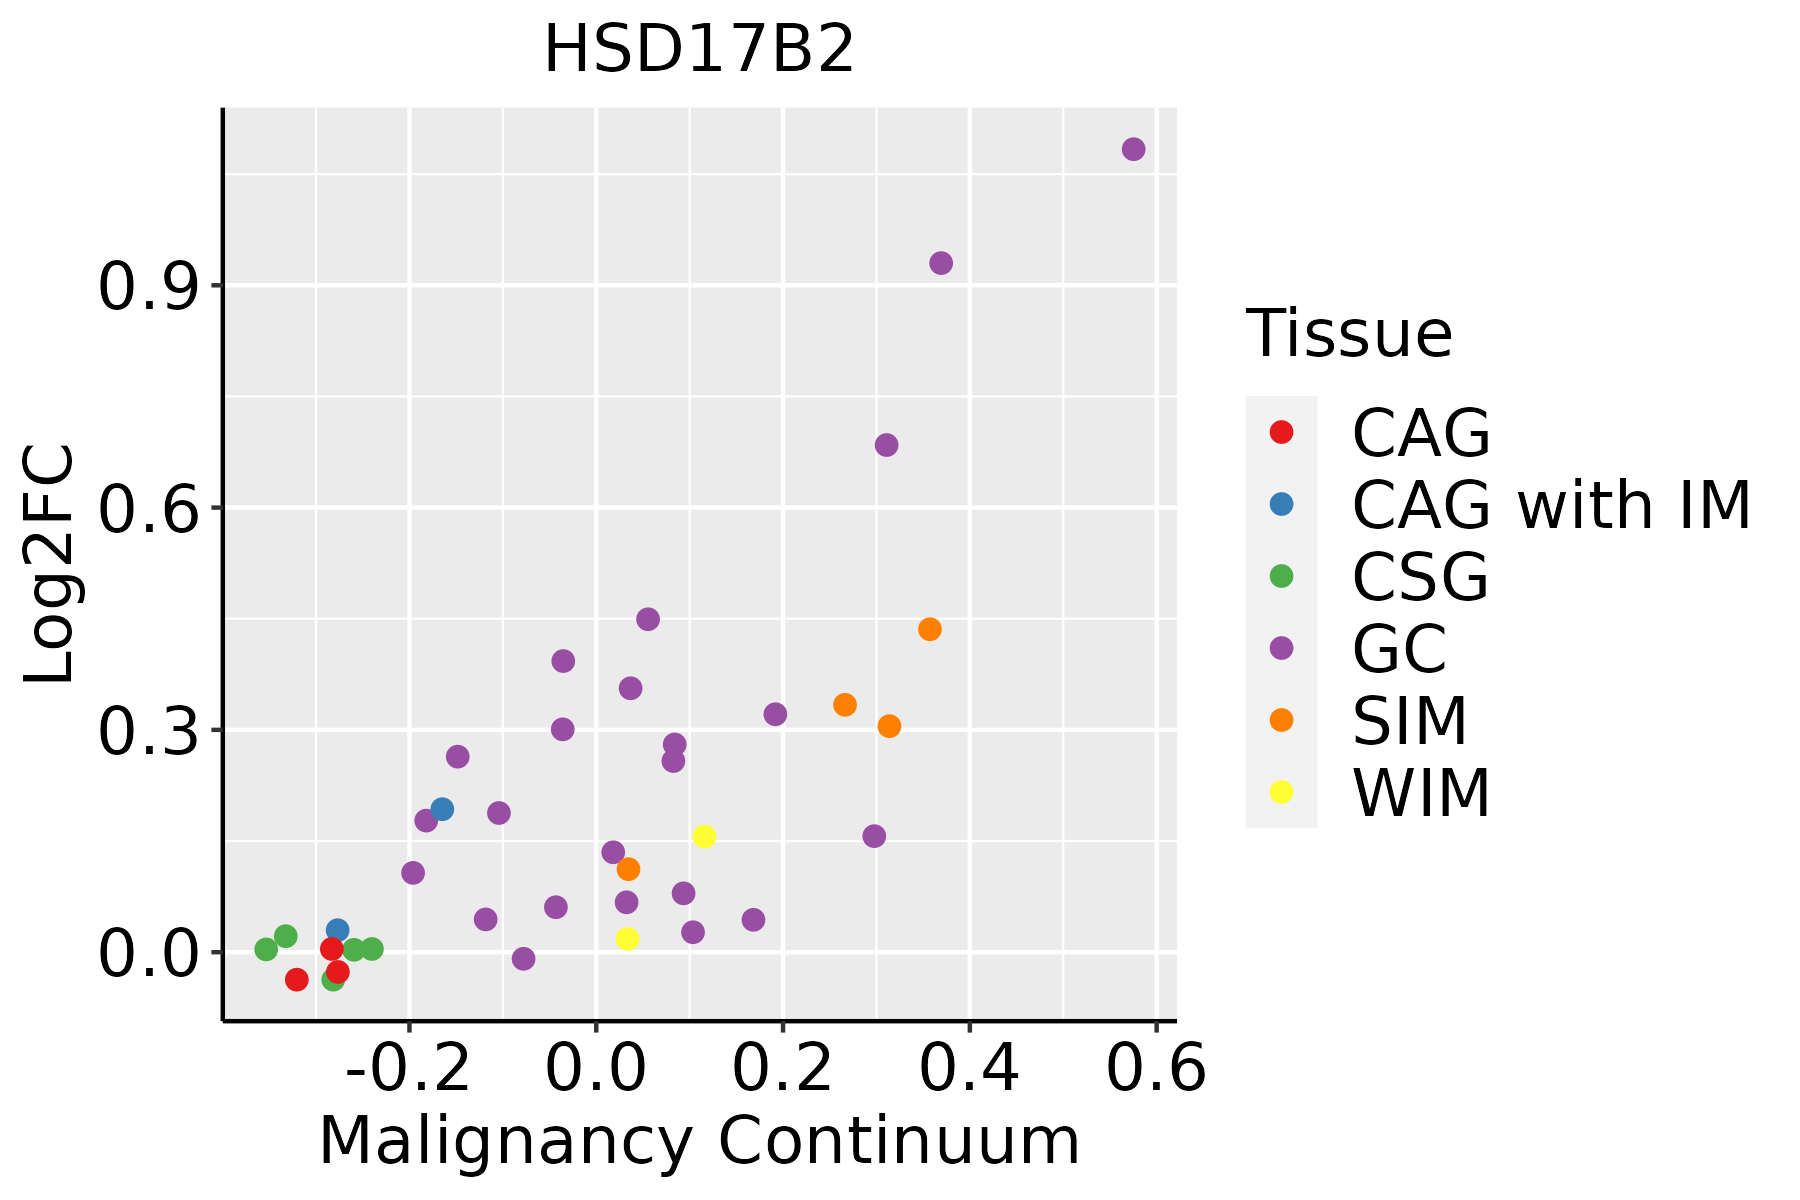 | CAG: Chronic atrophic gastritis |
| CAG with IM: Chronic atrophic gastritis with intestinal metaplasia | ||
| CSG: Chronic superficial gastritis | ||
| GC: Gastric cancer | ||
| SIM: Severe intestinal metaplasia | ||
| WIM: Wild intestinal metaplasia | ||
| Liver |  | HCC: Hepatocellular carcinoma |
| NAFLD: Non-alcoholic fatty liver disease | ||
| Oral Cavity | 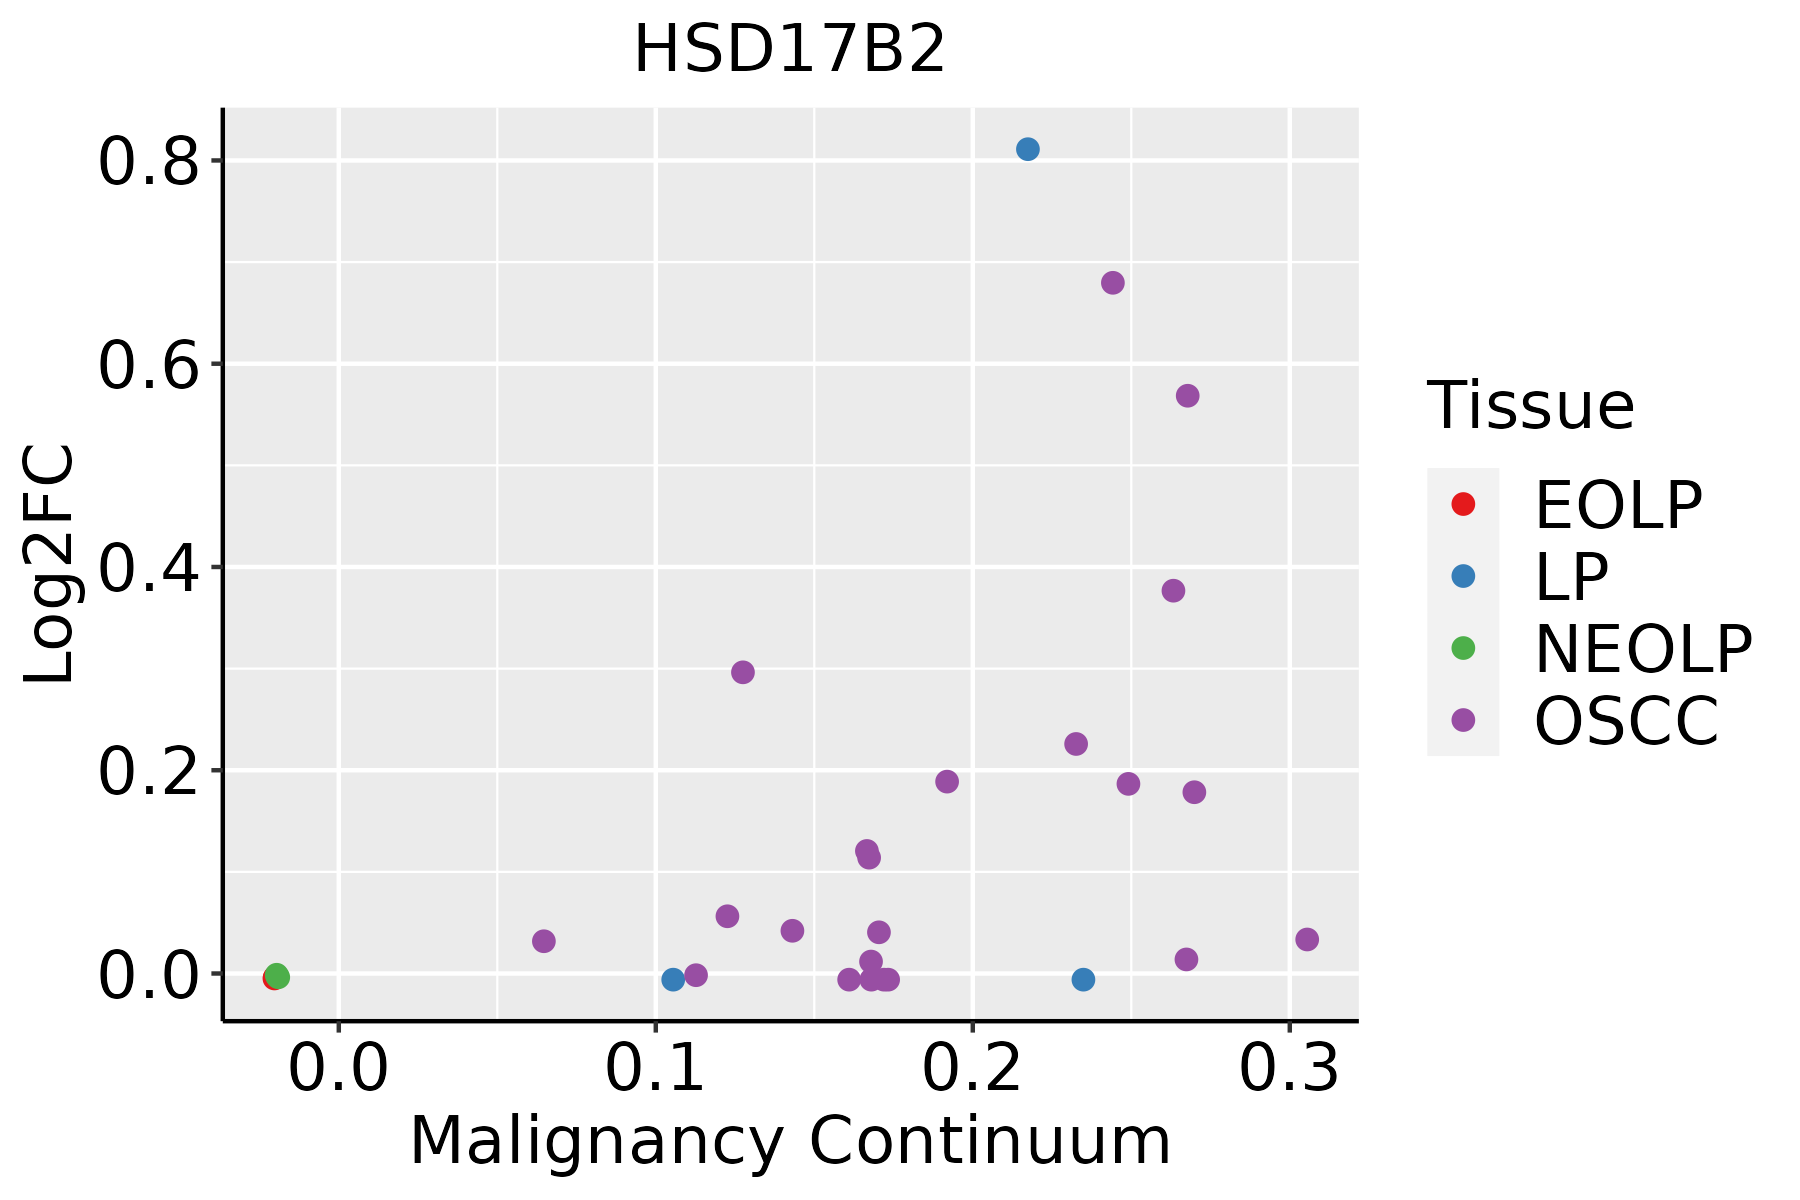 | EOLP: Erosive Oral lichen planus |
| LP: leukoplakia | ||
| NEOLP: Non-erosive oral lichen planus | ||
| OSCC: Oral squamous cell carcinoma |
| ∗log2FC in expression of this searched gene in stem-like cells from each diseased tissue sample relative to stem-like cells in normal samples in each tissue plotted against the malignancy continuum. Samples are colored based on if they are from different disease stage. |
Top |
Malignant transformation related pathway analysis |
| Find out the enriched GO biological processes and KEGG pathways involved in transition from healthy to precancer to cancer |
| Tissue | Disease Stage | Enriched GO biological Processes |
| Colorectum | AD |  |
| Colorectum | SER |  |
| Colorectum | MSS |  |
| Colorectum | MSI-H |  |
| Colorectum | FAP |  |
| ∗Top 15 enriched GO BP terms are showed in the bar plot of each disease state in each tissue. Each row represents a significant GO biological process which is colored according to the -log10(p.adjust). |
| Page: 1 2 3 4 5 6 7 8 9 |
| GO ID | Tissue | Disease Stage | Description | Gene Ratio | Bg Ratio | pvalue | p.adjust | Count |
| GO:0001701 | Colorectum | AD | in utero embryonic development | 110/3918 | 367/18723 | 2.36e-05 | 4.62e-04 | 110 |
| GO:0001890 | Colorectum | AD | placenta development | 51/3918 | 144/18723 | 3.99e-05 | 7.16e-04 | 51 |
| GO:0061458 | Colorectum | AD | reproductive system development | 116/3918 | 427/18723 | 1.11e-03 | 1.01e-02 | 116 |
| GO:0048608 | Colorectum | AD | reproductive structure development | 114/3918 | 424/18723 | 1.78e-03 | 1.47e-02 | 114 |
| GO:0008202 | Colorectum | AD | steroid metabolic process | 85/3918 | 319/18723 | 8.07e-03 | 4.75e-02 | 85 |
| GO:00018901 | Colorectum | SER | placenta development | 43/2897 | 144/18723 | 9.10e-06 | 3.03e-04 | 43 |
| GO:00017011 | Colorectum | SER | in utero embryonic development | 77/2897 | 367/18723 | 2.77e-03 | 2.48e-02 | 77 |
| GO:00614581 | Colorectum | SER | reproductive system development | 87/2897 | 427/18723 | 3.69e-03 | 3.07e-02 | 87 |
| GO:00486081 | Colorectum | SER | reproductive structure development | 85/2897 | 424/18723 | 6.33e-03 | 4.56e-02 | 85 |
| GO:00018902 | Colorectum | MSS | placenta development | 51/3467 | 144/18723 | 1.10e-06 | 3.77e-05 | 51 |
| GO:00614582 | Colorectum | MSS | reproductive system development | 115/3467 | 427/18723 | 9.86e-06 | 2.39e-04 | 115 |
| GO:00486082 | Colorectum | MSS | reproductive structure development | 113/3467 | 424/18723 | 1.94e-05 | 4.18e-04 | 113 |
| GO:00017012 | Colorectum | MSS | in utero embryonic development | 99/3467 | 367/18723 | 3.71e-05 | 7.10e-04 | 99 |
| GO:00017013 | Colorectum | FAP | in utero embryonic development | 81/2622 | 367/18723 | 1.58e-05 | 4.10e-04 | 81 |
| GO:00018903 | Colorectum | FAP | placenta development | 38/2622 | 144/18723 | 6.22e-05 | 1.21e-03 | 38 |
| GO:00614583 | Colorectum | FAP | reproductive system development | 85/2622 | 427/18723 | 4.30e-04 | 5.13e-03 | 85 |
| GO:00486083 | Colorectum | FAP | reproductive structure development | 84/2622 | 424/18723 | 5.40e-04 | 6.10e-03 | 84 |
| GO:00614584 | Colorectum | CRC | reproductive system development | 73/2078 | 427/18723 | 1.13e-04 | 2.22e-03 | 73 |
| GO:00486084 | Colorectum | CRC | reproductive structure development | 72/2078 | 424/18723 | 1.55e-04 | 2.80e-03 | 72 |
| GO:00018904 | Colorectum | CRC | placenta development | 30/2078 | 144/18723 | 4.81e-04 | 6.91e-03 | 30 |
| Page: 1 2 3 |
| Pathway ID | Tissue | Disease Stage | Description | Gene Ratio | Bg Ratio | pvalue | p.adjust | qvalue | Count |
| Page: 1 |
Top |
Cell-cell communication analysis |
| Identification of potential cell-cell interactions between two cell types and their ligand-receptor pairs for different disease states |
| Ligand | Receptor | LRpair | Pathway | Tissue | Disease Stage |
| Page: 1 |
Top |
Single-cell gene regulatory network inference analysis |
| Find out the significant the regulons (TFs) and the target genes of each regulon across cell types for different disease states |
| TF | Cell Type | Tissue | Disease Stage | Target Gene | RSS | Regulon Activity |
| ∗The dot plots of a searched regulon are shown for all cell subpopulations in each disease state of each tissue based on the regulon specific score inferred using pySCENIC and by calculating the average expression. |
| Page: 1 |
Top |
Somatic mutation of malignant transformation related genes |
| Annotation of somatic variants for genes involved in malignant transformation |
| Hugo Symbol | Variant Class | Variant Classification | dbSNP RS | HGVSc | HGVSp | HGVSp Short | SWISSPROT | BIOTYPE | SIFT | PolyPhen | Tumor Sample Barcode | Tissue | Histology | Sex | Age | Stage | Therapy Types | Drugs | Outcome |
| HSD17B2 | SNV | Missense_Mutation | c.46N>A | p.Pro16Thr | p.P16T | P37059 | protein_coding | tolerated(1) | benign(0) | TCGA-A1-A0SO-01 | Breast | breast invasive carcinoma | Female | >=65 | I/II | Chemotherapy | SD | ||
| HSD17B2 | SNV | Missense_Mutation | c.761N>T | p.Gly254Val | p.G254V | P37059 | protein_coding | deleterious(0) | probably_damaging(0.992) | TCGA-AC-A23H-01 | Breast | breast invasive carcinoma | Female | >=65 | I/II | Unknown | Unknown | PD | |
| HSD17B2 | SNV | Missense_Mutation | c.653N>A | p.Ser218Asn | p.S218N | P37059 | protein_coding | deleterious(0) | probably_damaging(0.997) | TCGA-BH-A0HF-01 | Breast | breast invasive carcinoma | Female | >=65 | I/II | Hormone Therapy | arimidex | SD | |
| HSD17B2 | deletion | Frame_Shift_Del | novel | c.477delA | p.Gly160AspfsTer5 | p.G160Dfs*5 | P37059 | protein_coding | TCGA-EW-A2FV-01 | Breast | breast invasive carcinoma | Female | <65 | III/IV | Chemotherapy | docetaxel | SD | ||
| HSD17B2 | SNV | Missense_Mutation | rs752344353 | c.334G>A | p.Gly112Arg | p.G112R | P37059 | protein_coding | deleterious(0) | probably_damaging(0.989) | TCGA-A6-6781-01 | Colorectum | colon adenocarcinoma | Male | <65 | III/IV | Chemotherapy | oxaliplatin | SD |
| HSD17B2 | SNV | Missense_Mutation | c.338N>C | p.Val113Ala | p.V113A | P37059 | protein_coding | deleterious(0.05) | probably_damaging(0.96) | TCGA-AA-3663-01 | Colorectum | colon adenocarcinoma | Male | <65 | I/II | Unknown | Unknown | SD | |
| HSD17B2 | SNV | Missense_Mutation | c.124N>A | p.Ala42Thr | p.A42T | P37059 | protein_coding | tolerated(0.12) | benign(0.005) | TCGA-AA-3815-01 | Colorectum | colon adenocarcinoma | Female | >=65 | I/II | Unknown | Unknown | SD | |
| HSD17B2 | SNV | Missense_Mutation | rs369773984 | c.391N>T | p.Arg131Cys | p.R131C | P37059 | protein_coding | deleterious(0.01) | probably_damaging(0.995) | TCGA-AA-A00N-01 | Colorectum | colon adenocarcinoma | Male | >=65 | I/II | Unknown | Unknown | PD |
| HSD17B2 | SNV | Missense_Mutation | rs373965697 | c.392N>A | p.Arg131His | p.R131H | P37059 | protein_coding | tolerated(0.12) | benign(0.243) | TCGA-AA-A01R-01 | Colorectum | colon adenocarcinoma | Male | <65 | III/IV | Chemotherapy | 5-fluorouracil | PD |
| HSD17B2 | SNV | Missense_Mutation | rs369773984 | c.391N>T | p.Arg131Cys | p.R131C | P37059 | protein_coding | deleterious(0.01) | probably_damaging(0.995) | TCGA-AZ-6599-01 | Colorectum | colon adenocarcinoma | Male | >=65 | I/II | Unknown | Unknown | SD |
| Page: 1 2 3 4 5 |
Top |
Related drugs of malignant transformation related genes |
| Identification of chemicals and drugs interact with genes involved in malignant transfromation |
| (DGIdb 4.0) |
| Entrez ID | Symbol | Category | Interaction Types | Drug Claim Name | Drug Name | PMIDs |
| 3294 | HSD17B2 | DRUGGABLE GENOME, SHORT CHAIN DEHYDROGENASE REDUCTASE, ENZYME | inhibitor | 385612198 |
| Page: 1 |

Copyright 2023-Present -The University of Texas Health Science Center at Houston |