Schematic overview of the cellular and molecular mechanisms involved in the cancer progression, including the proposed cellular and molecular mechanisms in cancer cells trajectory. AT1: alveolar type 1 cells; AT2: alveolar type 2 cells; AAH: atypical adenomatous hyperplasia; AIS: adenocarcinoma in situ; MIA: minimally invasive adenocarcinoma; IA: invasive adenocarcinoma; EMT: epithelial-mesenchymal transition

Home

Download

Statistics

Help

Contact

Center for Computational Systems Medicine
leaf

Gene summary

leaf

Malignant transformation analysis

leaf

Malignant transformation related pathway analysis

leaf

Cell-cell communication analysis

leaf

Single-cell gene regulatory network inference analysis

leaf

Somatic mutation of malignant transformation related genes

leaf

Related drugs of malignant transformation related genes

Gene: HSD17B11

Gene summary for HSD17B11

check button Gene summary.

Gene informationSpeciesHuman
Gene symbol

HSD17B11

Gene ID

51170

Gene namehydroxysteroid 17-beta dehydrogenase 11
Gene Alias17-BETA-HSD11
Cytomap4q22.1
Gene Typeprotein-coding
GO ID

GO:0006629

UniProtAcc

Q8NBQ5


Top

Malignant transformation analysis

check button Identification of the aberrant gene expression in precancerous and cancerous lesions by comparing the gene expression of stem-like cells in diseased tissues with normal stem cells
check button Malignant transformation involving gene list.
Entrez IDSymbolReplicatesSpeciesOrganTissueAdj P-valueLog2FCMalignancy
51170HSD17B11HTA11_3410_2000001011HumanColorectumAD2.77e-11-5.96e-010.0155
51170HSD17B11HTA11_347_2000001011HumanColorectumAD3.92e-043.76e-01-0.1954
51170HSD17B11HTA11_696_2000001011HumanColorectumAD1.65e-02-3.63e-01-0.1464
51170HSD17B11HTA11_866_3004761011HumanColorectumAD3.52e-06-4.30e-010.096
51170HSD17B11HTA11_10711_2000001011HumanColorectumAD8.07e-05-5.82e-010.0338
51170HSD17B11HTA11_7696_3000711011HumanColorectumAD6.67e-13-4.76e-010.0674
51170HSD17B11HTA11_6818_2000001021HumanColorectumAD4.44e-04-5.47e-010.0588
51170HSD17B11HTA11_99999970781_79442HumanColorectumMSS4.28e-06-4.17e-010.294
51170HSD17B11HTA11_99999973899_84307HumanColorectumMSS1.72e-04-6.55e-010.2585
51170HSD17B11HTA11_99999974143_84620HumanColorectumMSS7.31e-16-6.07e-010.3005
51170HSD17B11F007HumanColorectumFAP1.06e-06-5.84e-010.1176
51170HSD17B11A002-C-010HumanColorectumFAP4.12e-04-4.21e-010.242
51170HSD17B11A001-C-207HumanColorectumFAP1.21e-08-5.45e-010.1278
51170HSD17B11A015-C-203HumanColorectumFAP2.00e-26-4.95e-01-0.1294
51170HSD17B11A015-C-204HumanColorectumFAP1.21e-09-5.32e-01-0.0228
51170HSD17B11A014-C-040HumanColorectumFAP2.90e-03-4.38e-01-0.1184
51170HSD17B11A002-C-201HumanColorectumFAP1.35e-16-5.73e-010.0324
51170HSD17B11A002-C-203HumanColorectumFAP3.52e-14-5.23e-010.2786
51170HSD17B11A001-C-119HumanColorectumFAP3.64e-06-4.35e-01-0.1557
51170HSD17B11A001-C-108HumanColorectumFAP4.02e-19-4.80e-01-0.0272
Page: 1 2 3 4 5 6 7 8 

check button Transcriptomic changes along malignancy continuum.
TissueExpression DynamicsAbbreviation
Colorectum (GSE201348)The image shows the transcriptomic changes along malignancy continuum.log2FC in expression of this searched gene in stem-like cells from each diseased tissue sample relative to stem-like cells in normal samples in each tissue plotted against the malignancy continuum. Samples are colored based on if they are from different disease stage.FAP: Familial adenomatous polyposis
CRC: Colorectal cancer
Colorectum (HTA11)The image shows the transcriptomic changes along malignancy continuum.log2FC in expression of this searched gene in stem-like cells from each diseased tissue sample relative to stem-like cells in normal samples in each tissue plotted against the malignancy continuum. Samples are colored based on if they are from different disease stage.AD: Adenomas
SER: Sessile serrated lesions
MSI-H: Microsatellite-high colorectal cancer
MSS: Microsatellite stable colorectal cancer
EsophagusThe image shows the transcriptomic changes along malignancy continuum.log2FC in expression of this searched gene in stem-like cells from each diseased tissue sample relative to stem-like cells in normal samples in each tissue plotted against the malignancy continuum. Samples are colored based on if they are from different disease stage.
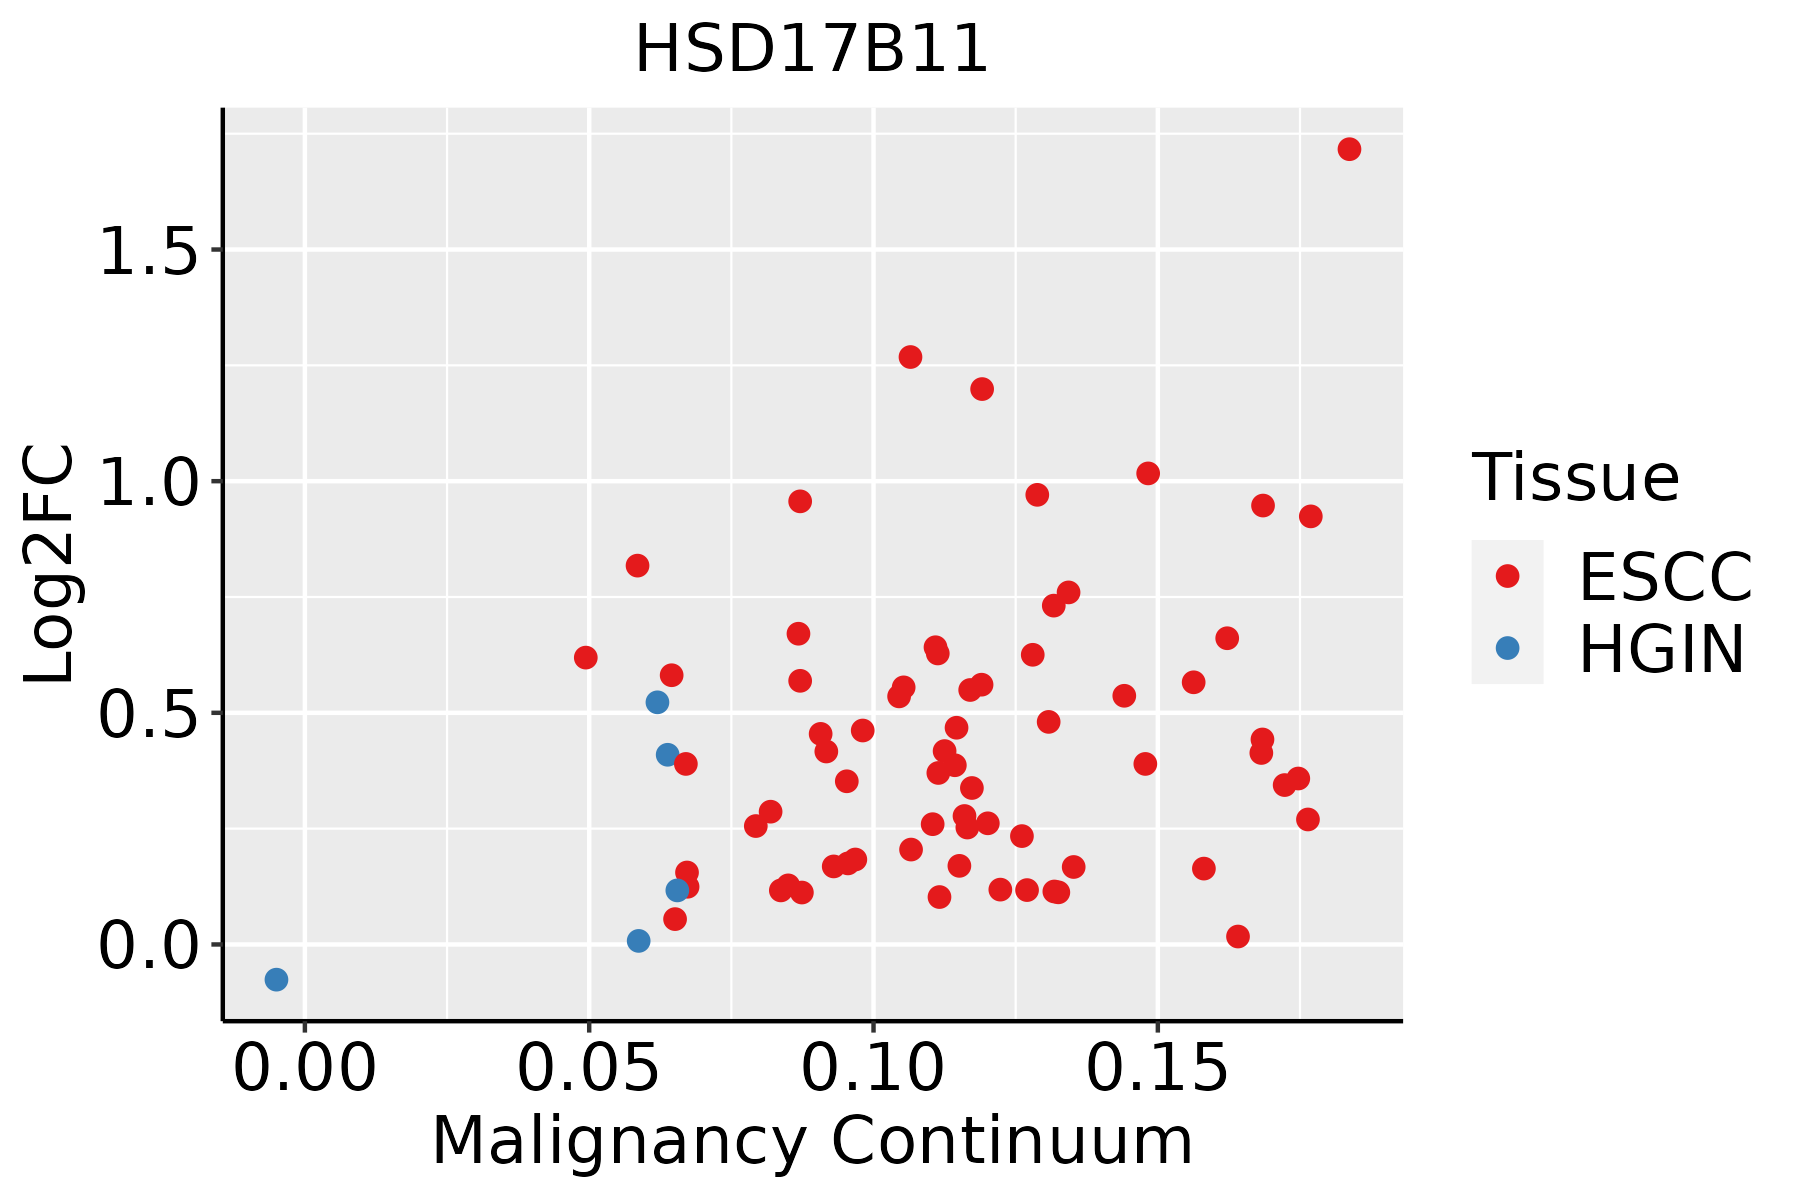
ESCC: Esophageal squamous cell carcinoma
HGIN: High-grade intraepithelial neoplasias
LGIN: Low-grade intraepithelial neoplasias
GCThe image shows the transcriptomic changes along malignancy continuum.log2FC in expression of this searched gene in stem-like cells from each diseased tissue sample relative to stem-like cells in normal samples in each tissue plotted against the malignancy continuum. Samples are colored based on if they are from different disease stage.CAG: Chronic atrophic gastritis
CAG with IM: Chronic atrophic gastritis with intestinal metaplasia
CSG: Chronic superficial gastritis
GC: Gastric cancer
SIM: Severe intestinal metaplasia
WIM: Wild intestinal metaplasia
LiverThe image shows the transcriptomic changes along malignancy continuum.log2FC in expression of this searched gene in stem-like cells from each diseased tissue sample relative to stem-like cells in normal samples in each tissue plotted against the malignancy continuum. Samples are colored based on if they are from different disease stage.HCC: Hepatocellular carcinoma
NAFLD: Non-alcoholic fatty liver disease
Oral CavityThe image shows the transcriptomic changes along malignancy continuum.log2FC in expression of this searched gene in stem-like cells from each diseased tissue sample relative to stem-like cells in normal samples in each tissue plotted against the malignancy continuum. Samples are colored based on if they are from different disease stage.
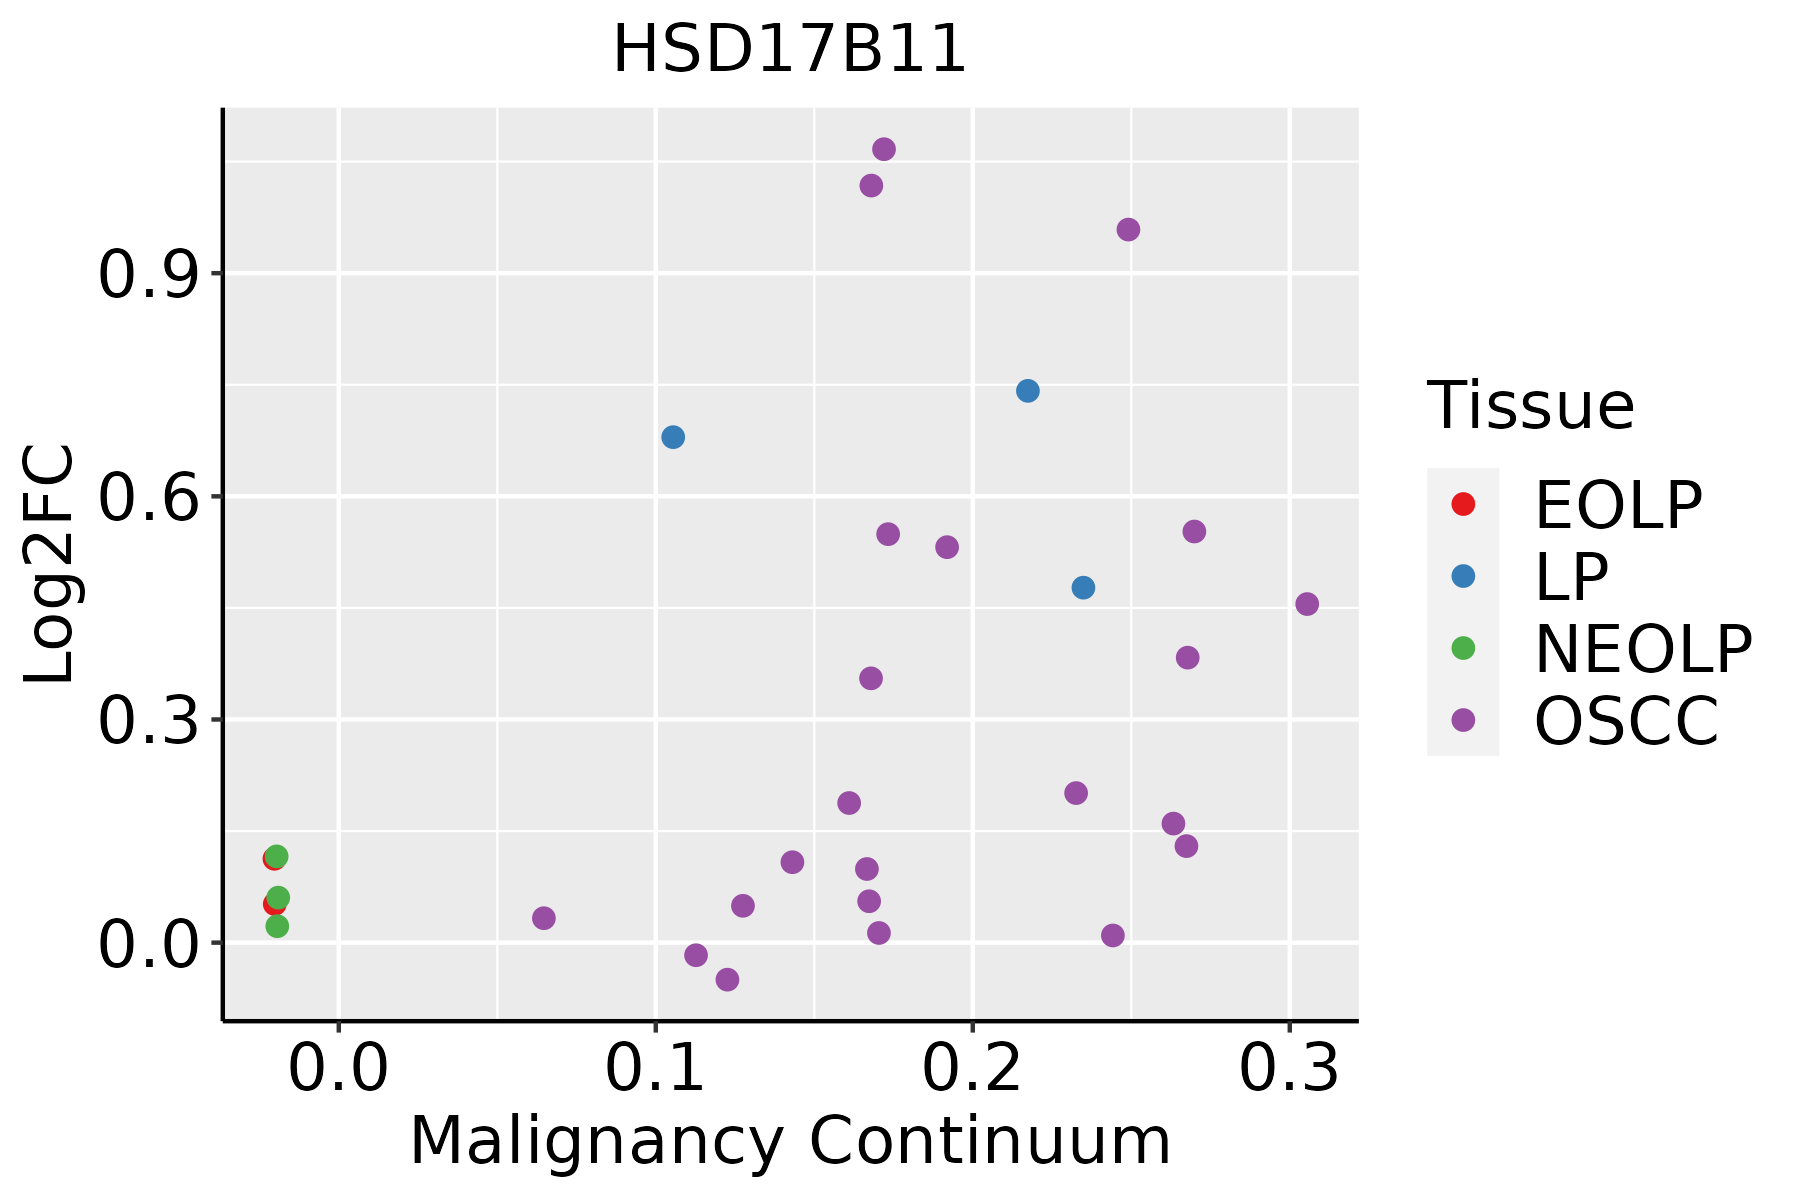
EOLP: Erosive Oral lichen planus
LP: leukoplakia
NEOLP: Non-erosive oral lichen planus
OSCC: Oral squamous cell carcinoma
∗log2FC in expression of this searched gene in stem-like cells from each diseased tissue sample relative to stem-like cells in normal samples in each tissue plotted against the malignancy continuum. Samples are colored based on if they are from different disease stage.

Top

Malignant transformation related pathway analysis

check buttonFind out the enriched GO biological processes and KEGG pathways involved in transition from healthy to precancer to cancer
check button Figure of enriched GO biological processes.
TissueDisease StageEnriched GO biological Processes
ColorectumADGO analysis - Figure of enriched GO biological processes: Top 15 enriched GO BP terms are showed in the bar plot of each disease state in each tissue. Each row represents a significant GO biological process which is colored according to the -log10(p.adjust).
ColorectumSERGO analysis - Figure of enriched GO biological processes: Top 15 enriched GO BP terms are showed in the bar plot of each disease state in each tissue. Each row represents a significant GO biological process which is colored according to the -log10(p.adjust).
ColorectumMSSGO analysis - Figure of enriched GO biological processes: Top 15 enriched GO BP terms are showed in the bar plot of each disease state in each tissue. Each row represents a significant GO biological process which is colored according to the -log10(p.adjust).
ColorectumMSI-HGO analysis - Figure of enriched GO biological processes: Top 15 enriched GO BP terms are showed in the bar plot of each disease state in each tissue. Each row represents a significant GO biological process which is colored according to the -log10(p.adjust).
ColorectumFAPGO analysis - Figure of enriched GO biological processes: Top 15 enriched GO BP terms are showed in the bar plot of each disease state in each tissue. Each row represents a significant GO biological process which is colored according to the -log10(p.adjust).
∗Top 15 enriched GO BP terms are showed in the bar plot of each disease state in each tissue. Each row represents a significant GO biological process which is colored according to the -log10(p.adjust).
Page: 1 2 3 4 5 6 7 8 9 

check button Enriched GO biological processes.
GO IDTissueDisease StageDescriptionGene RatioBg Ratiopvaluep.adjustCount
GO:1901361ColorectumADorganic cyclic compound catabolic process153/3918495/187238.23e-084.18e-06153
GO:0016042ColorectumADlipid catabolic process97/3918320/187234.31e-057.56e-0497
GO:0008202ColorectumADsteroid metabolic process85/3918319/187238.07e-034.75e-0285
GO:19013612ColorectumMSSorganic cyclic compound catabolic process148/3467495/187233.47e-103.18e-08148
GO:00160422ColorectumMSSlipid catabolic process77/3467320/187237.43e-034.71e-0277
GO:19013614ColorectumFAPorganic cyclic compound catabolic process101/2622495/187234.87e-059.93e-04101
GO:00160423ColorectumFAPlipid catabolic process65/2622320/187231.13e-031.08e-0265
GO:19013615ColorectumCRCorganic cyclic compound catabolic process80/2078495/187233.52e-045.34e-0380
GO:00160424ColorectumCRClipid catabolic process53/2078320/187231.89e-031.93e-0253
GO:190136118EsophagusESCCorganic cyclic compound catabolic process307/8552495/187239.99e-144.80e-12307
GO:00066946EsophagusESCCsteroid biosynthetic process98/8552173/187232.34e-031.03e-0298
GO:00160427EsophagusESCClipid catabolic process168/8552320/187237.97e-032.84e-02168
GO:190136111LiverCirrhoticorganic cyclic compound catabolic process213/4634495/187231.58e-193.67e-17213
GO:000820211LiverCirrhoticsteroid metabolic process143/4634319/187232.79e-153.18e-13143
GO:00066941LiverCirrhoticsteroid biosynthetic process77/4634173/187231.02e-083.91e-0777
GO:001604212LiverCirrhoticlipid catabolic process112/4634320/187232.31e-053.03e-04112
GO:00082101LiverCirrhoticestrogen metabolic process18/463438/187232.05e-031.27e-0218
GO:004244511LiverCirrhotichormone metabolic process73/4634218/187232.22e-031.36e-0273
GO:0008209LiverCirrhoticandrogen metabolic process15/463430/187232.45e-031.47e-0215
GO:190136121LiverHCCorganic cyclic compound catabolic process325/7958495/187236.52e-262.18e-23325
Page: 1 2 

check button Enriched KEGG pathways.
Pathway IDTissueDisease StageDescriptionGene RatioBg Ratiopvaluep.adjustqvalueCount
Page: 1 

Top

Cell-cell communication analysis

check buttonIdentification of potential cell-cell interactions between two cell types and their ligand-receptor pairs for different disease states
LigandReceptorLRpairPathwayTissueDisease Stage
Page: 1 

Top

Single-cell gene regulatory network inference analysis

check buttonFind out the significant the regulons (TFs) and the target genes of each regulon across cell types for different disease states
TFCell TypeTissueDisease StageTarget GeneRSSRegulon Activity
∗The dot plots of a searched regulon are shown for all cell subpopulations in each disease state of each tissue based on the regulon specific score inferred using pySCENIC and by calculating the average expression.
Page: 1 

Top

Somatic mutation of malignant transformation related genes

check buttonAnnotation of somatic variants for genes involved in malignant transformation
Hugo SymbolVariant ClassVariant ClassificationdbSNP RSHGVScHGVSpHGVSp ShortSWISSPROTBIOTYPESIFTPolyPhenTumor Sample BarcodeTissueHistologySexAgeStageTherapy TypesDrugsOutcome
HSD17B11insertionNonsense_Mutationnovelc.326_327insCTACCTTGTGTGTGAGATTTCTTACCCTGTCTAATAp.Ala109_Glu110insTyrLeuValCysGluIleSerTyrProValTerTerp.A109_E110insYLVCEISYPV**Q8NBQ5protein_codingTCGA-BH-A0HK-01Breastbreast invasive carcinomaFemale>=65I/IIHormone TherapyarimidexSD
HSD17B11deletionFrame_Shift_Delnovelc.48delNp.Cys17AlafsTer3p.C17Afs*3Q8NBQ5protein_codingTCGA-EW-A2FV-01Breastbreast invasive carcinomaFemale<65III/IVChemotherapydocetaxelSD
HSD17B11SNVMissense_Mutationc.140G>Cp.Gly47Alap.G47AQ8NBQ5protein_codingdeleterious(0)probably_damaging(0.999)TCGA-DR-A0ZM-01Cervixcervical & endocervical cancerFemale<65III/IVUnspecificCisplatinSD
HSD17B11SNVMissense_Mutationc.442N>Tp.His148Tyrp.H148YQ8NBQ5protein_codingdeleterious(0)probably_damaging(1)TCGA-IR-A3LL-01Cervixcervical & endocervical cancerFemale<65I/IIChemotherapycisplatinCR
HSD17B11SNVMissense_Mutationnovelc.193N>Ap.Leu65Ilep.L65IQ8NBQ5protein_codingdeleterious(0)possibly_damaging(0.809)TCGA-CA-6717-01Colorectumcolon adenocarcinomaMale<65I/IIChemotherapyoxaliplatinCR
HSD17B11SNVMissense_Mutationnovelc.315G>Tp.Lys105Asnp.K105NQ8NBQ5protein_codingtolerated(0.22)benign(0.054)TCGA-AG-3892-01Colorectumrectum adenocarcinomaFemale<65I/IIUnknownUnknownSD
HSD17B11deletionFrame_Shift_Delc.9delTp.Leu4PhefsTer11p.L4Ffs*11Q8NBQ5protein_codingTCGA-A6-A566-01Colorectumcolon adenocarcinomaFemale<65III/IVChemotherapyoxaliplatinPD
HSD17B11insertionNonsense_Mutationnovelc.831_832insAAACATTAAAATTp.Leu278LysfsTer3p.L278Kfs*3Q8NBQ5protein_codingTCGA-AM-5820-01Colorectumcolon adenocarcinomaFemale<65I/IIUnknownUnknownSD
HSD17B11SNVMissense_Mutationnovelc.799N>Gp.Thr267Alap.T267AQ8NBQ5protein_codingtolerated(0.06)benign(0.023)TCGA-A5-A2K5-01Endometriumuterine corpus endometrioid carcinomaFemale>=65I/IIUnknownUnknownSD
HSD17B11SNVMissense_Mutationrs562443434c.896C>Tp.Ala299Valp.A299VQ8NBQ5protein_codingtolerated(0.28)benign(0.001)TCGA-A5-A7WJ-01Endometriumuterine corpus endometrioid carcinomaFemale<65I/IIUnknownUnknownSD
Page: 1 2 3 4 

Top

Related drugs of malignant transformation related genes

check buttonIdentification of chemicals and drugs interact with genes involved in malignant transfromation
(DGIdb 4.0)
Entrez IDSymbolCategoryInteraction TypesDrug Claim NameDrug NamePMIDs
Page: 1