
|
|||||
|
 | |
| |
| |
| |
| |
| |
|
Gene: HSD11B2 |
Gene summary for HSD11B2 |
| Gene information | Species | Human | Gene symbol | HSD11B2 | Gene ID | 3291 |
| Gene name | hydroxysteroid 11-beta dehydrogenase 2 | |
| Gene Alias | AME | |
| Cytomap | 16q22.1 | |
| Gene Type | protein-coding | GO ID | GO:0000003 | UniProtAcc | P80365 |
Top |
Malignant transformation analysis |
| Identification of the aberrant gene expression in precancerous and cancerous lesions by comparing the gene expression of stem-like cells in diseased tissues with normal stem cells |
| Entrez ID | Symbol | Replicates | Species | Organ | Tissue | Adj P-value | Log2FC | Malignancy |
| 3291 | HSD11B2 | HTA11_3410_2000001011 | Human | Colorectum | AD | 3.49e-02 | 1.31e-01 | 0.0155 |
| 3291 | HSD11B2 | HTA11_2487_2000001011 | Human | Colorectum | SER | 7.52e-30 | 1.61e+00 | -0.1808 |
| 3291 | HSD11B2 | HTA11_1938_2000001011 | Human | Colorectum | AD | 1.40e-04 | 4.95e-01 | -0.0811 |
| 3291 | HSD11B2 | HTA11_78_2000001011 | Human | Colorectum | AD | 3.26e-19 | 1.37e+00 | -0.1088 |
| 3291 | HSD11B2 | HTA11_347_2000001011 | Human | Colorectum | AD | 8.28e-54 | 1.69e+00 | -0.1954 |
| 3291 | HSD11B2 | HTA11_411_2000001011 | Human | Colorectum | SER | 3.62e-10 | 1.75e+00 | -0.2602 |
| 3291 | HSD11B2 | HTA11_2112_2000001011 | Human | Colorectum | SER | 2.22e-10 | 1.31e+00 | -0.2196 |
| 3291 | HSD11B2 | HTA11_3361_2000001011 | Human | Colorectum | AD | 1.88e-33 | 1.84e+00 | -0.1207 |
| 3291 | HSD11B2 | HTA11_83_2000001011 | Human | Colorectum | SER | 2.25e-18 | 1.25e+00 | -0.1526 |
| 3291 | HSD11B2 | HTA11_696_2000001011 | Human | Colorectum | AD | 1.22e-73 | 2.47e+00 | -0.1464 |
| 3291 | HSD11B2 | HTA11_866_2000001011 | Human | Colorectum | AD | 4.37e-34 | 1.30e+00 | -0.1001 |
| 3291 | HSD11B2 | HTA11_1391_2000001011 | Human | Colorectum | AD | 1.08e-20 | 1.15e+00 | -0.059 |
| 3291 | HSD11B2 | HTA11_2992_2000001011 | Human | Colorectum | SER | 2.25e-13 | 1.70e+00 | -0.1706 |
| 3291 | HSD11B2 | HTA11_5212_2000001011 | Human | Colorectum | AD | 2.63e-19 | 1.67e+00 | -0.2061 |
| 3291 | HSD11B2 | HTA11_5216_2000001011 | Human | Colorectum | SER | 1.31e-16 | 1.76e+00 | -0.1462 |
| 3291 | HSD11B2 | HTA11_546_2000001011 | Human | Colorectum | AD | 1.05e-16 | 1.37e+00 | -0.0842 |
| 3291 | HSD11B2 | HTA11_10623_2000001011 | Human | Colorectum | AD | 2.64e-03 | 5.60e-01 | -0.0177 |
| 3291 | HSD11B2 | HTA11_7696_3000711011 | Human | Colorectum | AD | 6.76e-29 | 9.79e-01 | 0.0674 |
| 3291 | HSD11B2 | HTA11_6818_2000001011 | Human | Colorectum | AD | 7.23e-03 | 6.02e-01 | 0.0112 |
| 3291 | HSD11B2 | A002-C-010 | Human | Colorectum | FAP | 2.06e-02 | -2.36e-01 | 0.242 |
| Page: 1 2 3 |
| Tissue | Expression Dynamics | Abbreviation |
| Colorectum (GSE201348) |  | FAP: Familial adenomatous polyposis |
| CRC: Colorectal cancer | ||
| Colorectum (HTA11) | 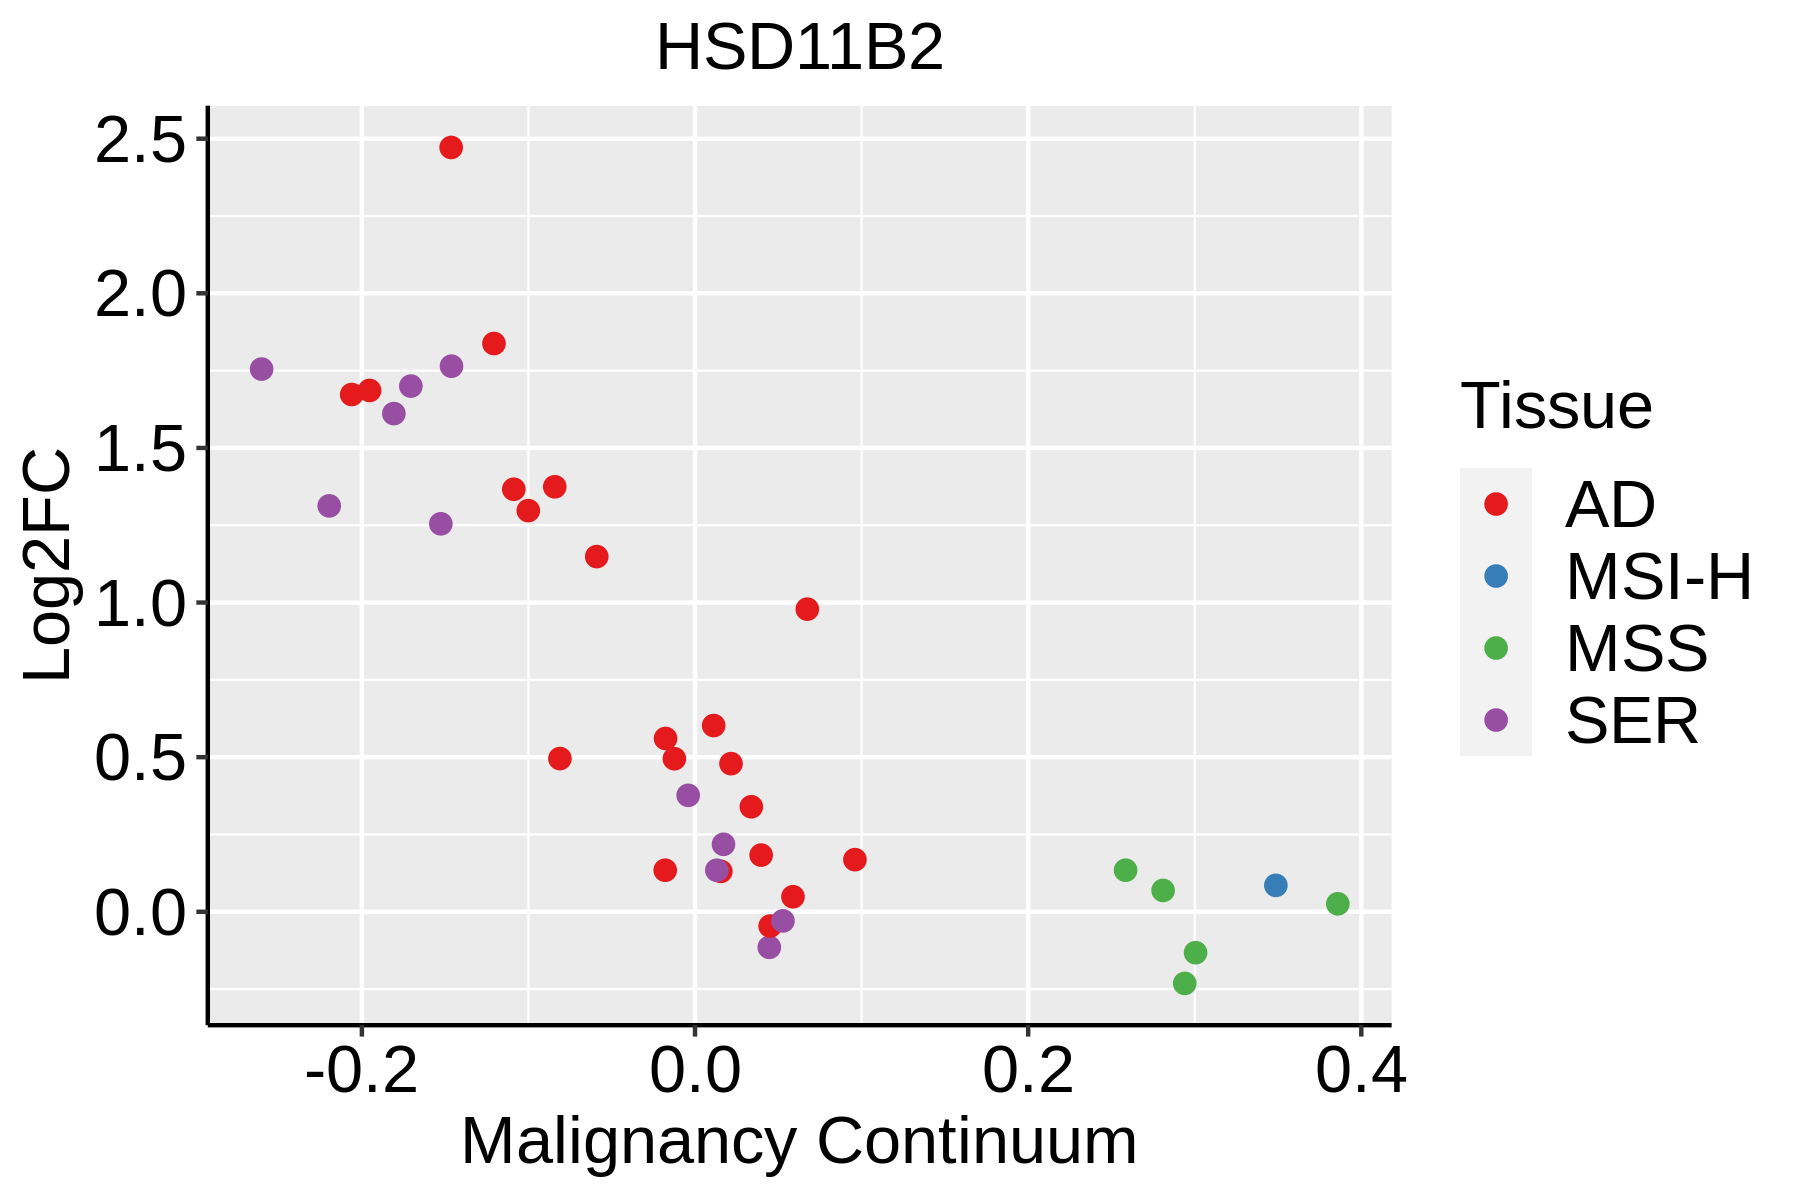 | AD: Adenomas |
| SER: Sessile serrated lesions | ||
| MSI-H: Microsatellite-high colorectal cancer | ||
| MSS: Microsatellite stable colorectal cancer | ||
| Liver | 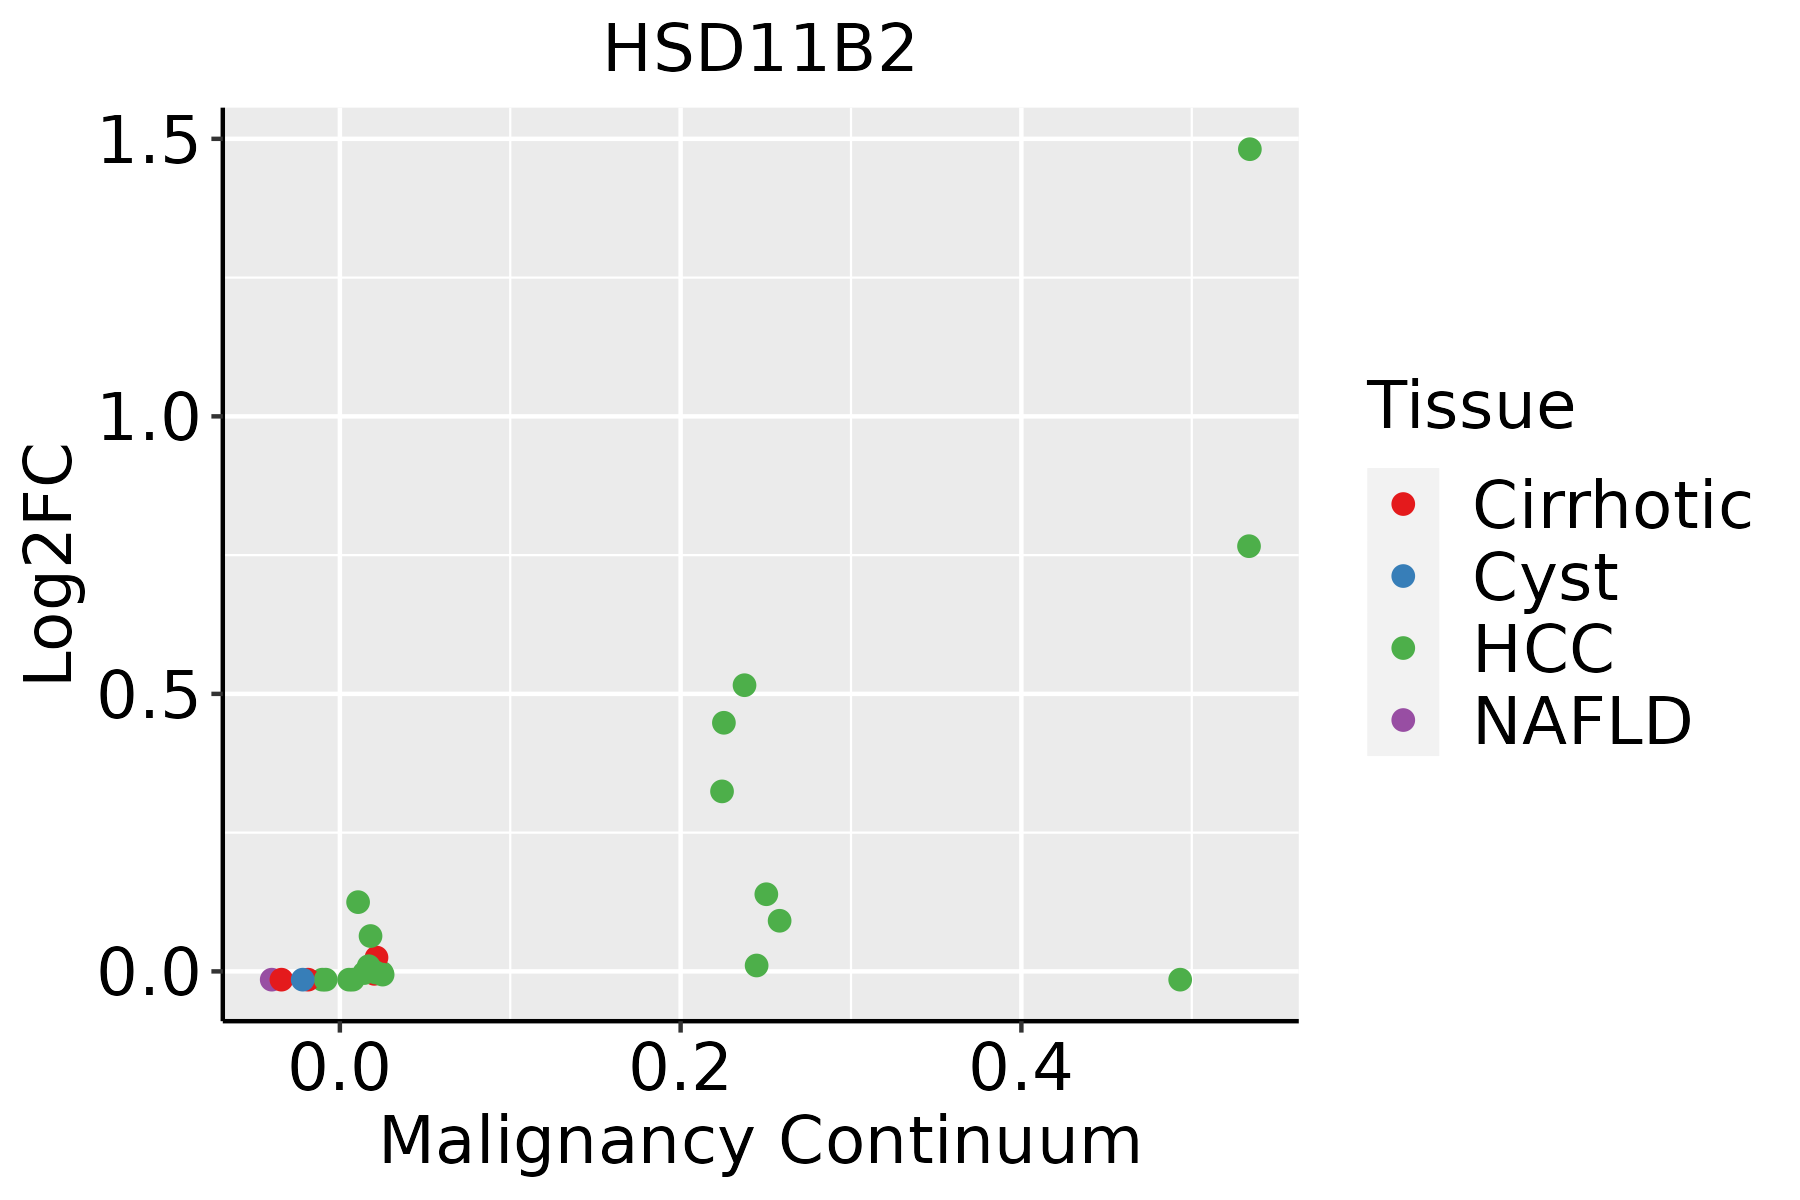 | HCC: Hepatocellular carcinoma |
| NAFLD: Non-alcoholic fatty liver disease |
| ∗log2FC in expression of this searched gene in stem-like cells from each diseased tissue sample relative to stem-like cells in normal samples in each tissue plotted against the malignancy continuum. Samples are colored based on if they are from different disease stage. |
Top |
Malignant transformation related pathway analysis |
| Find out the enriched GO biological processes and KEGG pathways involved in transition from healthy to precancer to cancer |
| Tissue | Disease Stage | Enriched GO biological Processes |
| Colorectum | AD |  |
| Colorectum | SER |  |
| Colorectum | MSS |  |
| Colorectum | MSI-H |  |
| Colorectum | FAP |  |
| ∗Top 15 enriched GO BP terms are showed in the bar plot of each disease state in each tissue. Each row represents a significant GO biological process which is colored according to the -log10(p.adjust). |
| Page: 1 2 3 4 5 6 7 8 9 |
| GO ID | Tissue | Disease Stage | Description | Gene Ratio | Bg Ratio | pvalue | p.adjust | Count |
| GO:0032868 | Colorectum | AD | response to insulin | 91/3918 | 264/18723 | 2.02e-07 | 8.48e-06 | 91 |
| GO:0043434 | Colorectum | AD | response to peptide hormone | 126/3918 | 414/18723 | 2.70e-06 | 7.86e-05 | 126 |
| GO:0031667 | Colorectum | AD | response to nutrient levels | 138/3918 | 474/18723 | 1.22e-05 | 2.68e-04 | 138 |
| GO:0048545 | Colorectum | AD | response to steroid hormone | 104/3918 | 339/18723 | 1.33e-05 | 2.90e-04 | 104 |
| GO:0050878 | Colorectum | AD | regulation of body fluid levels | 108/3918 | 379/18723 | 2.54e-04 | 3.20e-03 | 108 |
| GO:0009410 | Colorectum | AD | response to xenobiotic stimulus | 128/3918 | 462/18723 | 2.69e-04 | 3.31e-03 | 128 |
| GO:0070482 | Colorectum | AD | response to oxygen levels | 99/3918 | 347/18723 | 4.29e-04 | 4.82e-03 | 99 |
| GO:0001666 | Colorectum | AD | response to hypoxia | 86/3918 | 307/18723 | 1.77e-03 | 1.46e-02 | 86 |
| GO:0036293 | Colorectum | AD | response to decreased oxygen levels | 88/3918 | 322/18723 | 3.42e-03 | 2.49e-02 | 88 |
| GO:0003014 | Colorectum | AD | renal system process | 35/3918 | 110/18723 | 4.85e-03 | 3.27e-02 | 35 |
| GO:0008202 | Colorectum | AD | steroid metabolic process | 85/3918 | 319/18723 | 8.07e-03 | 4.75e-02 | 85 |
| GO:00316671 | Colorectum | SER | response to nutrient levels | 106/2897 | 474/18723 | 3.94e-05 | 1.00e-03 | 106 |
| GO:00485451 | Colorectum | SER | response to steroid hormone | 80/2897 | 339/18723 | 5.15e-05 | 1.25e-03 | 80 |
| GO:00328681 | Colorectum | SER | response to insulin | 65/2897 | 264/18723 | 6.70e-05 | 1.53e-03 | 65 |
| GO:00434341 | Colorectum | SER | response to peptide hormone | 93/2897 | 414/18723 | 9.61e-05 | 2.04e-03 | 93 |
| GO:00704821 | Colorectum | SER | response to oxygen levels | 79/2897 | 347/18723 | 1.99e-04 | 3.64e-03 | 79 |
| GO:00016661 | Colorectum | SER | response to hypoxia | 69/2897 | 307/18723 | 7.07e-04 | 9.39e-03 | 69 |
| GO:00362931 | Colorectum | SER | response to decreased oxygen levels | 71/2897 | 322/18723 | 1.04e-03 | 1.22e-02 | 71 |
| GO:00030141 | Colorectum | SER | renal system process | 30/2897 | 110/18723 | 1.05e-03 | 1.22e-02 | 30 |
| GO:00508781 | Colorectum | SER | regulation of body fluid levels | 81/2897 | 379/18723 | 1.28e-03 | 1.43e-02 | 81 |
| Page: 1 2 3 |
| Pathway ID | Tissue | Disease Stage | Description | Gene Ratio | Bg Ratio | pvalue | p.adjust | qvalue | Count |
| hsa04960 | Colorectum | FAP | Aldosterone-regulated sodium reabsorption | 13/1404 | 37/8465 | 4.79e-03 | 1.91e-02 | 1.16e-02 | 13 |
| hsa049601 | Colorectum | FAP | Aldosterone-regulated sodium reabsorption | 13/1404 | 37/8465 | 4.79e-03 | 1.91e-02 | 1.16e-02 | 13 |
| hsa049602 | Colorectum | CRC | Aldosterone-regulated sodium reabsorption | 12/1091 | 37/8465 | 1.66e-03 | 1.20e-02 | 8.16e-03 | 12 |
| hsa049603 | Colorectum | CRC | Aldosterone-regulated sodium reabsorption | 12/1091 | 37/8465 | 1.66e-03 | 1.20e-02 | 8.16e-03 | 12 |
| Page: 1 |
Top |
Cell-cell communication analysis |
| Identification of potential cell-cell interactions between two cell types and their ligand-receptor pairs for different disease states |
| Ligand | Receptor | LRpair | Pathway | Tissue | Disease Stage |
| Page: 1 |
Top |
Single-cell gene regulatory network inference analysis |
| Find out the significant the regulons (TFs) and the target genes of each regulon across cell types for different disease states |
| TF | Cell Type | Tissue | Disease Stage | Target Gene | RSS | Regulon Activity |
| ∗The dot plots of a searched regulon are shown for all cell subpopulations in each disease state of each tissue based on the regulon specific score inferred using pySCENIC and by calculating the average expression. |
| Page: 1 |
Top |
Somatic mutation of malignant transformation related genes |
| Annotation of somatic variants for genes involved in malignant transformation |
| Hugo Symbol | Variant Class | Variant Classification | dbSNP RS | HGVSc | HGVSp | HGVSp Short | SWISSPROT | BIOTYPE | SIFT | PolyPhen | Tumor Sample Barcode | Tissue | Histology | Sex | Age | Stage | Therapy Types | Drugs | Outcome |
| HSD11B2 | SNV | Missense_Mutation | novel | c.346T>G | p.Leu116Val | p.L116V | P80365 | protein_coding | tolerated(0.49) | benign(0.155) | TCGA-EA-A5ZE-01 | Cervix | cervical & endocervical cancer | Female | <65 | I/II | Unknown | Unknown | PD |
| HSD11B2 | SNV | Missense_Mutation | rs560632514 | c.586G>A | p.Ala196Thr | p.A196T | P80365 | protein_coding | tolerated(0.84) | benign(0.031) | TCGA-AZ-6601-01 | Colorectum | colon adenocarcinoma | Male | >=65 | I/II | Unknown | Unknown | PD |
| HSD11B2 | SNV | Missense_Mutation | c.738C>G | p.Phe246Leu | p.F246L | P80365 | protein_coding | tolerated(0.45) | benign(0.048) | TCGA-CM-4752-01 | Colorectum | colon adenocarcinoma | Male | <65 | I/II | Unknown | Unknown | SD | |
| HSD11B2 | SNV | Missense_Mutation | novel | c.337N>A | p.Val113Ile | p.V113I | P80365 | protein_coding | deleterious(0) | probably_damaging(0.999) | TCGA-A5-A1OF-01 | Endometrium | uterine corpus endometrioid carcinoma | Female | <65 | I/II | Unknown | Unknown | SD |
| HSD11B2 | SNV | Missense_Mutation | rs749323350 | c.1124N>T | p.Ala375Val | p.A375V | P80365 | protein_coding | deleterious(0.03) | probably_damaging(0.972) | TCGA-AJ-A2QO-01 | Endometrium | uterine corpus endometrioid carcinoma | Female | >=65 | I/II | Unknown | Unknown | SD |
| HSD11B2 | SNV | Missense_Mutation | rs145099420 | c.1165N>A | p.Ala389Thr | p.A389T | P80365 | protein_coding | tolerated_low_confidence(0.3) | benign(0) | TCGA-AX-A0J1-01 | Endometrium | uterine corpus endometrioid carcinoma | Female | >=65 | I/II | Unknown | Unknown | SD |
| HSD11B2 | SNV | Missense_Mutation | rs755994842 | c.530N>T | p.Ala177Val | p.A177V | P80365 | protein_coding | tolerated(0.41) | benign(0.013) | TCGA-AX-A2HA-01 | Endometrium | uterine corpus endometrioid carcinoma | Female | <65 | I/II | Unknown | Unknown | SD |
| HSD11B2 | SNV | Missense_Mutation | rs779034293 | c.638N>A | p.Arg213His | p.R213H | P80365 | protein_coding | deleterious(0) | probably_damaging(0.999) | TCGA-D1-A175-01 | Endometrium | uterine corpus endometrioid carcinoma | Female | <65 | I/II | Chemotherapy | paclitaxel | SD |
| HSD11B2 | SNV | Missense_Mutation | novel | c.952N>A | p.Leu318Ile | p.L318I | P80365 | protein_coding | deleterious(0) | benign(0.258) | TCGA-DF-A2KU-01 | Endometrium | uterine corpus endometrioid carcinoma | Female | Unknown | I/II | Unknown | Unknown | SD |
| HSD11B2 | SNV | Missense_Mutation | rs778006489 | c.518N>C | p.Val173Ala | p.V173A | P80365 | protein_coding | tolerated(0.47) | benign(0.103) | TCGA-DI-A0WH-01 | Endometrium | uterine corpus endometrioid carcinoma | Female | <65 | I/II | Unknown | Unknown | SD |
| Page: 1 2 |
Top |
Related drugs of malignant transformation related genes |
| Identification of chemicals and drugs interact with genes involved in malignant transfromation |
| (DGIdb 4.0) |
| Entrez ID | Symbol | Category | Interaction Types | Drug Claim Name | Drug Name | PMIDs |
| 3291 | HSD11B2 | DRUGGABLE GENOME, SHORT CHAIN DEHYDROGENASE REDUCTASE, ENZYME | RG-7234 | |||
| 3291 | HSD11B2 | DRUGGABLE GENOME, SHORT CHAIN DEHYDROGENASE REDUCTASE, ENZYME | CORTISOL | HYDROCORTISONE | 12788832,15134813 |
| Page: 1 |

Copyright 2023-Present -The University of Texas Health Science Center at Houston |