
|
|||||
|
 | |
| |
| |
| |
| |
| |
|
Gene: HSCB |
Gene summary for HSCB |
| Gene information | Species | Human | Gene symbol | HSCB | Gene ID | 150274 |
| Gene name | HscB mitochondrial iron-sulfur cluster cochaperone | |
| Gene Alias | DNAJC20 | |
| Cytomap | 22q12.1 | |
| Gene Type | protein-coding | GO ID | GO:0006790 | UniProtAcc | B0QYH2 |
Top |
Malignant transformation analysis |
| Identification of the aberrant gene expression in precancerous and cancerous lesions by comparing the gene expression of stem-like cells in diseased tissues with normal stem cells |
| Entrez ID | Symbol | Replicates | Species | Organ | Tissue | Adj P-value | Log2FC | Malignancy |
| 150274 | HSCB | LZE4T | Human | Esophagus | ESCC | 1.87e-03 | 1.09e-01 | 0.0811 |
| 150274 | HSCB | LZE7T | Human | Esophagus | ESCC | 5.98e-05 | 2.00e-01 | 0.0667 |
| 150274 | HSCB | LZE8T | Human | Esophagus | ESCC | 2.32e-04 | 1.39e-01 | 0.067 |
| 150274 | HSCB | LZE24T | Human | Esophagus | ESCC | 3.37e-18 | 4.40e-01 | 0.0596 |
| 150274 | HSCB | LZE6T | Human | Esophagus | ESCC | 9.10e-06 | 1.67e-01 | 0.0845 |
| 150274 | HSCB | P1T-E | Human | Esophagus | ESCC | 1.82e-06 | 5.02e-01 | 0.0875 |
| 150274 | HSCB | P2T-E | Human | Esophagus | ESCC | 5.18e-27 | 3.88e-01 | 0.1177 |
| 150274 | HSCB | P4T-E | Human | Esophagus | ESCC | 8.19e-24 | 6.22e-01 | 0.1323 |
| 150274 | HSCB | P5T-E | Human | Esophagus | ESCC | 2.50e-08 | 1.07e-01 | 0.1327 |
| 150274 | HSCB | P8T-E | Human | Esophagus | ESCC | 1.13e-24 | 4.75e-01 | 0.0889 |
| 150274 | HSCB | P9T-E | Human | Esophagus | ESCC | 3.13e-16 | 4.74e-01 | 0.1131 |
| 150274 | HSCB | P10T-E | Human | Esophagus | ESCC | 1.57e-34 | 5.93e-01 | 0.116 |
| 150274 | HSCB | P11T-E | Human | Esophagus | ESCC | 6.13e-10 | 3.32e-01 | 0.1426 |
| 150274 | HSCB | P12T-E | Human | Esophagus | ESCC | 3.50e-35 | 4.92e-01 | 0.1122 |
| 150274 | HSCB | P15T-E | Human | Esophagus | ESCC | 1.63e-19 | 4.38e-01 | 0.1149 |
| 150274 | HSCB | P16T-E | Human | Esophagus | ESCC | 7.29e-17 | 3.26e-01 | 0.1153 |
| 150274 | HSCB | P17T-E | Human | Esophagus | ESCC | 2.98e-04 | 3.18e-01 | 0.1278 |
| 150274 | HSCB | P19T-E | Human | Esophagus | ESCC | 3.14e-03 | 4.08e-01 | 0.1662 |
| 150274 | HSCB | P20T-E | Human | Esophagus | ESCC | 1.85e-16 | 4.00e-01 | 0.1124 |
| 150274 | HSCB | P21T-E | Human | Esophagus | ESCC | 1.53e-21 | 2.11e-01 | 0.1617 |
| Page: 1 2 3 4 5 |
| Tissue | Expression Dynamics | Abbreviation |
| Esophagus | 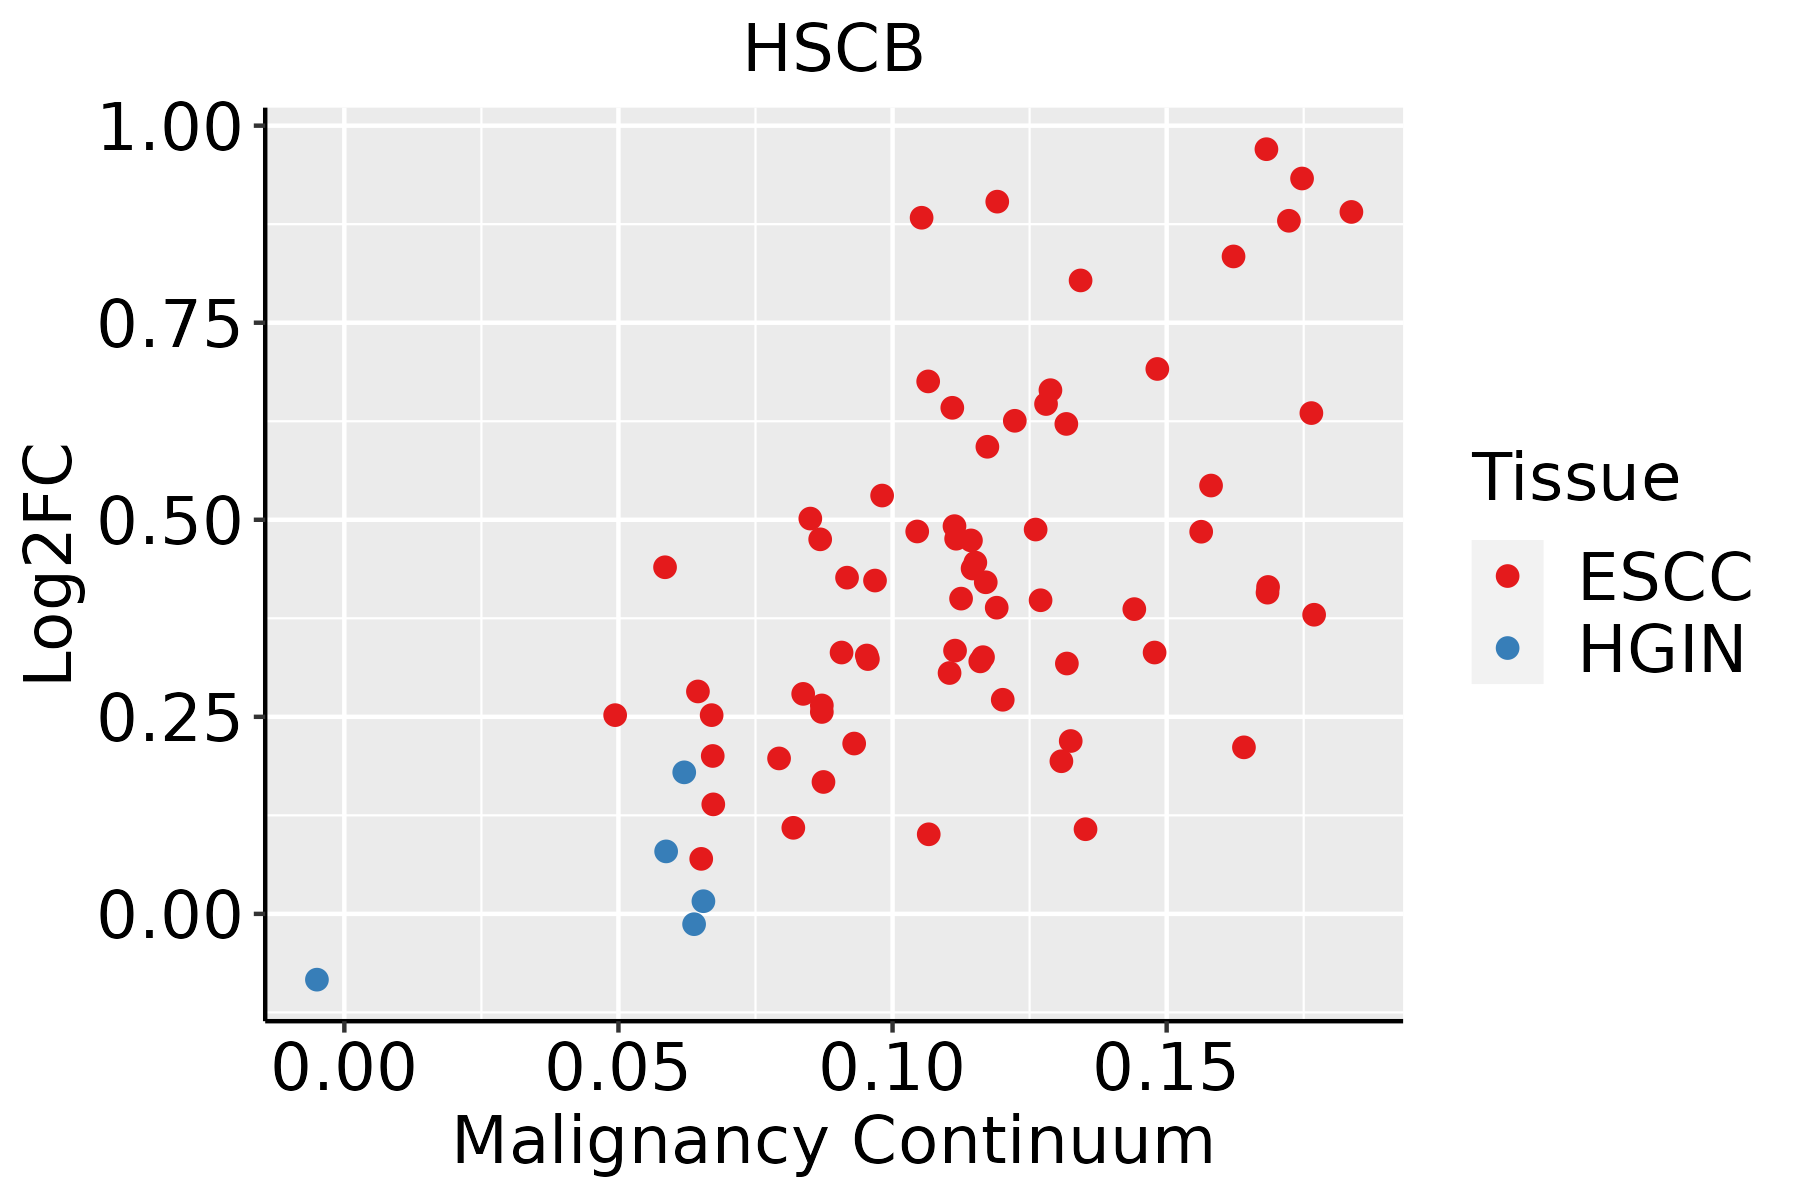 | ESCC: Esophageal squamous cell carcinoma |
| HGIN: High-grade intraepithelial neoplasias | ||
| LGIN: Low-grade intraepithelial neoplasias | ||
| Liver | 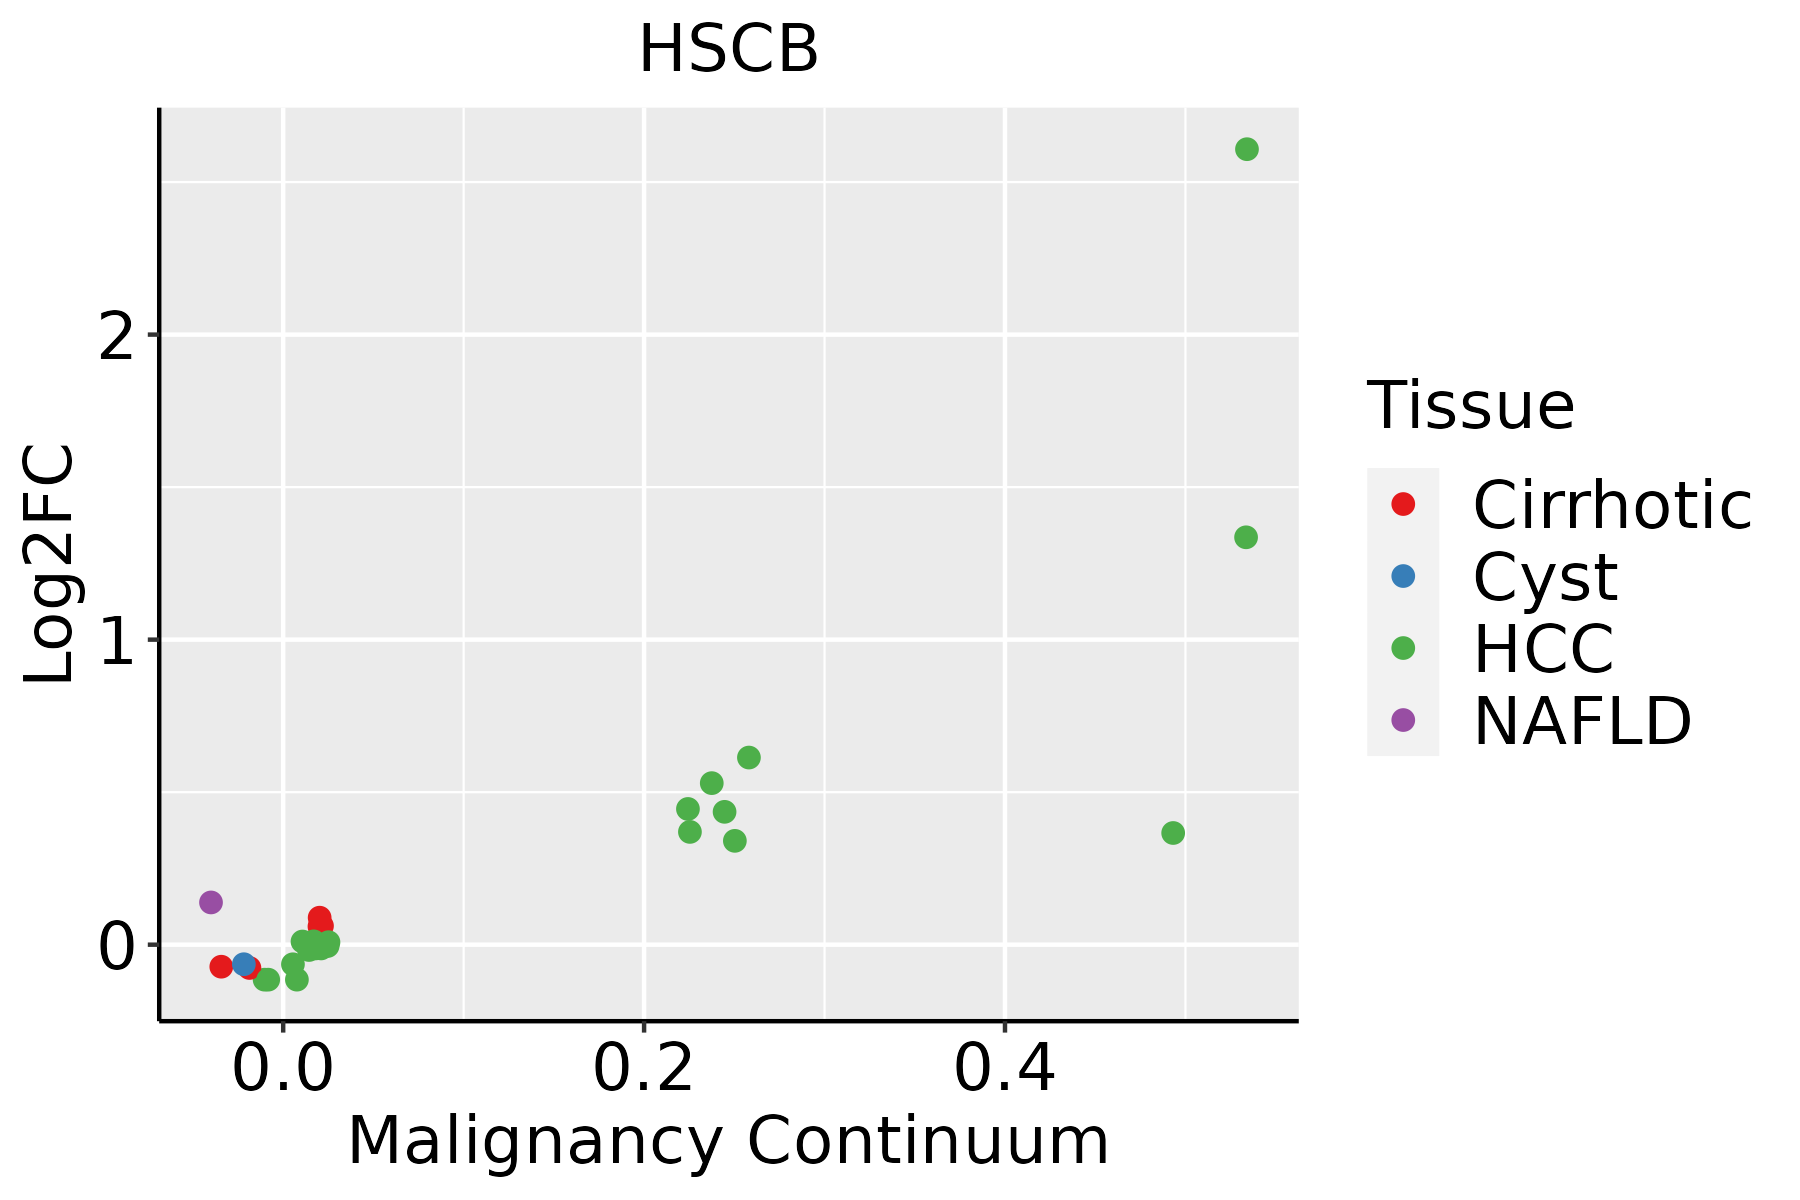 | HCC: Hepatocellular carcinoma |
| NAFLD: Non-alcoholic fatty liver disease | ||
| Oral Cavity |  | EOLP: Erosive Oral lichen planus |
| LP: leukoplakia | ||
| NEOLP: Non-erosive oral lichen planus | ||
| OSCC: Oral squamous cell carcinoma |
| ∗log2FC in expression of this searched gene in stem-like cells from each diseased tissue sample relative to stem-like cells in normal samples in each tissue plotted against the malignancy continuum. Samples are colored based on if they are from different disease stage. |
Top |
Malignant transformation related pathway analysis |
| Find out the enriched GO biological processes and KEGG pathways involved in transition from healthy to precancer to cancer |
| Tissue | Disease Stage | Enriched GO biological Processes |
| Colorectum | AD |  |
| Colorectum | SER |  |
| Colorectum | MSS |  |
| Colorectum | MSI-H |  |
| Colorectum | FAP |  |
| ∗Top 15 enriched GO BP terms are showed in the bar plot of each disease state in each tissue. Each row represents a significant GO biological process which is colored according to the -log10(p.adjust). |
| Page: 1 2 3 4 5 6 7 8 9 |
| GO ID | Tissue | Disease Stage | Description | Gene Ratio | Bg Ratio | pvalue | p.adjust | Count |
| GO:005160418 | Esophagus | ESCC | protein maturation | 189/8552 | 294/18723 | 7.64e-11 | 2.39e-09 | 189 |
| GO:00067906 | Esophagus | ESCC | sulfur compound metabolic process | 201/8552 | 339/18723 | 2.64e-07 | 3.94e-06 | 201 |
| GO:001622611 | Esophagus | ESCC | iron-sulfur cluster assembly | 21/8552 | 26/18723 | 2.69e-04 | 1.63e-03 | 21 |
| GO:003116311 | Esophagus | ESCC | metallo-sulfur cluster assembly | 21/8552 | 26/18723 | 2.69e-04 | 1.63e-03 | 21 |
| GO:009742811 | Esophagus | ESCC | protein maturation by iron-sulfur cluster transfer | 14/8552 | 16/18723 | 6.78e-04 | 3.56e-03 | 14 |
| GO:00512592 | Esophagus | ESCC | protein complex oligomerization | 130/8552 | 238/18723 | 3.29e-03 | 1.36e-02 | 130 |
| GO:00516046 | Liver | Cirrhotic | protein maturation | 121/4634 | 294/18723 | 3.54e-10 | 1.68e-08 | 121 |
| GO:000679011 | Liver | Cirrhotic | sulfur compound metabolic process | 129/4634 | 339/18723 | 3.06e-08 | 1.04e-06 | 129 |
| GO:000679021 | Liver | HCC | sulfur compound metabolic process | 212/7958 | 339/18723 | 5.60e-14 | 3.39e-12 | 212 |
| GO:005160412 | Liver | HCC | protein maturation | 171/7958 | 294/18723 | 3.80e-08 | 8.30e-07 | 171 |
| GO:0016226 | Liver | HCC | iron-sulfur cluster assembly | 18/7958 | 26/18723 | 5.37e-03 | 2.24e-02 | 18 |
| GO:0031163 | Liver | HCC | metallo-sulfur cluster assembly | 18/7958 | 26/18723 | 5.37e-03 | 2.24e-02 | 18 |
| GO:005160410 | Oral cavity | OSCC | protein maturation | 170/7305 | 294/18723 | 3.97e-11 | 1.28e-09 | 170 |
| GO:00067905 | Oral cavity | OSCC | sulfur compound metabolic process | 168/7305 | 339/18723 | 4.50e-05 | 3.84e-04 | 168 |
| GO:0051259 | Oral cavity | OSCC | protein complex oligomerization | 121/7305 | 238/18723 | 1.29e-04 | 9.21e-04 | 121 |
| GO:00162262 | Oral cavity | OSCC | iron-sulfur cluster assembly | 19/7305 | 26/18723 | 4.46e-04 | 2.70e-03 | 19 |
| GO:00311632 | Oral cavity | OSCC | metallo-sulfur cluster assembly | 19/7305 | 26/18723 | 4.46e-04 | 2.70e-03 | 19 |
| GO:0097428 | Oral cavity | OSCC | protein maturation by iron-sulfur cluster transfer | 11/7305 | 16/18723 | 1.56e-02 | 4.99e-02 | 11 |
| GO:005160416 | Oral cavity | LP | protein maturation | 122/4623 | 294/18723 | 1.37e-10 | 7.72e-09 | 122 |
| GO:00512591 | Oral cavity | LP | protein complex oligomerization | 85/4623 | 238/18723 | 8.81e-05 | 1.11e-03 | 85 |
| Page: 1 2 |
| Pathway ID | Tissue | Disease Stage | Description | Gene Ratio | Bg Ratio | pvalue | p.adjust | qvalue | Count |
| Page: 1 |
Top |
Cell-cell communication analysis |
| Identification of potential cell-cell interactions between two cell types and their ligand-receptor pairs for different disease states |
| Ligand | Receptor | LRpair | Pathway | Tissue | Disease Stage |
| Page: 1 |
Top |
Single-cell gene regulatory network inference analysis |
| Find out the significant the regulons (TFs) and the target genes of each regulon across cell types for different disease states |
| TF | Cell Type | Tissue | Disease Stage | Target Gene | RSS | Regulon Activity |
| ∗The dot plots of a searched regulon are shown for all cell subpopulations in each disease state of each tissue based on the regulon specific score inferred using pySCENIC and by calculating the average expression. |
| Page: 1 |
Top |
Somatic mutation of malignant transformation related genes |
| Annotation of somatic variants for genes involved in malignant transformation |
| Hugo Symbol | Variant Class | Variant Classification | dbSNP RS | HGVSc | HGVSp | HGVSp Short | SWISSPROT | BIOTYPE | SIFT | PolyPhen | Tumor Sample Barcode | Tissue | Histology | Sex | Age | Stage | Therapy Types | Drugs | Outcome |
| HSCB | SNV | Missense_Mutation | rs773726014 | c.85N>A | p.Asp29Asn | p.D29N | Q8IWL3 | protein_coding | tolerated(1) | benign(0) | TCGA-AC-A23H-01 | Breast | breast invasive carcinoma | Female | >=65 | I/II | Unknown | Unknown | PD |
| HSCB | SNV | Missense_Mutation | novel | c.507T>A | p.Asn169Lys | p.N169K | Q8IWL3 | protein_coding | deleterious(0) | probably_damaging(1) | TCGA-AR-A24X-01 | Breast | breast invasive carcinoma | Female | <65 | I/II | Hormone Therapy | tamoxiphen | SD |
| HSCB | deletion | Frame_Shift_Del | c.363delG | p.Thr122ProfsTer3 | p.T122Pfs*3 | Q8IWL3 | protein_coding | TCGA-EW-A2FV-01 | Breast | breast invasive carcinoma | Female | <65 | III/IV | Chemotherapy | docetaxel | SD | |||
| HSCB | SNV | Missense_Mutation | novel | c.543N>A | p.Met181Ile | p.M181I | Q8IWL3 | protein_coding | tolerated(0.89) | benign(0.001) | TCGA-UC-A7PG-06 | Cervix | cervical & endocervical cancer | Female | <65 | III/IV | Chemotherapy | cisplatin | PD |
| HSCB | SNV | Missense_Mutation | rs768337799 | c.295N>T | p.Arg99Cys | p.R99C | Q8IWL3 | protein_coding | deleterious(0.02) | probably_damaging(0.986) | TCGA-5M-AAT6-01 | Colorectum | colon adenocarcinoma | Female | <65 | III/IV | Unknown | Unknown | PD |
| HSCB | SNV | Missense_Mutation | c.260C>T | p.Thr87Ile | p.T87I | Q8IWL3 | protein_coding | tolerated(0.22) | benign(0.014) | TCGA-A6-6781-01 | Colorectum | colon adenocarcinoma | Male | <65 | III/IV | Chemotherapy | oxaliplatin | SD | |
| HSCB | SNV | Missense_Mutation | c.539N>T | p.Ala180Val | p.A180V | Q8IWL3 | protein_coding | tolerated(0.17) | benign(0.213) | TCGA-D5-6930-01 | Colorectum | colon adenocarcinoma | Male | >=65 | I/II | Unknown | Unknown | SD | |
| HSCB | SNV | Missense_Mutation | novel | c.313N>A | p.Phe105Ile | p.F105I | Q8IWL3 | protein_coding | tolerated(0.38) | benign(0.376) | TCGA-AG-3892-01 | Colorectum | rectum adenocarcinoma | Female | <65 | I/II | Unknown | Unknown | SD |
| HSCB | SNV | Missense_Mutation | rs535969441 | c.296N>A | p.Arg99His | p.R99H | Q8IWL3 | protein_coding | deleterious(0.02) | benign(0.26) | TCGA-A5-A0GR-01 | Endometrium | uterine corpus endometrioid carcinoma | Female | >=65 | I/II | Unknown | Unknown | SD |
| HSCB | SNV | Missense_Mutation | rs774561408 | c.362N>T | p.Ser121Leu | p.S121L | Q8IWL3 | protein_coding | deleterious(0) | probably_damaging(1) | TCGA-A5-A2K5-01 | Endometrium | uterine corpus endometrioid carcinoma | Female | >=65 | I/II | Unknown | Unknown | SD |
| Page: 1 2 3 |
Top |
Related drugs of malignant transformation related genes |
| Identification of chemicals and drugs interact with genes involved in malignant transfromation |
| (DGIdb 4.0) |
| Entrez ID | Symbol | Category | Interaction Types | Drug Claim Name | Drug Name | PMIDs |
| Page: 1 |

Copyright 2023-Present -The University of Texas Health Science Center at Houston |