
|
|||||
|
 | |
| |
| |
| |
| |
| |
|
Gene: HSBP1L1 |
Gene summary for HSBP1L1 |
| Gene information | Species | Human | Gene symbol | HSBP1L1 | Gene ID | 440498 |
| Gene name | heat shock factor binding protein 1 like 1 | |
| Gene Alias | HSBP1L1 | |
| Cytomap | 18q23 | |
| Gene Type | protein-coding | GO ID | GO:0006139 | UniProtAcc | C9JCN9 |
Top |
Malignant transformation analysis |
| Identification of the aberrant gene expression in precancerous and cancerous lesions by comparing the gene expression of stem-like cells in diseased tissues with normal stem cells |
| Entrez ID | Symbol | Replicates | Species | Organ | Tissue | Adj P-value | Log2FC | Malignancy |
| 440498 | HSBP1L1 | HTA11_347_2000001011 | Human | Colorectum | AD | 2.59e-15 | 5.80e-01 | -0.1954 |
| 440498 | HSBP1L1 | A015-C-203 | Human | Colorectum | FAP | 4.90e-04 | -6.15e-02 | -0.1294 |
| 440498 | HSBP1L1 | A002-C-205 | Human | Colorectum | FAP | 1.47e-02 | -1.30e-01 | -0.1236 |
| 440498 | HSBP1L1 | A015-C-104 | Human | Colorectum | FAP | 5.05e-04 | -7.79e-02 | -0.1899 |
| 440498 | HSBP1L1 | A002-C-016 | Human | Colorectum | FAP | 7.23e-03 | -1.25e-01 | 0.0521 |
| 440498 | HSBP1L1 | A002-C-116 | Human | Colorectum | FAP | 7.14e-06 | -1.41e-01 | -0.0452 |
| 440498 | HSBP1L1 | A018-E-020 | Human | Colorectum | FAP | 4.77e-02 | -1.44e-01 | -0.2034 |
| 440498 | HSBP1L1 | F034 | Human | Colorectum | FAP | 7.39e-03 | -4.44e-02 | -0.0665 |
| 440498 | HSBP1L1 | LZE4T | Human | Esophagus | ESCC | 3.36e-02 | -1.52e-02 | 0.0811 |
| 440498 | HSBP1L1 | LZE22D1 | Human | Esophagus | HGIN | 3.30e-02 | 3.09e-02 | 0.0595 |
| 440498 | HSBP1L1 | LZE22T | Human | Esophagus | ESCC | 1.88e-05 | 1.70e-01 | 0.068 |
| 440498 | HSBP1L1 | LZE24T | Human | Esophagus | ESCC | 8.46e-11 | 4.03e-01 | 0.0596 |
| 440498 | HSBP1L1 | LZE21T | Human | Esophagus | ESCC | 1.61e-04 | 3.97e-01 | 0.0655 |
| 440498 | HSBP1L1 | P1T-E | Human | Esophagus | ESCC | 3.09e-13 | 1.00e+00 | 0.0875 |
| 440498 | HSBP1L1 | P2T-E | Human | Esophagus | ESCC | 1.52e-23 | 2.48e-01 | 0.1177 |
| 440498 | HSBP1L1 | P4T-E | Human | Esophagus | ESCC | 8.44e-24 | 5.75e-01 | 0.1323 |
| 440498 | HSBP1L1 | P5T-E | Human | Esophagus | ESCC | 3.56e-12 | 1.11e-01 | 0.1327 |
| 440498 | HSBP1L1 | P8T-E | Human | Esophagus | ESCC | 2.01e-20 | 4.63e-01 | 0.0889 |
| 440498 | HSBP1L1 | P9T-E | Human | Esophagus | ESCC | 1.73e-15 | 2.77e-01 | 0.1131 |
| 440498 | HSBP1L1 | P10T-E | Human | Esophagus | ESCC | 1.68e-27 | 5.08e-01 | 0.116 |
| Page: 1 2 3 4 5 6 |
| Tissue | Expression Dynamics | Abbreviation |
| Colorectum (GSE201348) |  | FAP: Familial adenomatous polyposis |
| CRC: Colorectal cancer | ||
| Colorectum (HTA11) |  | AD: Adenomas |
| SER: Sessile serrated lesions | ||
| MSI-H: Microsatellite-high colorectal cancer | ||
| MSS: Microsatellite stable colorectal cancer | ||
| Esophagus | 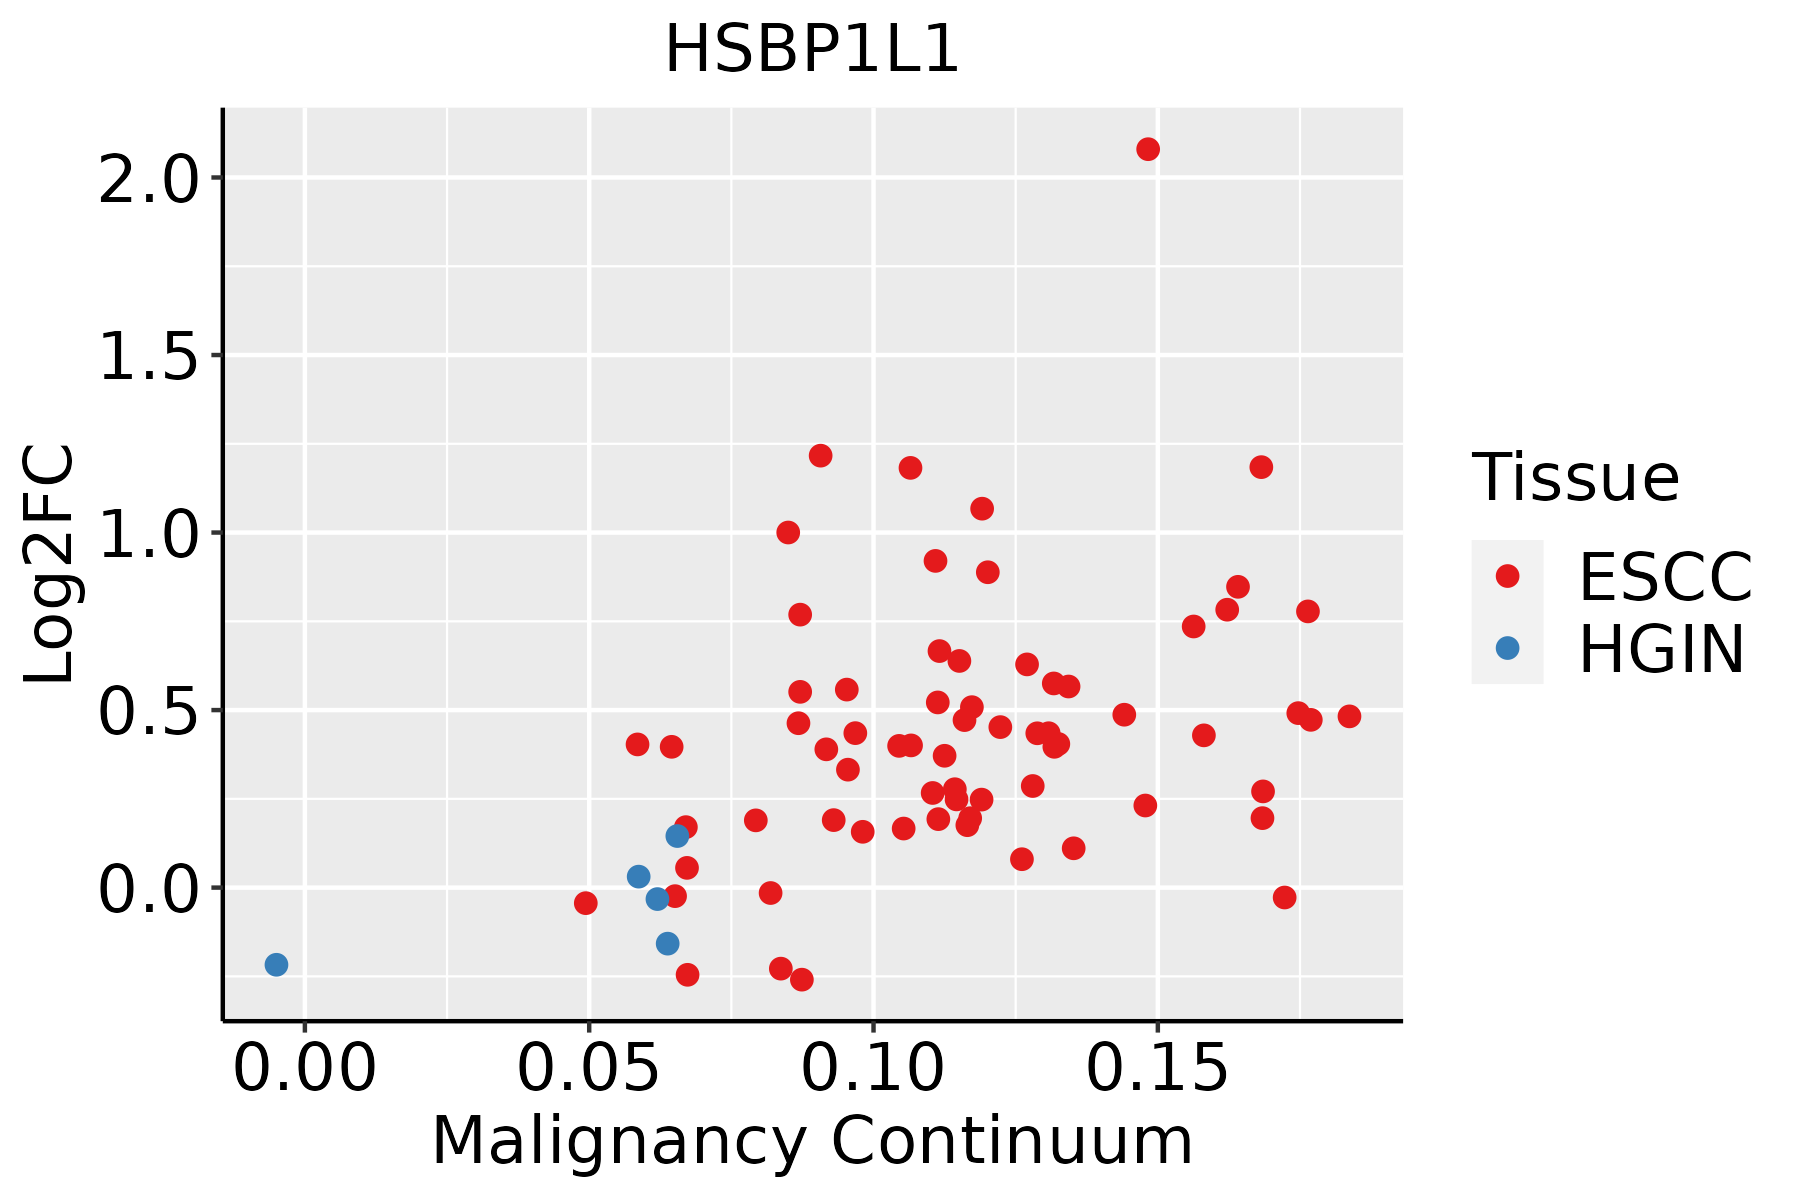 | ESCC: Esophageal squamous cell carcinoma |
| HGIN: High-grade intraepithelial neoplasias | ||
| LGIN: Low-grade intraepithelial neoplasias | ||
| Liver | 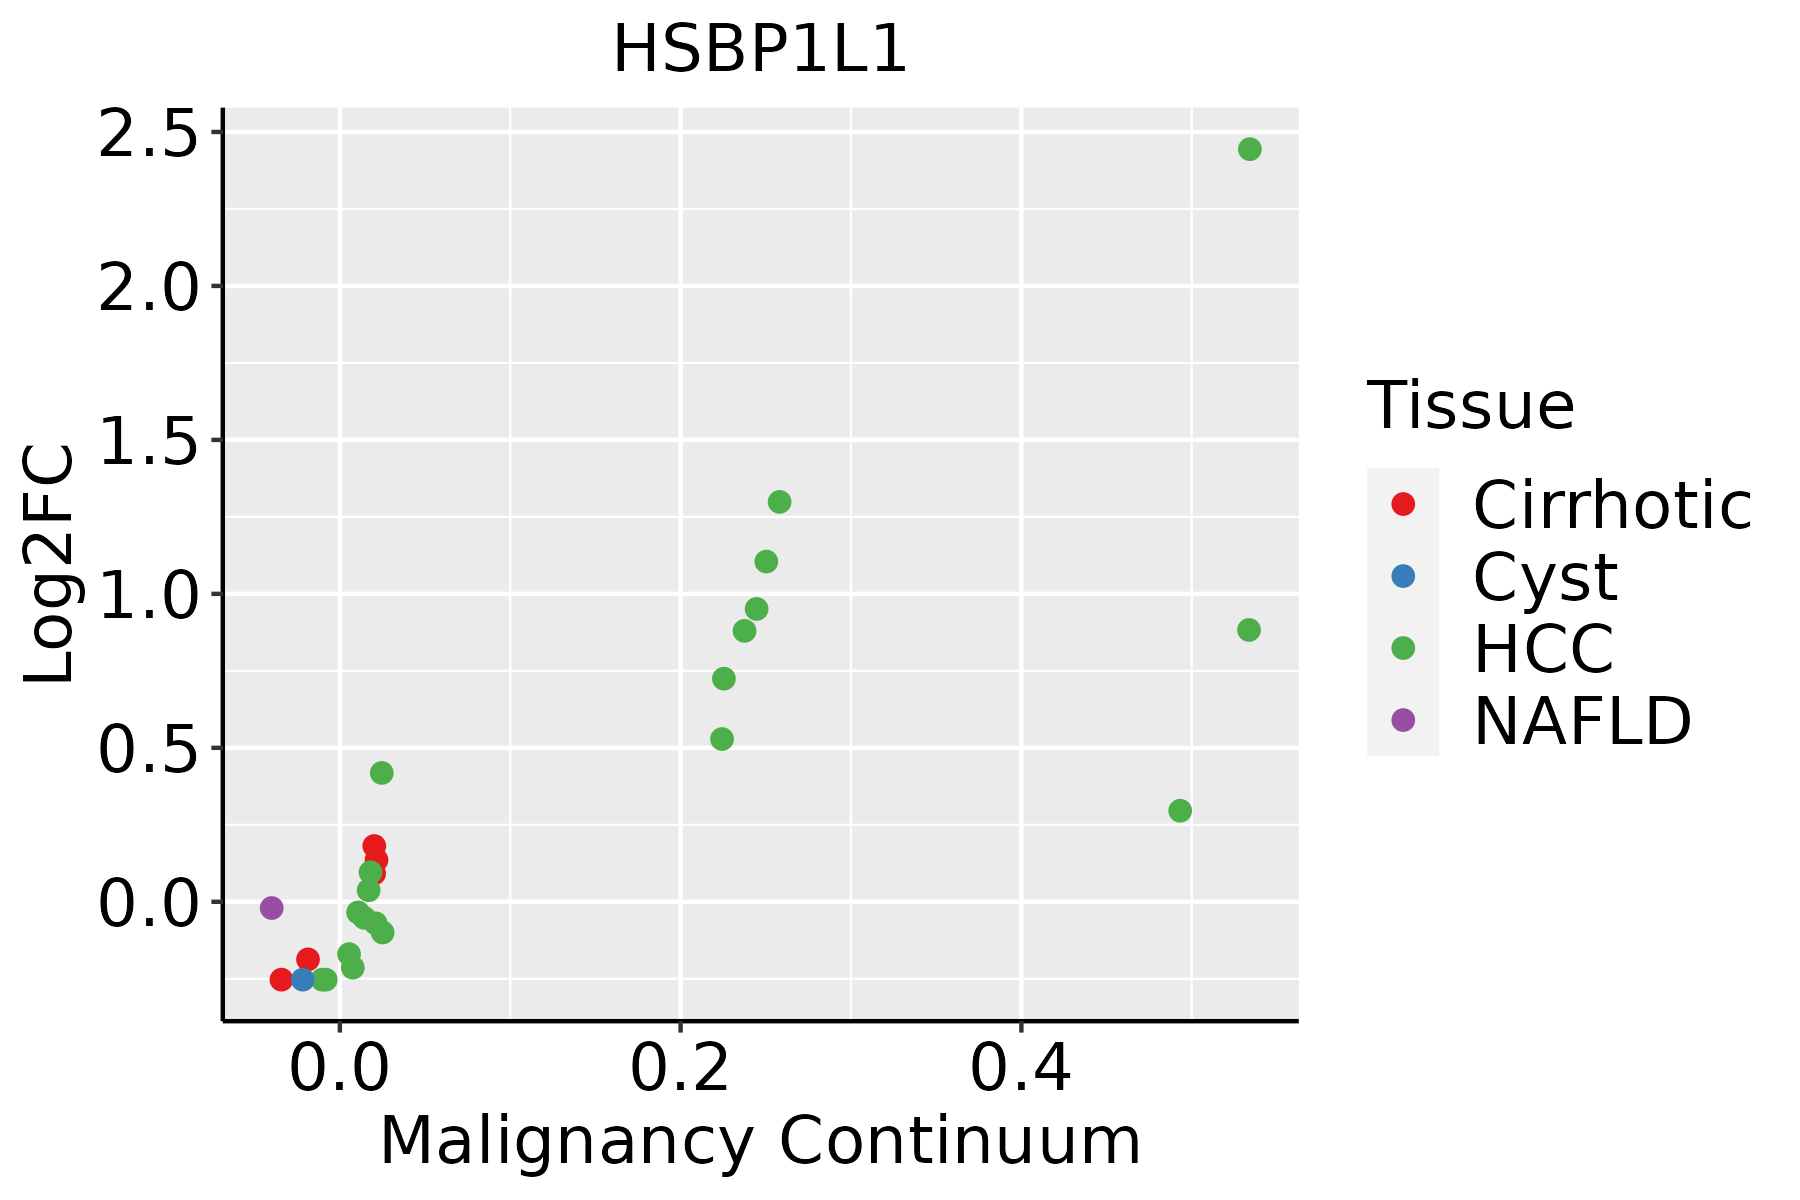 | HCC: Hepatocellular carcinoma |
| NAFLD: Non-alcoholic fatty liver disease | ||
| Oral Cavity | 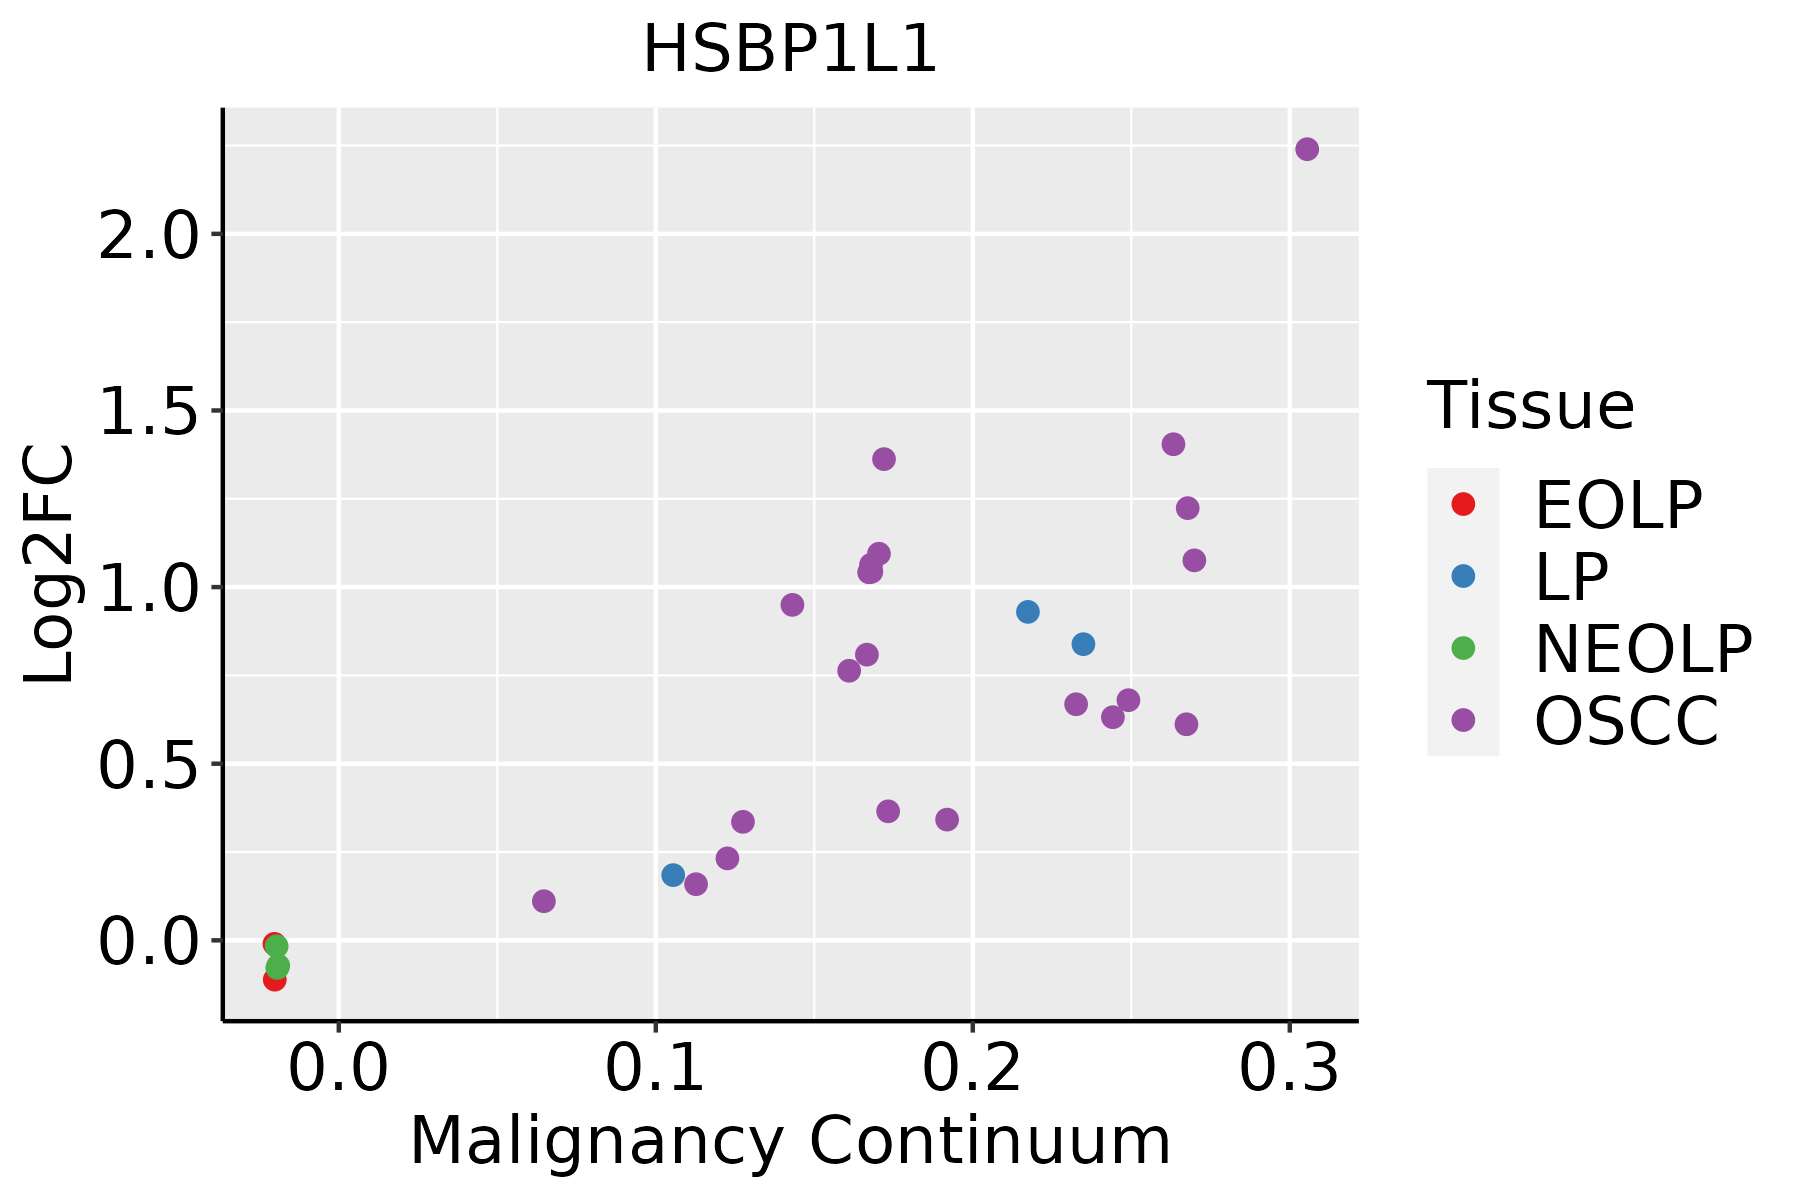 | EOLP: Erosive Oral lichen planus |
| LP: leukoplakia | ||
| NEOLP: Non-erosive oral lichen planus | ||
| OSCC: Oral squamous cell carcinoma | ||
| Skin |  | AK: Actinic keratosis |
| cSCC: Cutaneous squamous cell carcinoma | ||
| SCCIS:squamous cell carcinoma in situ | ||
| Thyroid |  | ATC: Anaplastic thyroid cancer |
| HT: Hashimoto's thyroiditis | ||
| PTC: Papillary thyroid cancer |
| ∗log2FC in expression of this searched gene in stem-like cells from each diseased tissue sample relative to stem-like cells in normal samples in each tissue plotted against the malignancy continuum. Samples are colored based on if they are from different disease stage. |
Top |
Malignant transformation related pathway analysis |
| Find out the enriched GO biological processes and KEGG pathways involved in transition from healthy to precancer to cancer |
| Tissue | Disease Stage | Enriched GO biological Processes |
| Colorectum | AD |  |
| Colorectum | SER |  |
| Colorectum | MSS |  |
| Colorectum | MSI-H |  |
| Colorectum | FAP |  |
| ∗Top 15 enriched GO BP terms are showed in the bar plot of each disease state in each tissue. Each row represents a significant GO biological process which is colored according to the -log10(p.adjust). |
| Page: 1 2 3 4 5 6 7 8 9 |
| GO ID | Tissue | Disease Stage | Description | Gene Ratio | Bg Ratio | pvalue | p.adjust | Count |
| GO:0034605 | Colorectum | AD | cellular response to heat | 24/3918 | 69/18723 | 5.35e-03 | 3.52e-02 | 24 |
| GO:003460520 | Esophagus | HGIN | cellular response to heat | 30/2587 | 69/18723 | 1.78e-09 | 1.35e-07 | 30 |
| GO:000940819 | Esophagus | HGIN | response to heat | 34/2587 | 110/18723 | 2.94e-06 | 1.01e-04 | 34 |
| GO:000926618 | Esophagus | HGIN | response to temperature stimulus | 42/2587 | 178/18723 | 2.91e-04 | 4.98e-03 | 42 |
| GO:0009408110 | Esophagus | ESCC | response to heat | 77/8552 | 110/18723 | 2.01e-07 | 3.11e-06 | 77 |
| GO:0034605111 | Esophagus | ESCC | cellular response to heat | 52/8552 | 69/18723 | 4.87e-07 | 6.53e-06 | 52 |
| GO:000926619 | Esophagus | ESCC | response to temperature stimulus | 106/8552 | 178/18723 | 1.30e-04 | 8.84e-04 | 106 |
| GO:00346057 | Liver | Cirrhotic | cellular response to heat | 35/4634 | 69/18723 | 2.90e-06 | 5.16e-05 | 35 |
| GO:00094087 | Liver | Cirrhotic | response to heat | 49/4634 | 110/18723 | 4.47e-06 | 7.42e-05 | 49 |
| GO:00092666 | Liver | Cirrhotic | response to temperature stimulus | 63/4634 | 178/18723 | 9.38e-04 | 6.66e-03 | 63 |
| GO:003460512 | Liver | HCC | cellular response to heat | 53/7958 | 69/18723 | 6.62e-09 | 1.70e-07 | 53 |
| GO:000940811 | Liver | HCC | response to heat | 76/7958 | 110/18723 | 1.48e-08 | 3.58e-07 | 76 |
| GO:000926611 | Liver | HCC | response to temperature stimulus | 101/7958 | 178/18723 | 8.55e-05 | 7.48e-04 | 101 |
| GO:003460519 | Oral cavity | OSCC | cellular response to heat | 51/7305 | 69/18723 | 4.00e-09 | 8.95e-08 | 51 |
| GO:000940817 | Oral cavity | OSCC | response to heat | 73/7305 | 110/18723 | 5.56e-09 | 1.21e-07 | 73 |
| GO:000926616 | Oral cavity | OSCC | response to temperature stimulus | 98/7305 | 178/18723 | 9.78e-06 | 1.03e-04 | 98 |
| GO:0034605110 | Oral cavity | LP | cellular response to heat | 37/4623 | 69/18723 | 2.35e-07 | 7.03e-06 | 37 |
| GO:000940818 | Oral cavity | LP | response to heat | 47/4623 | 110/18723 | 2.48e-05 | 4.00e-04 | 47 |
| GO:000926617 | Oral cavity | LP | response to temperature stimulus | 65/4623 | 178/18723 | 2.78e-04 | 2.88e-03 | 65 |
| GO:0009408111 | Skin | cSCC | response to heat | 54/4864 | 110/18723 | 1.61e-07 | 3.62e-06 | 54 |
| Page: 1 2 |
| Pathway ID | Tissue | Disease Stage | Description | Gene Ratio | Bg Ratio | pvalue | p.adjust | qvalue | Count |
| Page: 1 |
Top |
Cell-cell communication analysis |
| Identification of potential cell-cell interactions between two cell types and their ligand-receptor pairs for different disease states |
| Ligand | Receptor | LRpair | Pathway | Tissue | Disease Stage |
| Page: 1 |
Top |
Single-cell gene regulatory network inference analysis |
| Find out the significant the regulons (TFs) and the target genes of each regulon across cell types for different disease states |
| TF | Cell Type | Tissue | Disease Stage | Target Gene | RSS | Regulon Activity |
| ∗The dot plots of a searched regulon are shown for all cell subpopulations in each disease state of each tissue based on the regulon specific score inferred using pySCENIC and by calculating the average expression. |
| Page: 1 |
Top |
Somatic mutation of malignant transformation related genes |
| Annotation of somatic variants for genes involved in malignant transformation |
| Hugo Symbol | Variant Class | Variant Classification | dbSNP RS | HGVSc | HGVSp | HGVSp Short | SWISSPROT | BIOTYPE | SIFT | PolyPhen | Tumor Sample Barcode | Tissue | Histology | Sex | Age | Stage | Therapy Types | Drugs | Outcome |
| HSBP1L1 | SNV | Missense_Mutation | c.88N>G | p.Gln30Glu | p.Q30E | C9JCN9 | protein_coding | tolerated(0.09) | probably_damaging(0.989) | TCGA-E2-A15S-01 | Breast | breast invasive carcinoma | Female | <65 | I/II | Chemotherapy | doxorubicin | SD | |
| HSBP1L1 | SNV | Missense_Mutation | rs143104176 | c.137N>A | p.Arg46His | p.R46H | C9JCN9 | protein_coding | tolerated(0.05) | benign(0.026) | TCGA-2W-A8YY-01 | Cervix | cervical & endocervical cancer | Female | <65 | I/II | Chemotherapy | cisplatin | CR |
| HSBP1L1 | SNV | Missense_Mutation | novel | c.210N>C | p.Gln70His | p.Q70H | C9JCN9 | protein_coding | tolerated(0.07) | benign(0) | TCGA-AZ-4315-01 | Colorectum | colon adenocarcinoma | Male | <65 | I/II | Unknown | Unknown | SD |
| HSBP1L1 | SNV | Missense_Mutation | c.179N>G | p.Gln60Arg | p.Q60R | C9JCN9 | protein_coding | deleterious(0.01) | possibly_damaging(0.456) | TCGA-CM-5861-01 | Colorectum | colon adenocarcinoma | Female | <65 | I/II | Unknown | Unknown | PD | |
| HSBP1L1 | SNV | Missense_Mutation | rs757201263 | c.136N>T | p.Arg46Cys | p.R46C | C9JCN9 | protein_coding | deleterious(0.02) | possibly_damaging(0.871) | TCGA-EI-6917-01 | Colorectum | rectum adenocarcinoma | Male | <65 | III/IV | Chemotherapy | 5fluorouracil+oxaciplatina+l-folinian | SD |
| HSBP1L1 | SNV | Missense_Mutation | novel | c.144N>T | p.Glu48Asp | p.E48D | C9JCN9 | protein_coding | tolerated(1) | benign(0.001) | TCGA-A5-A1OF-01 | Endometrium | uterine corpus endometrioid carcinoma | Female | <65 | I/II | Unknown | Unknown | SD |
| HSBP1L1 | SNV | Missense_Mutation | novel | c.61C>A | p.Leu21Ile | p.L21I | C9JCN9 | protein_coding | deleterious(0.04) | possibly_damaging(0.624) | TCGA-AJ-A3EL-01 | Endometrium | uterine corpus endometrioid carcinoma | Female | <65 | I/II | Unknown | Unknown | SD |
| HSBP1L1 | SNV | Missense_Mutation | c.153N>T | p.Gln51His | p.Q51H | C9JCN9 | protein_coding | deleterious(0) | probably_damaging(0.937) | TCGA-BS-A0UF-01 | Endometrium | uterine corpus endometrioid carcinoma | Female | >=65 | I/II | Unknown | Unknown | SD |
| Page: 1 |
Top |
Related drugs of malignant transformation related genes |
| Identification of chemicals and drugs interact with genes involved in malignant transfromation |
| (DGIdb 4.0) |
| Entrez ID | Symbol | Category | Interaction Types | Drug Claim Name | Drug Name | PMIDs |
| Page: 1 |

Copyright 2023-Present -The University of Texas Health Science Center at Houston |