
|
|||||
|
 | |
| |
| |
| |
| |
| |
|
Gene: HSBP1 |
Gene summary for HSBP1 |
| Gene information | Species | Human | Gene symbol | HSBP1 | Gene ID | 3281 |
| Gene name | heat shock factor binding protein 1 | |
| Gene Alias | NPC-A-13 | |
| Cytomap | 16q23.3 | |
| Gene Type | protein-coding | GO ID | GO:0000122 | UniProtAcc | O75506 |
Top |
Malignant transformation analysis |
| Identification of the aberrant gene expression in precancerous and cancerous lesions by comparing the gene expression of stem-like cells in diseased tissues with normal stem cells |
| Entrez ID | Symbol | Replicates | Species | Organ | Tissue | Adj P-value | Log2FC | Malignancy |
| 3281 | HSBP1 | CA_HPV_1 | Human | Cervix | CC | 3.49e-10 | -1.59e-01 | 0.0264 |
| 3281 | HSBP1 | CCI_1 | Human | Cervix | CC | 4.02e-10 | -6.80e-01 | 0.528 |
| 3281 | HSBP1 | CCI_3 | Human | Cervix | CC | 4.12e-10 | -6.23e-01 | 0.516 |
| 3281 | HSBP1 | CCII_1 | Human | Cervix | CC | 1.72e-16 | -6.55e-01 | 0.3249 |
| 3281 | HSBP1 | Tumor | Human | Cervix | CC | 1.56e-04 | 3.30e-01 | 0.1241 |
| 3281 | HSBP1 | sample3 | Human | Cervix | CC | 3.36e-07 | 3.04e-01 | 0.1387 |
| 3281 | HSBP1 | L1 | Human | Cervix | CC | 2.74e-04 | -3.45e-02 | 0.0802 |
| 3281 | HSBP1 | T3 | Human | Cervix | CC | 5.86e-08 | 3.39e-01 | 0.1389 |
| 3281 | HSBP1 | HTA11_3410_2000001011 | Human | Colorectum | AD | 7.00e-09 | 2.22e-01 | 0.0155 |
| 3281 | HSBP1 | HTA11_2487_2000001011 | Human | Colorectum | SER | 1.51e-18 | 5.79e-01 | -0.1808 |
| 3281 | HSBP1 | HTA11_1938_2000001011 | Human | Colorectum | AD | 1.34e-15 | 5.32e-01 | -0.0811 |
| 3281 | HSBP1 | HTA11_78_2000001011 | Human | Colorectum | AD | 5.42e-05 | 2.43e-01 | -0.1088 |
| 3281 | HSBP1 | HTA11_347_2000001011 | Human | Colorectum | AD | 2.90e-25 | 5.86e-01 | -0.1954 |
| 3281 | HSBP1 | HTA11_411_2000001011 | Human | Colorectum | SER | 2.79e-10 | 9.25e-01 | -0.2602 |
| 3281 | HSBP1 | HTA11_3361_2000001011 | Human | Colorectum | AD | 1.17e-08 | 4.27e-01 | -0.1207 |
| 3281 | HSBP1 | HTA11_83_2000001011 | Human | Colorectum | SER | 5.03e-09 | 3.44e-01 | -0.1526 |
| 3281 | HSBP1 | HTA11_696_2000001011 | Human | Colorectum | AD | 3.13e-15 | 4.85e-01 | -0.1464 |
| 3281 | HSBP1 | HTA11_866_2000001011 | Human | Colorectum | AD | 3.87e-10 | 3.16e-01 | -0.1001 |
| 3281 | HSBP1 | HTA11_1391_2000001011 | Human | Colorectum | AD | 6.60e-26 | 6.92e-01 | -0.059 |
| 3281 | HSBP1 | HTA11_2992_2000001011 | Human | Colorectum | SER | 2.31e-05 | 5.66e-01 | -0.1706 |
| Page: 1 2 3 4 5 6 7 8 9 10 11 12 |
| Tissue | Expression Dynamics | Abbreviation |
| Cervix |  | CC: Cervix cancer |
| HSIL_HPV: HPV-infected high-grade squamous intraepithelial lesions | ||
| N_HPV: HPV-infected normal cervix | ||
| Colorectum (GSE201348) |  | FAP: Familial adenomatous polyposis |
| CRC: Colorectal cancer | ||
| Colorectum (HTA11) |  | AD: Adenomas |
| SER: Sessile serrated lesions | ||
| MSI-H: Microsatellite-high colorectal cancer | ||
| MSS: Microsatellite stable colorectal cancer | ||
| Endometrium | 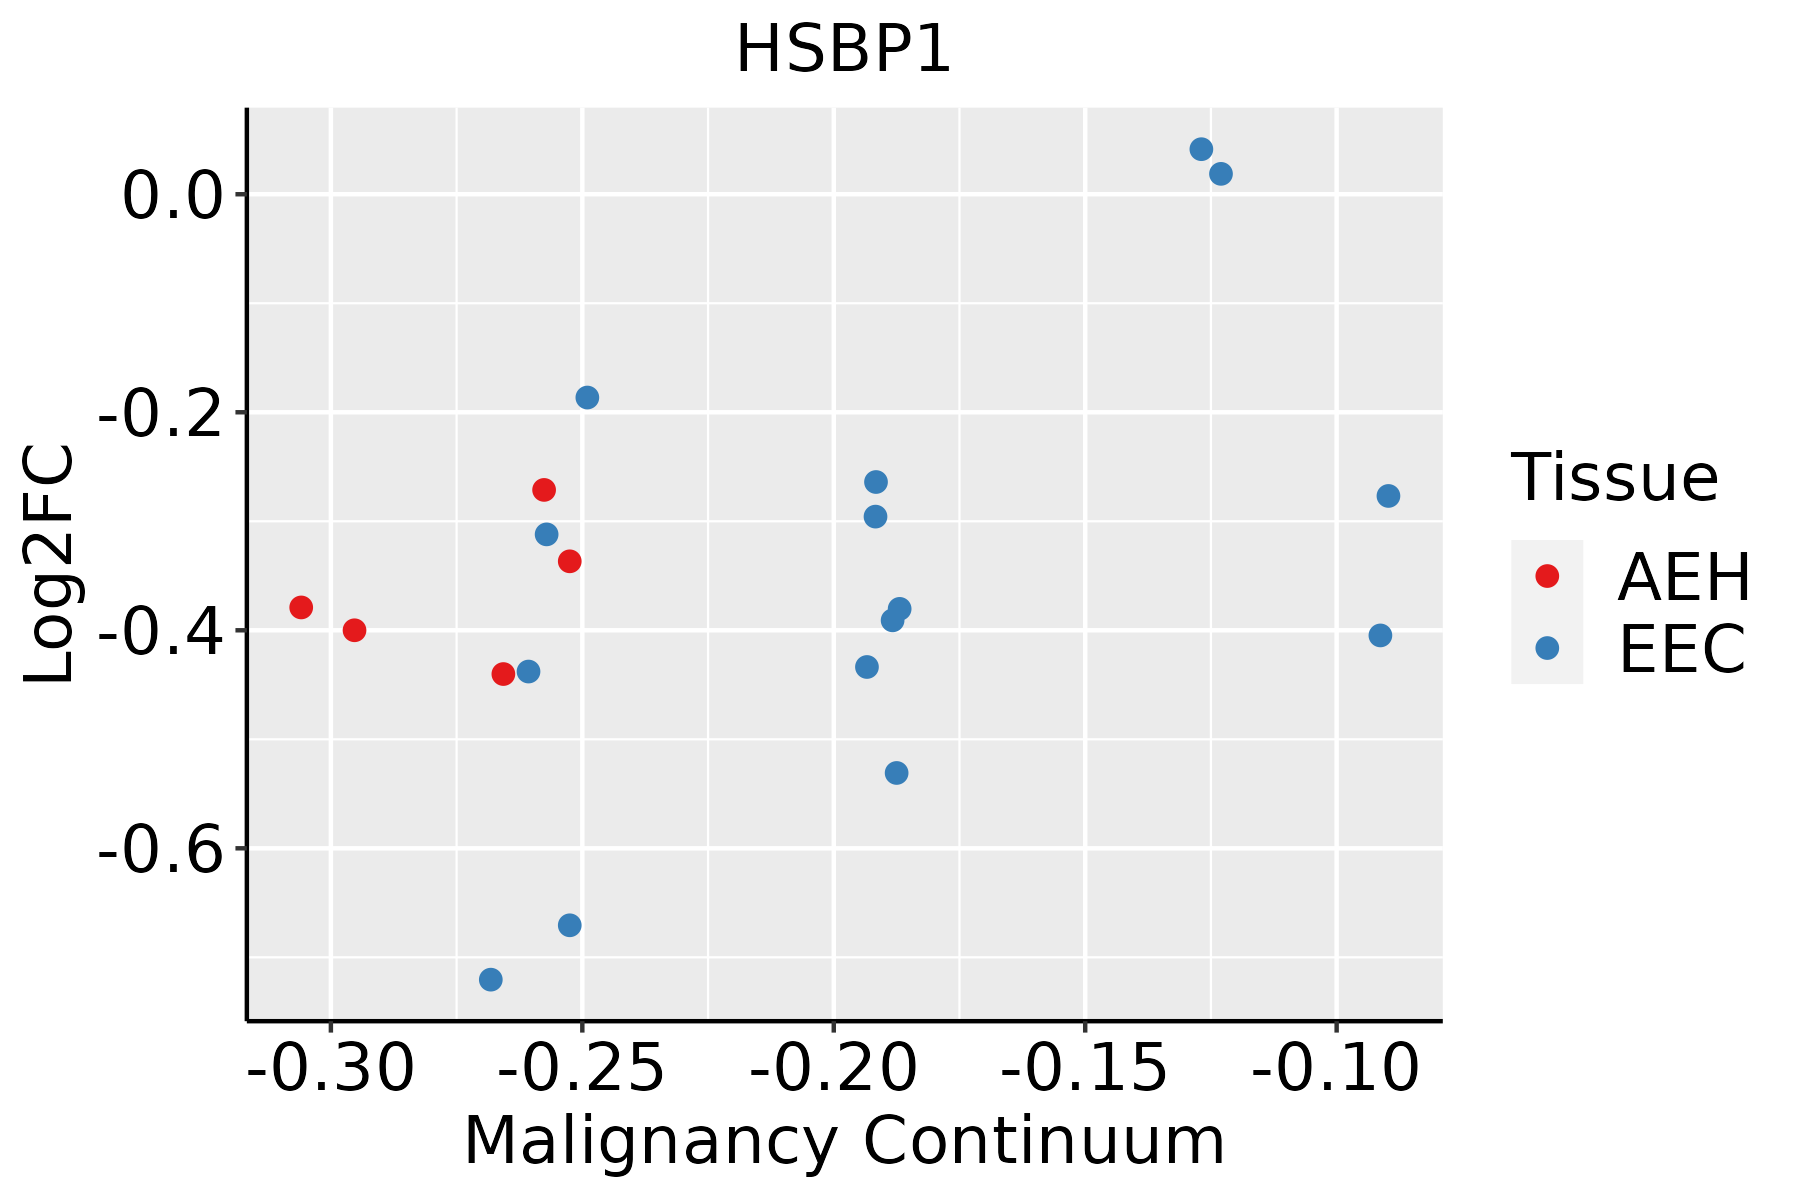 | AEH: Atypical endometrial hyperplasia |
| EEC: Endometrioid Cancer | ||
| Esophagus | 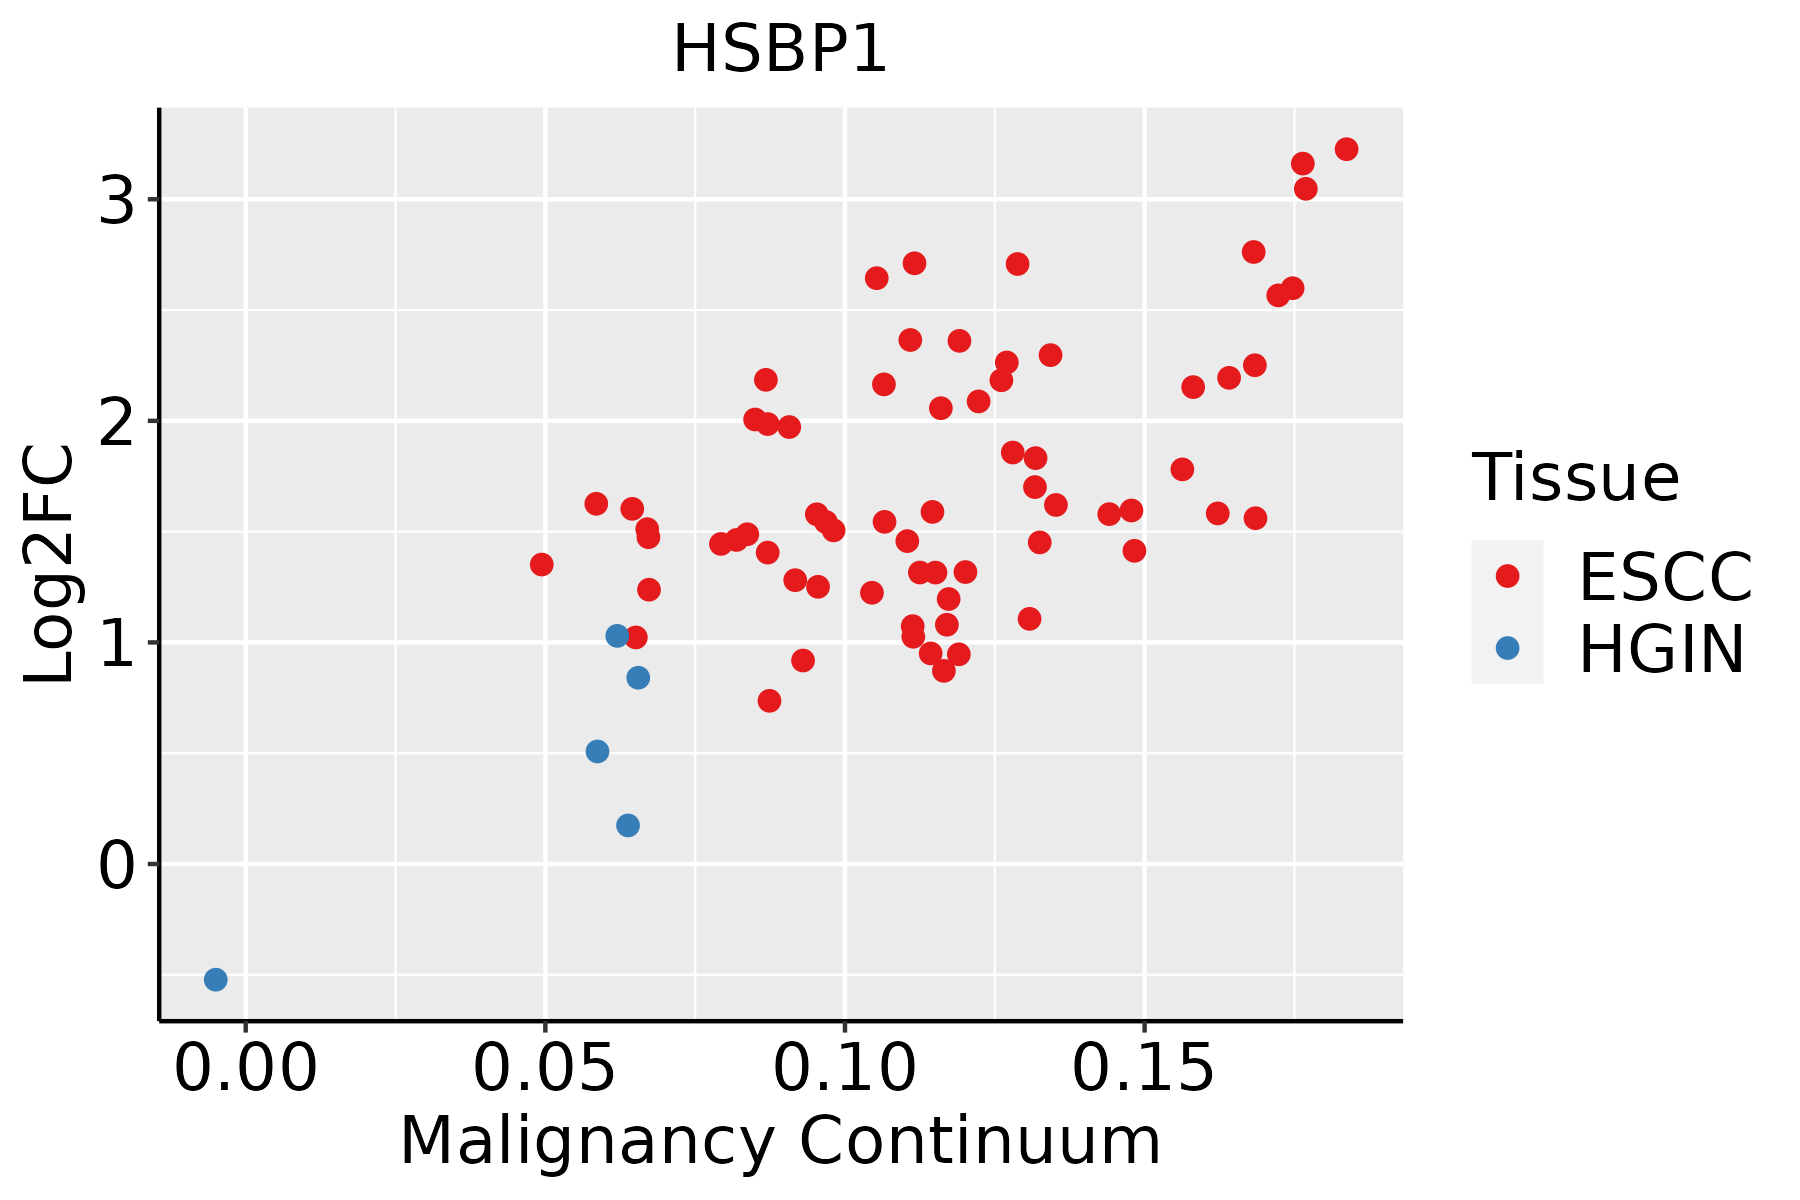 | ESCC: Esophageal squamous cell carcinoma |
| HGIN: High-grade intraepithelial neoplasias | ||
| LGIN: Low-grade intraepithelial neoplasias | ||
| Liver | 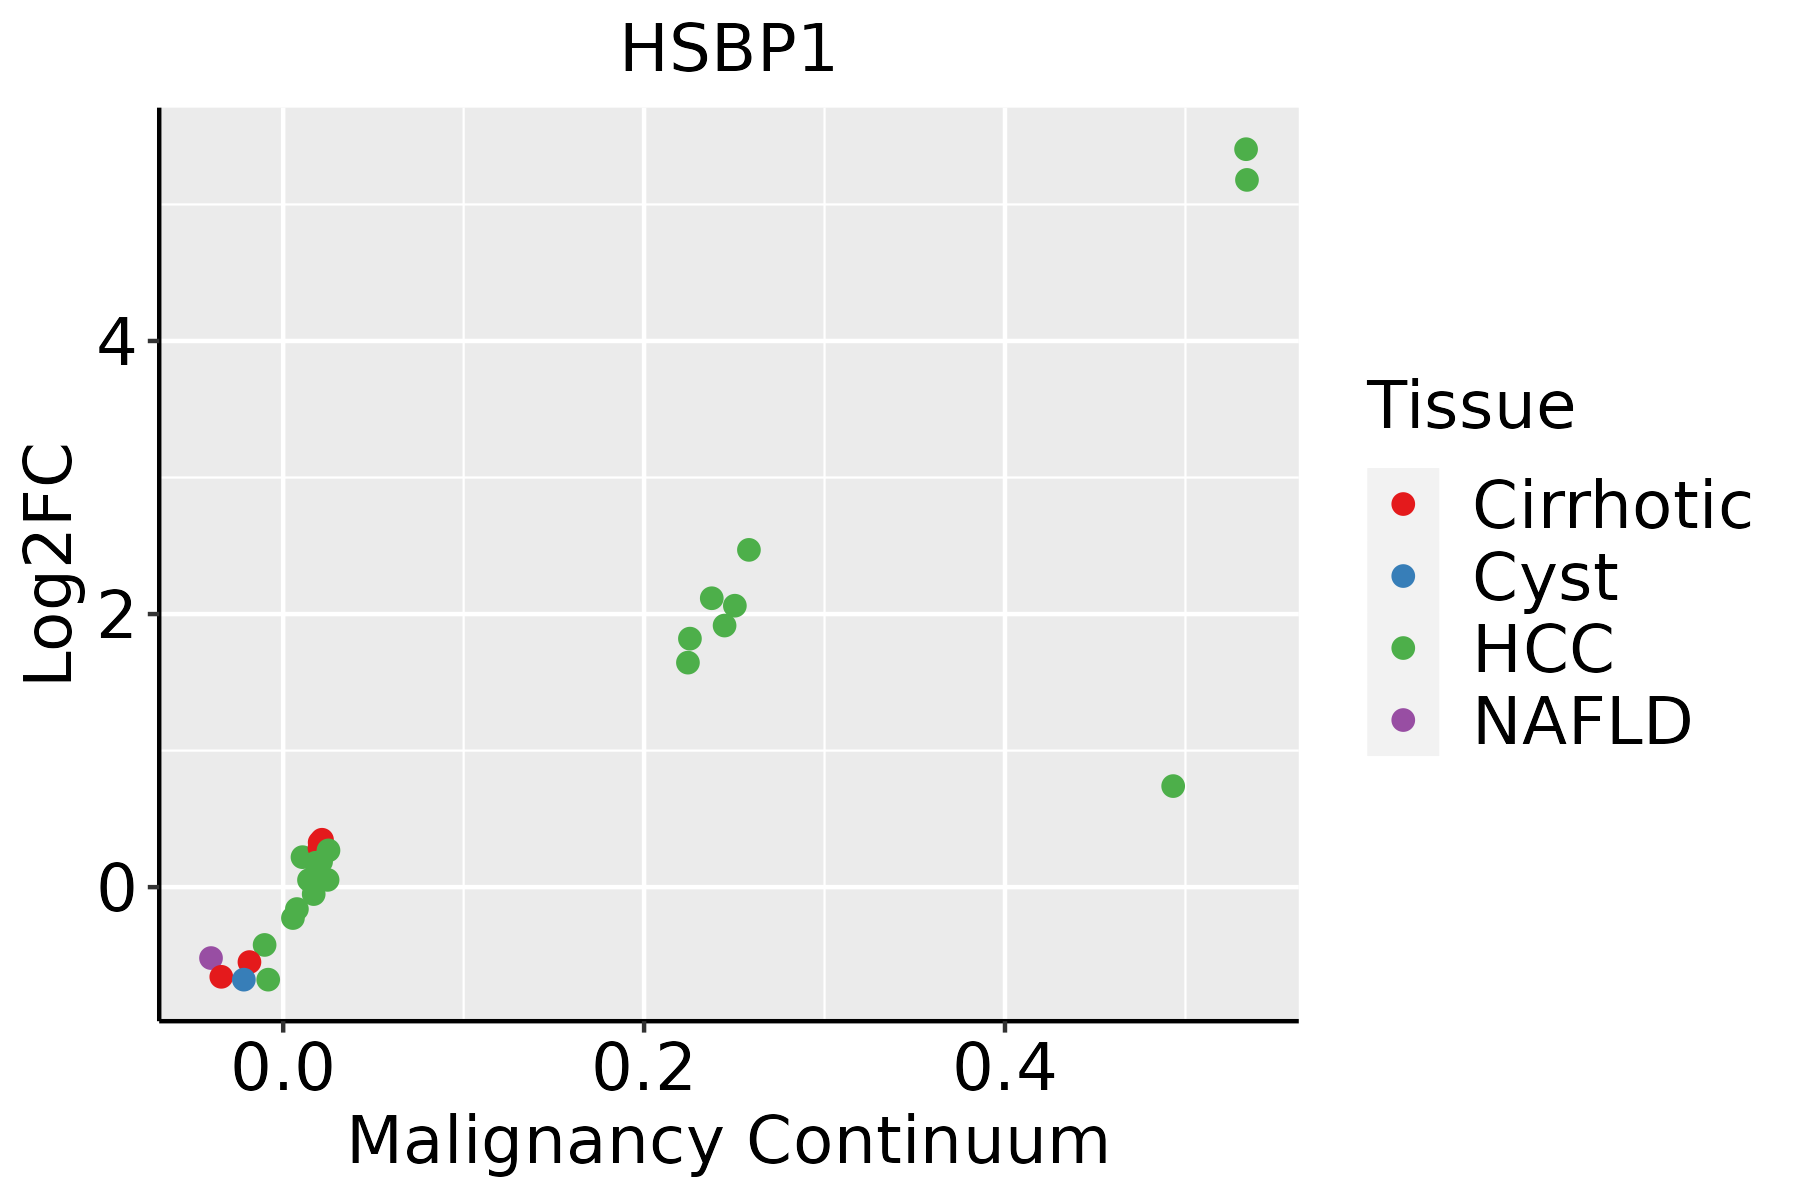 | HCC: Hepatocellular carcinoma |
| NAFLD: Non-alcoholic fatty liver disease | ||
| Oral Cavity |  | EOLP: Erosive Oral lichen planus |
| LP: leukoplakia | ||
| NEOLP: Non-erosive oral lichen planus | ||
| OSCC: Oral squamous cell carcinoma | ||
| Prostate |  | BPH: Benign Prostatic Hyperplasia |
| Skin | 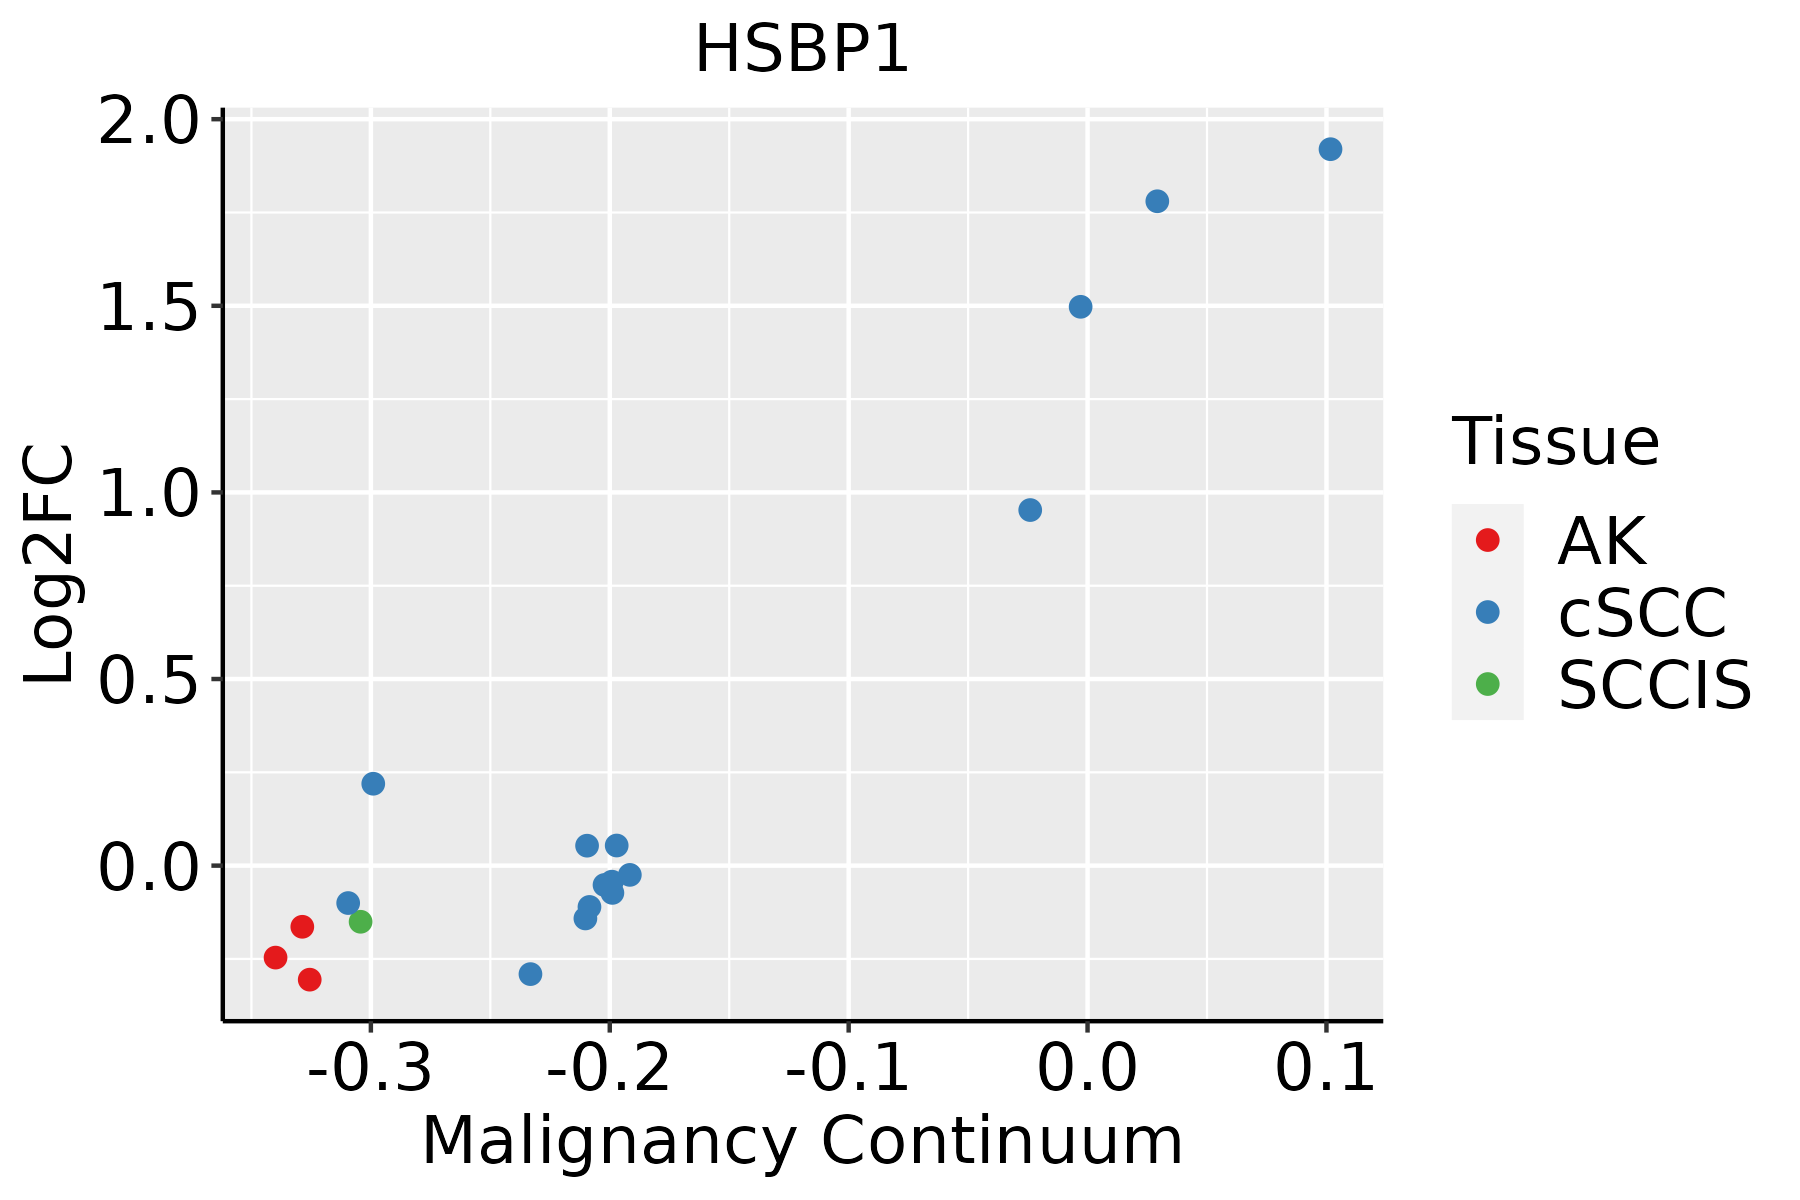 | AK: Actinic keratosis |
| cSCC: Cutaneous squamous cell carcinoma | ||
| SCCIS:squamous cell carcinoma in situ | ||
| Thyroid | 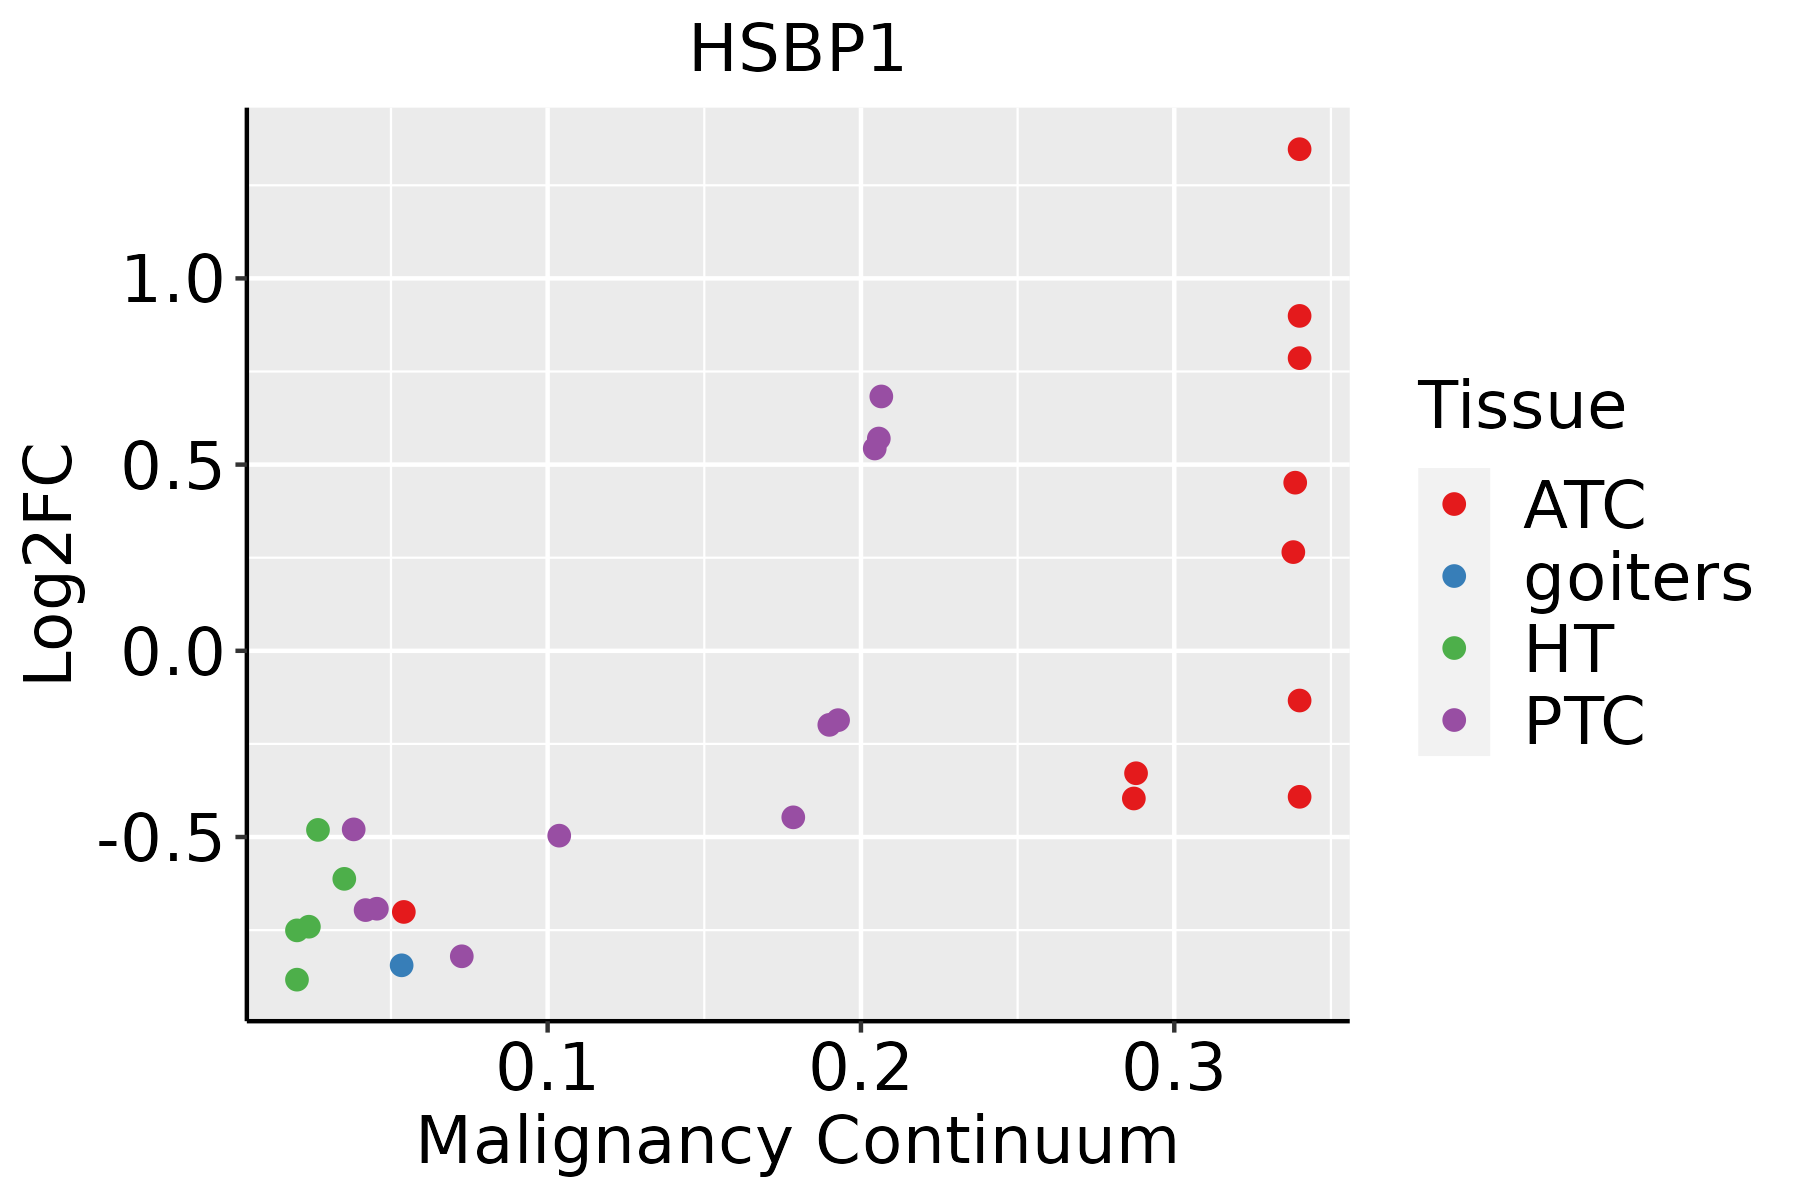 | ATC: Anaplastic thyroid cancer |
| HT: Hashimoto's thyroiditis | ||
| PTC: Papillary thyroid cancer |
| ∗log2FC in expression of this searched gene in stem-like cells from each diseased tissue sample relative to stem-like cells in normal samples in each tissue plotted against the malignancy continuum. Samples are colored based on if they are from different disease stage. |
Top |
Malignant transformation related pathway analysis |
| Find out the enriched GO biological processes and KEGG pathways involved in transition from healthy to precancer to cancer |
| Tissue | Disease Stage | Enriched GO biological Processes |
| Colorectum | AD |  |
| Colorectum | SER |  |
| Colorectum | MSS |  |
| Colorectum | MSI-H |  |
| Colorectum | FAP |  |
| ∗Top 15 enriched GO BP terms are showed in the bar plot of each disease state in each tissue. Each row represents a significant GO biological process which is colored according to the -log10(p.adjust). |
| Page: 1 2 3 4 5 6 7 8 9 |
| GO ID | Tissue | Disease Stage | Description | Gene Ratio | Bg Ratio | pvalue | p.adjust | Count |
| GO:003460510 | Cervix | CC | cellular response to heat | 22/2311 | 69/18723 | 1.65e-05 | 3.20e-04 | 22 |
| GO:00516567 | Cervix | CC | establishment of organelle localization | 76/2311 | 390/18723 | 3.17e-05 | 5.21e-04 | 76 |
| GO:00073695 | Cervix | CC | gastrulation | 42/2311 | 185/18723 | 5.83e-05 | 8.46e-04 | 42 |
| GO:00094089 | Cervix | CC | response to heat | 27/2311 | 110/18723 | 3.12e-04 | 3.32e-03 | 27 |
| GO:00307057 | Cervix | CC | cytoskeleton-dependent intracellular transport | 40/2311 | 195/18723 | 7.92e-04 | 6.99e-03 | 40 |
| GO:00074923 | Cervix | CC | endoderm development | 20/2311 | 77/18723 | 8.40e-04 | 7.30e-03 | 20 |
| GO:00092668 | Cervix | CC | response to temperature stimulus | 37/2311 | 178/18723 | 9.45e-04 | 7.95e-03 | 37 |
| GO:0001704 | Cervix | CC | formation of primary germ layer | 27/2311 | 121/18723 | 1.49e-03 | 1.16e-02 | 27 |
| GO:00516541 | Cervix | CC | establishment of mitochondrion localization | 10/2311 | 29/18723 | 1.74e-03 | 1.31e-02 | 10 |
| GO:00516461 | Cervix | CC | mitochondrion localization | 13/2311 | 50/18723 | 6.42e-03 | 3.58e-02 | 13 |
| GO:00080886 | Cervix | CC | axo-dendritic transport | 17/2311 | 75/18723 | 8.87e-03 | 4.53e-02 | 17 |
| GO:0051656 | Colorectum | AD | establishment of organelle localization | 131/3918 | 390/18723 | 3.00e-09 | 2.06e-07 | 131 |
| GO:0030705 | Colorectum | AD | cytoskeleton-dependent intracellular transport | 60/3918 | 195/18723 | 7.56e-04 | 7.59e-03 | 60 |
| GO:0034605 | Colorectum | AD | cellular response to heat | 24/3918 | 69/18723 | 5.35e-03 | 3.52e-02 | 24 |
| GO:0072384 | Colorectum | AD | organelle transport along microtubule | 28/3918 | 85/18723 | 6.55e-03 | 4.07e-02 | 28 |
| GO:0007369 | Colorectum | AD | gastrulation | 53/3918 | 185/18723 | 7.60e-03 | 4.60e-02 | 53 |
| GO:00516561 | Colorectum | SER | establishment of organelle localization | 100/2897 | 390/18723 | 1.11e-07 | 6.79e-06 | 100 |
| GO:00346051 | Colorectum | SER | cellular response to heat | 21/2897 | 69/18723 | 1.29e-03 | 1.44e-02 | 21 |
| GO:0003012 | Colorectum | SER | muscle system process | 92/2897 | 452/18723 | 2.98e-03 | 2.63e-02 | 92 |
| GO:00073691 | Colorectum | SER | gastrulation | 43/2897 | 185/18723 | 3.44e-03 | 2.92e-02 | 43 |
| Page: 1 2 3 4 5 6 7 8 9 10 11 12 |
| Pathway ID | Tissue | Disease Stage | Description | Gene Ratio | Bg Ratio | pvalue | p.adjust | qvalue | Count |
| Page: 1 |
Top |
Cell-cell communication analysis |
| Identification of potential cell-cell interactions between two cell types and their ligand-receptor pairs for different disease states |
| Ligand | Receptor | LRpair | Pathway | Tissue | Disease Stage |
| Page: 1 |
Top |
Single-cell gene regulatory network inference analysis |
| Find out the significant the regulons (TFs) and the target genes of each regulon across cell types for different disease states |
| TF | Cell Type | Tissue | Disease Stage | Target Gene | RSS | Regulon Activity |
| ∗The dot plots of a searched regulon are shown for all cell subpopulations in each disease state of each tissue based on the regulon specific score inferred using pySCENIC and by calculating the average expression. |
| Page: 1 |
Top |
Somatic mutation of malignant transformation related genes |
| Annotation of somatic variants for genes involved in malignant transformation |
| Hugo Symbol | Variant Class | Variant Classification | dbSNP RS | HGVSc | HGVSp | HGVSp Short | SWISSPROT | BIOTYPE | SIFT | PolyPhen | Tumor Sample Barcode | Tissue | Histology | Sex | Age | Stage | Therapy Types | Drugs | Outcome |
| HSBP1 | SNV | Missense_Mutation | c.150N>C | p.Lys50Asn | p.K50N | O75506 | protein_coding | deleterious(0.01) | benign(0.394) | TCGA-AC-A23H-01 | Breast | breast invasive carcinoma | Female | >=65 | I/II | Unknown | Unknown | PD | |
| HSBP1 | SNV | Missense_Mutation | c.90N>C | p.Met30Ile | p.M30I | O75506 | protein_coding | tolerated(0.05) | benign(0.069) | TCGA-EK-A3GJ-01 | Cervix | cervical & endocervical cancer | Female | <65 | I/II | Unknown | Unknown | SD | |
| HSBP1 | SNV | Missense_Mutation | rs780323241 | c.130C>T | p.Arg44Cys | p.R44C | O75506 | protein_coding | tolerated(0.09) | benign(0.178) | TCGA-D1-A17Q-01 | Endometrium | uterine corpus endometrioid carcinoma | Female | <65 | I/II | Unknown | Unknown | SD |
| HSBP1 | SNV | Missense_Mutation | novel | c.218N>T | p.Thr73Met | p.T73M | O75506 | protein_coding | deleterious(0.03) | benign(0.387) | TCGA-EO-A3AZ-01 | Endometrium | uterine corpus endometrioid carcinoma | Female | >=65 | I/II | Unknown | Unknown | SD |
| Page: 1 |
Top |
Related drugs of malignant transformation related genes |
| Identification of chemicals and drugs interact with genes involved in malignant transfromation |
| (DGIdb 4.0) |
| Entrez ID | Symbol | Category | Interaction Types | Drug Claim Name | Drug Name | PMIDs |
| Page: 1 |

Copyright 2023-Present -The University of Texas Health Science Center at Houston |