
|
|||||
|
 | |
| |
| |
| |
| |
| |
|
Gene: HS3ST4 |
Gene summary for HS3ST4 |
| Gene information | Species | Human | Gene symbol | HS3ST4 | Gene ID | 9951 |
| Gene name | heparan sulfate-glucosamine 3-sulfotransferase 4 | |
| Gene Alias | 3-OST-4 | |
| Cytomap | 16p12.1 | |
| Gene Type | protein-coding | GO ID | GO:0006029 | UniProtAcc | Q9Y661 |
Top |
Malignant transformation analysis |
| Identification of the aberrant gene expression in precancerous and cancerous lesions by comparing the gene expression of stem-like cells in diseased tissues with normal stem cells |
| Entrez ID | Symbol | Replicates | Species | Organ | Tissue | Adj P-value | Log2FC | Malignancy |
| 9951 | HS3ST4 | CCI_2 | Human | Cervix | CC | 3.08e-11 | 7.71e-01 | 0.5249 |
| 9951 | HS3ST4 | HTA11_3410_2000001011 | Human | Colorectum | AD | 4.75e-11 | 2.70e-01 | 0.0155 |
| 9951 | HS3ST4 | HTA11_2487_2000001011 | Human | Colorectum | SER | 2.77e-16 | 5.74e-01 | -0.1808 |
| 9951 | HS3ST4 | HTA11_2951_2000001011 | Human | Colorectum | AD | 3.19e-07 | 5.01e-01 | 0.0216 |
| 9951 | HS3ST4 | HTA11_1938_2000001011 | Human | Colorectum | AD | 4.81e-22 | 9.11e-01 | -0.0811 |
| 9951 | HS3ST4 | HTA11_78_2000001011 | Human | Colorectum | AD | 9.37e-26 | 7.37e-01 | -0.1088 |
| 9951 | HS3ST4 | HTA11_347_2000001011 | Human | Colorectum | AD | 1.53e-37 | 8.18e-01 | -0.1954 |
| 9951 | HS3ST4 | HTA11_411_2000001011 | Human | Colorectum | SER | 1.39e-15 | 9.86e-01 | -0.2602 |
| 9951 | HS3ST4 | HTA11_2112_2000001011 | Human | Colorectum | SER | 1.05e-04 | 5.71e-01 | -0.2196 |
| 9951 | HS3ST4 | HTA11_3361_2000001011 | Human | Colorectum | AD | 3.70e-15 | 6.58e-01 | -0.1207 |
| 9951 | HS3ST4 | HTA11_83_2000001011 | Human | Colorectum | SER | 8.69e-13 | 5.61e-01 | -0.1526 |
| 9951 | HS3ST4 | HTA11_696_2000001011 | Human | Colorectum | AD | 1.17e-20 | 6.25e-01 | -0.1464 |
| 9951 | HS3ST4 | HTA11_866_2000001011 | Human | Colorectum | AD | 1.30e-11 | 3.98e-01 | -0.1001 |
| 9951 | HS3ST4 | HTA11_1391_2000001011 | Human | Colorectum | AD | 1.20e-28 | 8.43e-01 | -0.059 |
| 9951 | HS3ST4 | HTA11_2992_2000001011 | Human | Colorectum | SER | 4.23e-14 | 7.69e-01 | -0.1706 |
| 9951 | HS3ST4 | HTA11_5212_2000001011 | Human | Colorectum | AD | 6.10e-13 | 6.22e-01 | -0.2061 |
| 9951 | HS3ST4 | HTA11_5216_2000001011 | Human | Colorectum | SER | 4.17e-17 | 6.16e-01 | -0.1462 |
| 9951 | HS3ST4 | HTA11_546_2000001011 | Human | Colorectum | AD | 1.79e-17 | 7.44e-01 | -0.0842 |
| 9951 | HS3ST4 | HTA11_9341_2000001011 | Human | Colorectum | SER | 2.27e-03 | 3.54e-01 | -0.00410000000000005 |
| 9951 | HS3ST4 | HTA11_7862_2000001011 | Human | Colorectum | AD | 6.80e-25 | 9.10e-01 | -0.0179 |
| Page: 1 2 3 |
| Tissue | Expression Dynamics | Abbreviation |
| Cervix | 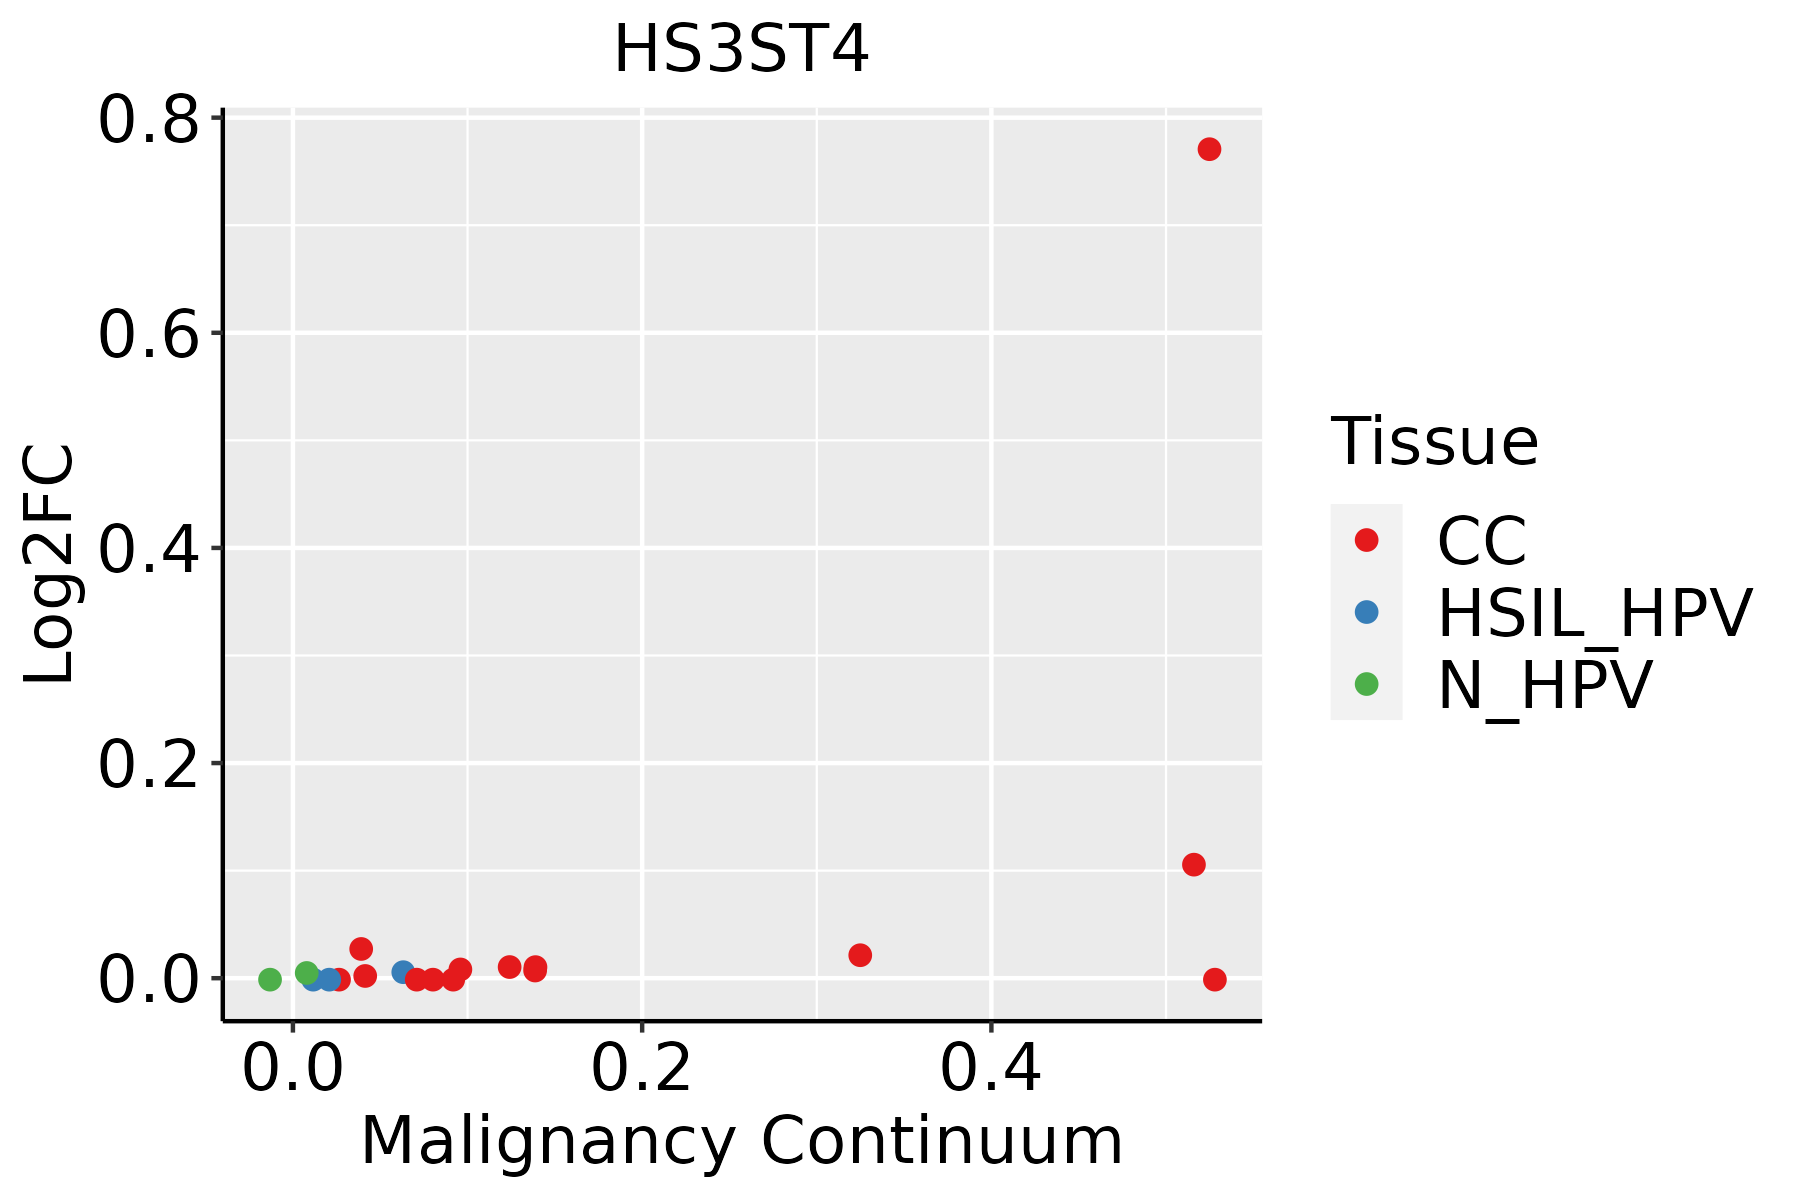 | CC: Cervix cancer |
| HSIL_HPV: HPV-infected high-grade squamous intraepithelial lesions | ||
| N_HPV: HPV-infected normal cervix | ||
| Colorectum (GSE201348) | 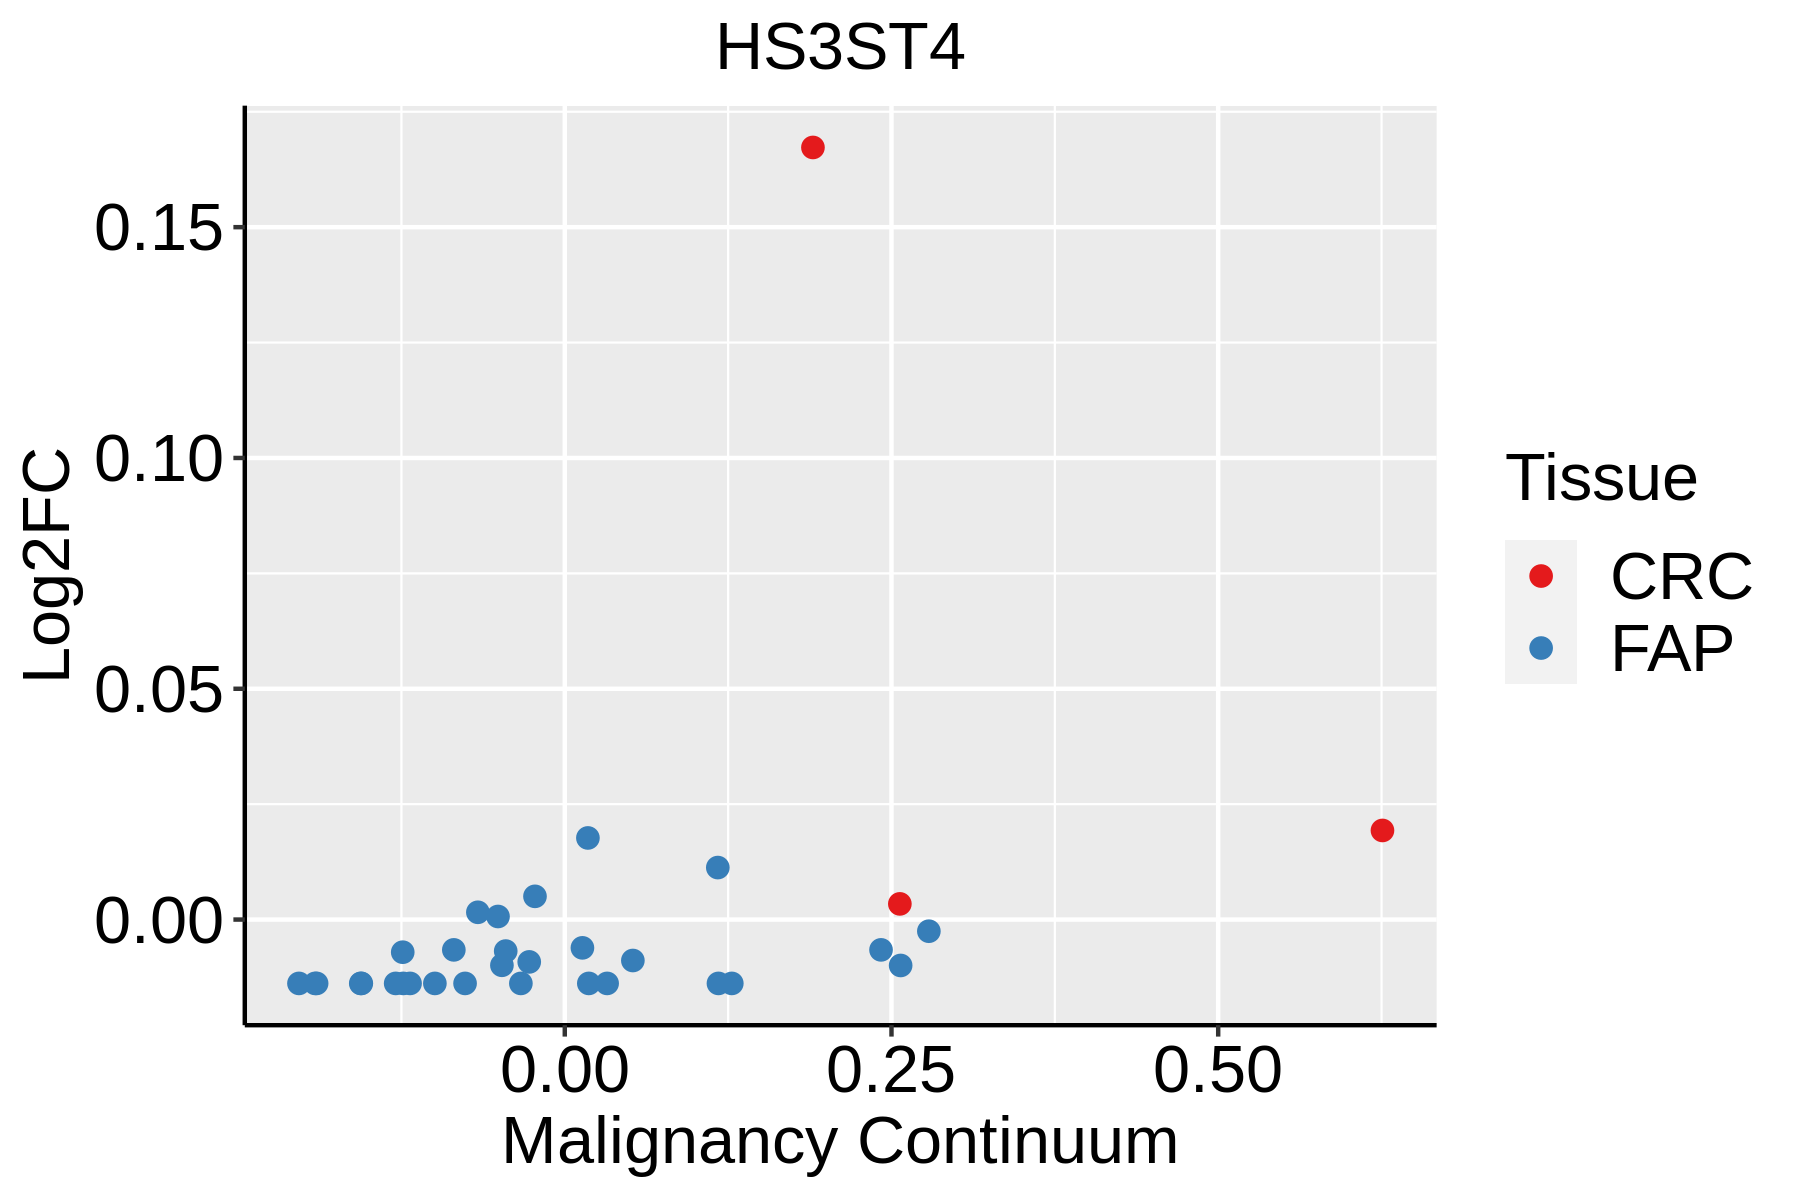 | FAP: Familial adenomatous polyposis |
| CRC: Colorectal cancer | ||
| Colorectum (HTA11) | 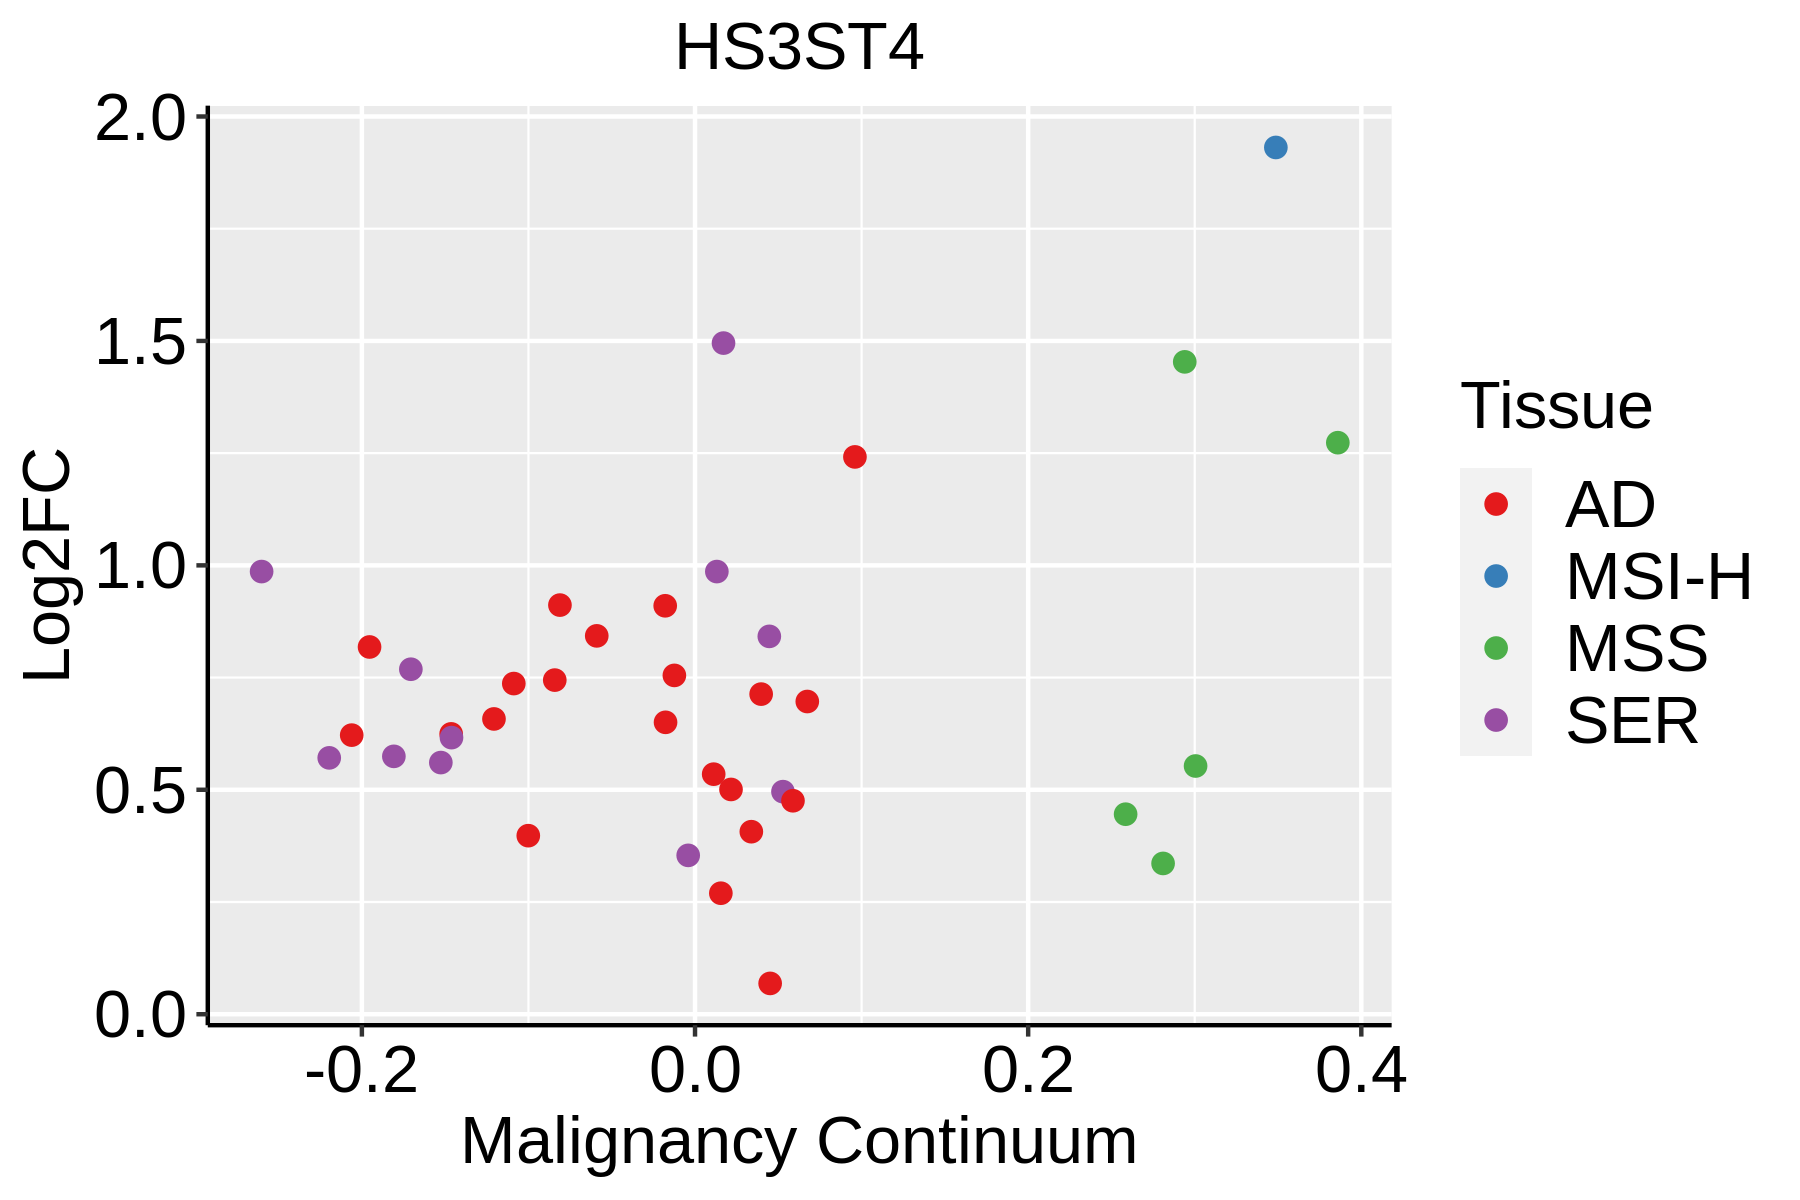 | AD: Adenomas |
| SER: Sessile serrated lesions | ||
| MSI-H: Microsatellite-high colorectal cancer | ||
| MSS: Microsatellite stable colorectal cancer | ||
| Liver | 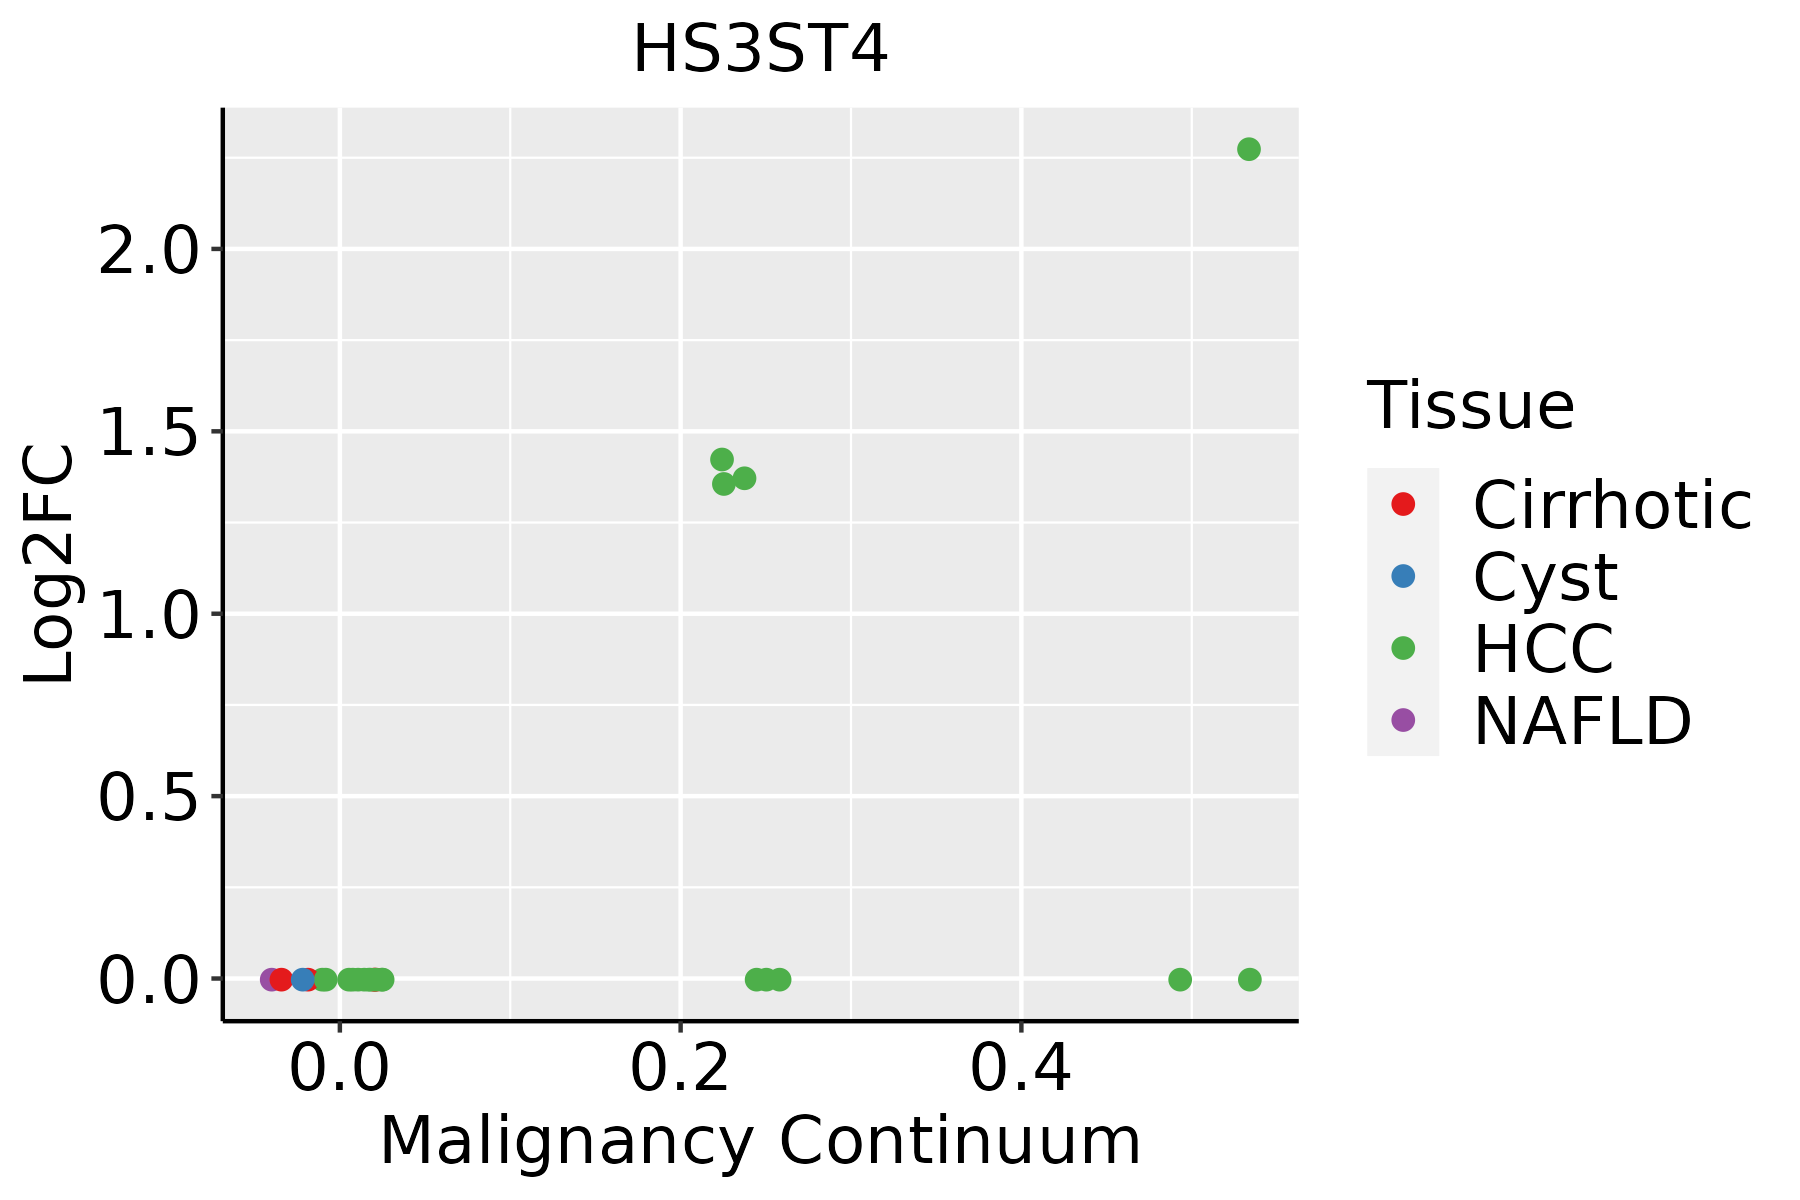 | HCC: Hepatocellular carcinoma |
| NAFLD: Non-alcoholic fatty liver disease | ||
| Thyroid |  | ATC: Anaplastic thyroid cancer |
| HT: Hashimoto's thyroiditis | ||
| PTC: Papillary thyroid cancer |
| ∗log2FC in expression of this searched gene in stem-like cells from each diseased tissue sample relative to stem-like cells in normal samples in each tissue plotted against the malignancy continuum. Samples are colored based on if they are from different disease stage. |
Top |
Malignant transformation related pathway analysis |
| Find out the enriched GO biological processes and KEGG pathways involved in transition from healthy to precancer to cancer |
| Tissue | Disease Stage | Enriched GO biological Processes |
| Colorectum | AD |  |
| Colorectum | SER |  |
| Colorectum | MSS |  |
| Colorectum | MSI-H |  |
| Colorectum | FAP |  |
| ∗Top 15 enriched GO BP terms are showed in the bar plot of each disease state in each tissue. Each row represents a significant GO biological process which is colored according to the -log10(p.adjust). |
| Page: 1 2 3 4 5 6 7 8 9 |
| GO ID | Tissue | Disease Stage | Description | Gene Ratio | Bg Ratio | pvalue | p.adjust | Count |
| GO:0009100 | Liver | HCC | glycoprotein metabolic process | 193/7958 | 387/18723 | 1.89e-03 | 9.62e-03 | 193 |
| GO:00091003 | Thyroid | PTC | glycoprotein metabolic process | 147/5968 | 387/18723 | 5.87e-03 | 2.64e-02 | 147 |
| Page: 1 |
| Pathway ID | Tissue | Disease Stage | Description | Gene Ratio | Bg Ratio | pvalue | p.adjust | qvalue | Count |
| Page: 1 |
Top |
Cell-cell communication analysis |
| Identification of potential cell-cell interactions between two cell types and their ligand-receptor pairs for different disease states |
| Ligand | Receptor | LRpair | Pathway | Tissue | Disease Stage |
| Page: 1 |
Top |
Single-cell gene regulatory network inference analysis |
| Find out the significant the regulons (TFs) and the target genes of each regulon across cell types for different disease states |
| TF | Cell Type | Tissue | Disease Stage | Target Gene | RSS | Regulon Activity |
| ∗The dot plots of a searched regulon are shown for all cell subpopulations in each disease state of each tissue based on the regulon specific score inferred using pySCENIC and by calculating the average expression. |
| Page: 1 |
Top |
Somatic mutation of malignant transformation related genes |
| Annotation of somatic variants for genes involved in malignant transformation |
| Hugo Symbol | Variant Class | Variant Classification | dbSNP RS | HGVSc | HGVSp | HGVSp Short | SWISSPROT | BIOTYPE | SIFT | PolyPhen | Tumor Sample Barcode | Tissue | Histology | Sex | Age | Stage | Therapy Types | Drugs | Outcome |
| HS3ST4 | SNV | Missense_Mutation | c.1072N>A | p.Glu358Lys | p.E358K | Q9Y661 | protein_coding | deleterious(0.01) | probably_damaging(0.998) | TCGA-BH-A1F8-01 | Breast | breast invasive carcinoma | Female | >=65 | III/IV | Unknown | Unknown | PD | |
| HS3ST4 | SNV | Missense_Mutation | novel | c.7N>T | p.Arg3Trp | p.R3W | Q9Y661 | protein_coding | deleterious_low_confidence(0) | benign(0.056) | TCGA-C8-A135-01 | Breast | breast invasive carcinoma | Female | <65 | I/II | Chemotherapy | 5-fluorouracil | CR |
| HS3ST4 | SNV | Missense_Mutation | c.1069G>C | p.Gly357Arg | p.G357R | Q9Y661 | protein_coding | deleterious(0.01) | probably_damaging(1) | TCGA-C8-A1HJ-01 | Breast | breast invasive carcinoma | Female | <65 | I/II | Unknown | Unknown | SD | |
| HS3ST4 | SNV | Missense_Mutation | c.896C>G | p.Thr299Arg | p.T299R | Q9Y661 | protein_coding | deleterious(0) | probably_damaging(1) | TCGA-D8-A1JU-01 | Breast | breast invasive carcinoma | Female | <65 | I/II | Hormone Therapy | tamoxiphen | SD | |
| HS3ST4 | SNV | Missense_Mutation | c.1133A>C | p.Lys378Thr | p.K378T | Q9Y661 | protein_coding | deleterious(0.01) | benign(0.11) | TCGA-E9-A1RE-01 | Breast | breast invasive carcinoma | Female | >=65 | III/IV | Hormone Therapy | tamoxiphen | SD | |
| HS3ST4 | SNV | Missense_Mutation | novel | c.515C>T | p.Ala172Val | p.A172V | Q9Y661 | protein_coding | tolerated_low_confidence(0.12) | benign(0.073) | TCGA-EA-A410-01 | Cervix | cervical & endocervical cancer | Female | <65 | I/II | Unknown | Unknown | SD |
| HS3ST4 | SNV | Missense_Mutation | novel | c.514G>A | p.Ala172Thr | p.A172T | Q9Y661 | protein_coding | tolerated_low_confidence(0.14) | benign(0.011) | TCGA-VS-A94Z-01 | Cervix | cervical & endocervical cancer | Female | <65 | I/II | Chemotherapy | cisplatin | CR |
| HS3ST4 | SNV | Missense_Mutation | c.1147N>C | p.Glu383Gln | p.E383Q | Q9Y661 | protein_coding | tolerated(0.09) | benign(0.372) | TCGA-VS-A958-01 | Cervix | cervical & endocervical cancer | Female | <65 | I/II | Chemotherapy | cisplatin | CR | |
| HS3ST4 | SNV | Missense_Mutation | c.1338T>G | p.Asp446Glu | p.D446E | Q9Y661 | protein_coding | deleterious(0) | benign(0.324) | TCGA-A6-3810-01 | Colorectum | colon adenocarcinoma | Male | <65 | I/II | Unknown | Unknown | SD | |
| HS3ST4 | SNV | Missense_Mutation | rs753467285 | c.1244N>A | p.Arg415Gln | p.R415Q | Q9Y661 | protein_coding | deleterious(0.04) | probably_damaging(0.999) | TCGA-AA-A01R-01 | Colorectum | colon adenocarcinoma | Male | <65 | III/IV | Chemotherapy | 5-fluorouracil | PD |
| Page: 1 2 3 4 5 6 7 8 |
Top |
Related drugs of malignant transformation related genes |
| Identification of chemicals and drugs interact with genes involved in malignant transfromation |
| (DGIdb 4.0) |
| Entrez ID | Symbol | Category | Interaction Types | Drug Claim Name | Drug Name | PMIDs |
| Page: 1 |

Copyright 2023-Present -The University of Texas Health Science Center at Houston |