
|
|||||
|
 | |
| |
| |
| |
| |
| |
|
Gene: HS3ST1 |
Gene summary for HS3ST1 |
| Gene information | Species | Human | Gene symbol | HS3ST1 | Gene ID | 9957 |
| Gene name | heparan sulfate-glucosamine 3-sulfotransferase 1 | |
| Gene Alias | 3OST | |
| Cytomap | 4p15.33 | |
| Gene Type | protein-coding | GO ID | GO:0006022 | UniProtAcc | A0A024R9R4 |
Top |
Malignant transformation analysis |
| Identification of the aberrant gene expression in precancerous and cancerous lesions by comparing the gene expression of stem-like cells in diseased tissues with normal stem cells |
| Entrez ID | Symbol | Replicates | Species | Organ | Tissue | Adj P-value | Log2FC | Malignancy |
| 9957 | HS3ST1 | LZE8T | Human | Esophagus | ESCC | 3.07e-09 | 6.58e-01 | 0.067 |
| 9957 | HS3ST1 | LZE20T | Human | Esophagus | ESCC | 7.32e-05 | 4.63e-01 | 0.0662 |
| 9957 | HS3ST1 | LZE24T | Human | Esophagus | ESCC | 2.66e-05 | 4.10e-01 | 0.0596 |
| 9957 | HS3ST1 | P1T-E | Human | Esophagus | ESCC | 2.79e-06 | 1.15e+00 | 0.0875 |
| 9957 | HS3ST1 | P2T-E | Human | Esophagus | ESCC | 4.16e-07 | 2.80e-01 | 0.1177 |
| 9957 | HS3ST1 | P4T-E | Human | Esophagus | ESCC | 1.85e-07 | 5.67e-02 | 0.1323 |
| 9957 | HS3ST1 | P5T-E | Human | Esophagus | ESCC | 4.34e-04 | 4.07e-02 | 0.1327 |
| 9957 | HS3ST1 | P8T-E | Human | Esophagus | ESCC | 8.80e-56 | 1.85e+00 | 0.0889 |
| 9957 | HS3ST1 | P10T-E | Human | Esophagus | ESCC | 1.23e-13 | 1.69e-01 | 0.116 |
| 9957 | HS3ST1 | P11T-E | Human | Esophagus | ESCC | 3.31e-06 | 4.47e-01 | 0.1426 |
| 9957 | HS3ST1 | P12T-E | Human | Esophagus | ESCC | 3.32e-06 | 1.08e-02 | 0.1122 |
| 9957 | HS3ST1 | P16T-E | Human | Esophagus | ESCC | 1.56e-21 | 5.62e-01 | 0.1153 |
| 9957 | HS3ST1 | P23T-E | Human | Esophagus | ESCC | 2.37e-31 | 1.32e+00 | 0.108 |
| 9957 | HS3ST1 | P26T-E | Human | Esophagus | ESCC | 7.86e-05 | 1.50e-02 | 0.1276 |
| 9957 | HS3ST1 | P27T-E | Human | Esophagus | ESCC | 3.71e-10 | 1.50e-01 | 0.1055 |
| 9957 | HS3ST1 | P30T-E | Human | Esophagus | ESCC | 1.74e-05 | 1.76e-01 | 0.137 |
| 9957 | HS3ST1 | P32T-E | Human | Esophagus | ESCC | 3.79e-04 | 3.57e-02 | 0.1666 |
| 9957 | HS3ST1 | P37T-E | Human | Esophagus | ESCC | 1.98e-13 | 1.34e-01 | 0.1371 |
| 9957 | HS3ST1 | P39T-E | Human | Esophagus | ESCC | 1.84e-09 | 3.24e-01 | 0.0894 |
| 9957 | HS3ST1 | P40T-E | Human | Esophagus | ESCC | 6.52e-03 | 2.01e-02 | 0.109 |
| Page: 1 2 3 |
| Tissue | Expression Dynamics | Abbreviation |
| Esophagus |  | ESCC: Esophageal squamous cell carcinoma |
| HGIN: High-grade intraepithelial neoplasias | ||
| LGIN: Low-grade intraepithelial neoplasias | ||
| Oral Cavity | 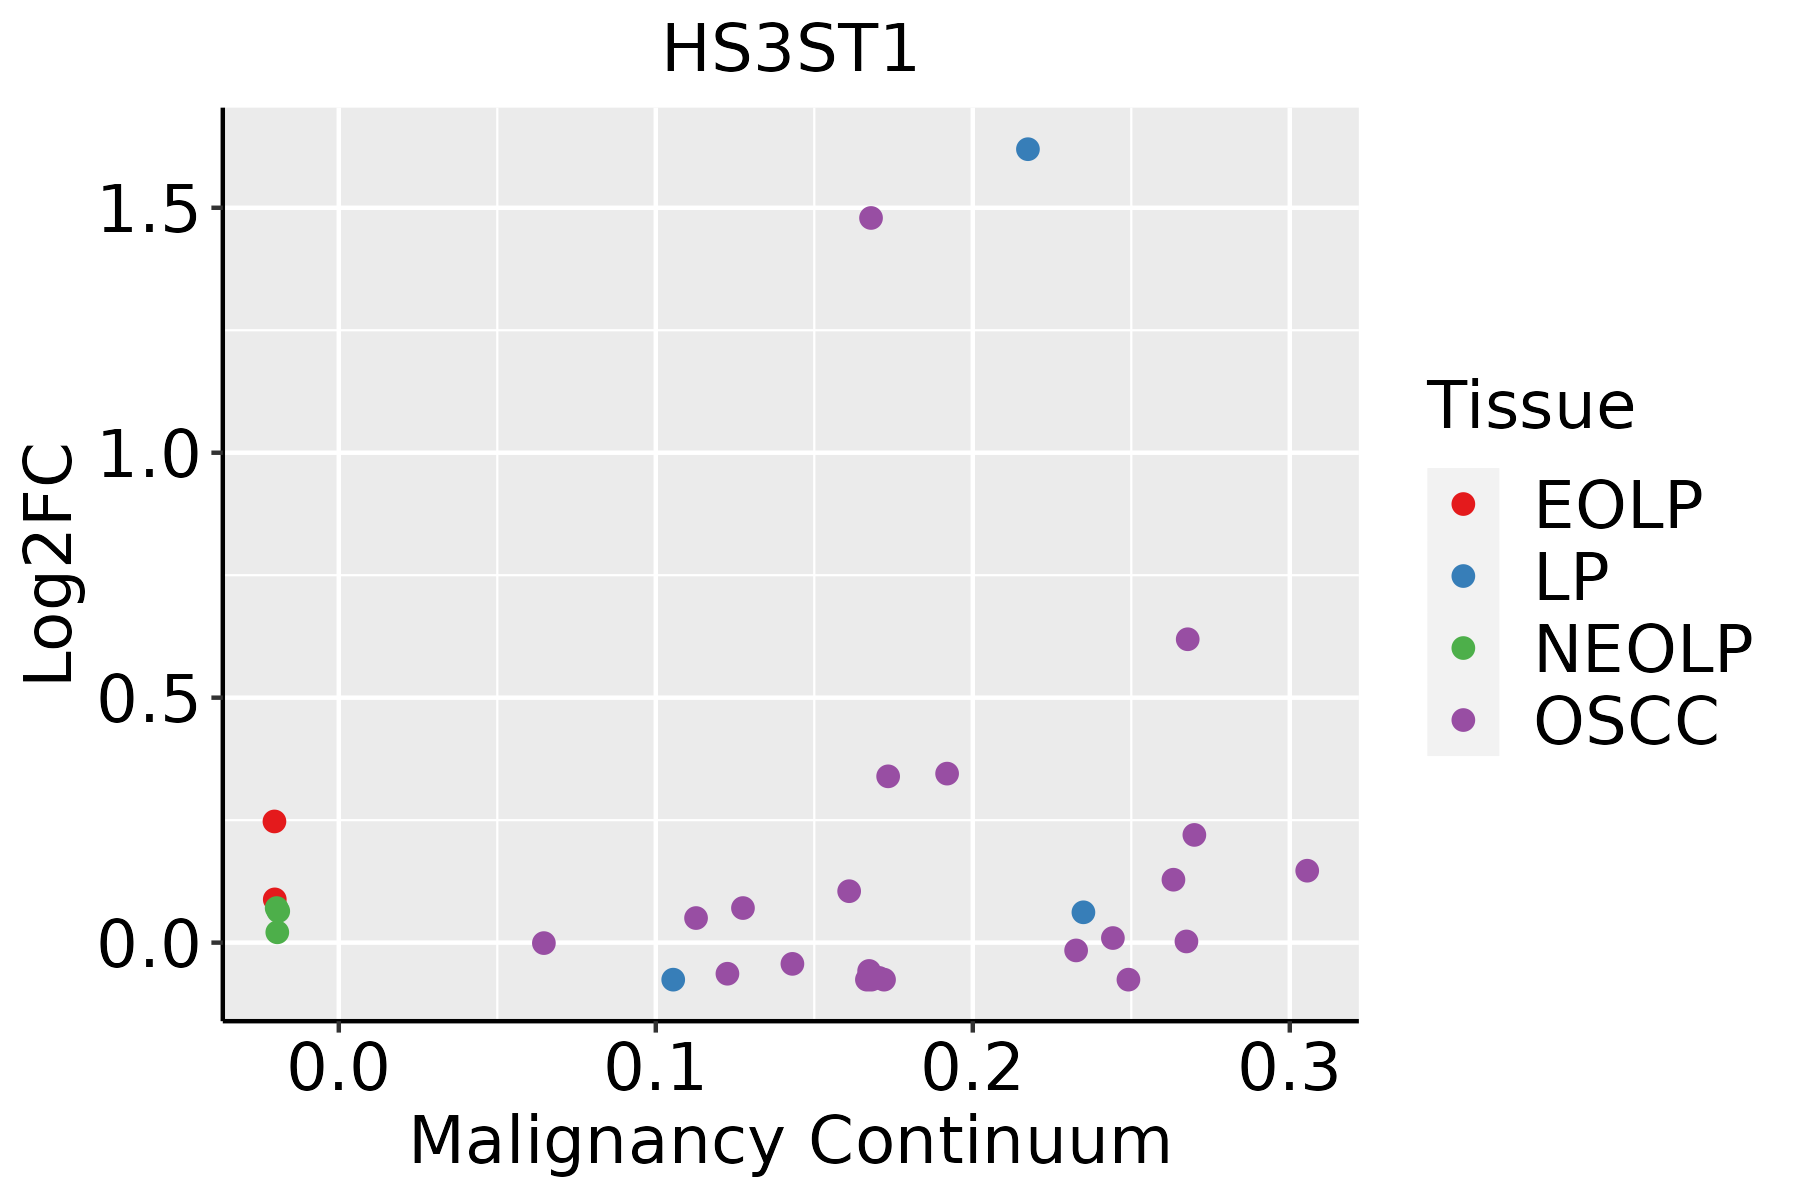 | EOLP: Erosive Oral lichen planus |
| LP: leukoplakia | ||
| NEOLP: Non-erosive oral lichen planus | ||
| OSCC: Oral squamous cell carcinoma |
| ∗log2FC in expression of this searched gene in stem-like cells from each diseased tissue sample relative to stem-like cells in normal samples in each tissue plotted against the malignancy continuum. Samples are colored based on if they are from different disease stage. |
Top |
Malignant transformation related pathway analysis |
| Find out the enriched GO biological processes and KEGG pathways involved in transition from healthy to precancer to cancer |
| Tissue | Disease Stage | Enriched GO biological Processes |
| Colorectum | AD |  |
| Colorectum | SER |  |
| Colorectum | MSS |  |
| Colorectum | MSI-H |  |
| Colorectum | FAP |  |
| ∗Top 15 enriched GO BP terms are showed in the bar plot of each disease state in each tissue. Each row represents a significant GO biological process which is colored according to the -log10(p.adjust). |
| Page: 1 2 3 4 5 6 7 8 9 |
| GO ID | Tissue | Disease Stage | Description | Gene Ratio | Bg Ratio | pvalue | p.adjust | Count |
| GO:0006024 | Esophagus | ESCC | glycosaminoglycan biosynthetic process | 45/8552 | 75/18723 | 8.75e-03 | 3.08e-02 | 45 |
| GO:0006023 | Esophagus | ESCC | aminoglycan biosynthetic process | 47/8552 | 79/18723 | 9.29e-03 | 3.23e-02 | 47 |
| Page: 1 |
| Pathway ID | Tissue | Disease Stage | Description | Gene Ratio | Bg Ratio | pvalue | p.adjust | qvalue | Count |
| Page: 1 |
Top |
Cell-cell communication analysis |
| Identification of potential cell-cell interactions between two cell types and their ligand-receptor pairs for different disease states |
| Ligand | Receptor | LRpair | Pathway | Tissue | Disease Stage |
| Page: 1 |
Top |
Single-cell gene regulatory network inference analysis |
| Find out the significant the regulons (TFs) and the target genes of each regulon across cell types for different disease states |
| TF | Cell Type | Tissue | Disease Stage | Target Gene | RSS | Regulon Activity |
| ∗The dot plots of a searched regulon are shown for all cell subpopulations in each disease state of each tissue based on the regulon specific score inferred using pySCENIC and by calculating the average expression. |
| Page: 1 |
Top |
Somatic mutation of malignant transformation related genes |
| Annotation of somatic variants for genes involved in malignant transformation |
| Hugo Symbol | Variant Class | Variant Classification | dbSNP RS | HGVSc | HGVSp | HGVSp Short | SWISSPROT | BIOTYPE | SIFT | PolyPhen | Tumor Sample Barcode | Tissue | Histology | Sex | Age | Stage | Therapy Types | Drugs | Outcome |
| HS3ST1 | SNV | Missense_Mutation | novel | c.716C>T | p.Pro239Leu | p.P239L | O14792 | protein_coding | deleterious(0.01) | probably_damaging(0.985) | TCGA-2W-A8YY-01 | Cervix | cervical & endocervical cancer | Female | <65 | I/II | Chemotherapy | cisplatin | CR |
| HS3ST1 | SNV | Missense_Mutation | novel | c.635T>C | p.Ile212Thr | p.I212T | O14792 | protein_coding | deleterious(0) | probably_damaging(0.995) | TCGA-AA-3713-01 | Colorectum | colon adenocarcinoma | Male | >=65 | III/IV | Chemotherapy | 5-fluorouracil | PR |
| HS3ST1 | SNV | Missense_Mutation | rs370389171 | c.859N>A | p.Glu287Lys | p.E287K | O14792 | protein_coding | tolerated(0.72) | benign(0.007) | TCGA-AA-A010-01 | Colorectum | colon adenocarcinoma | Female | <65 | I/II | Chemotherapy | folinic | CR |
| HS3ST1 | SNV | Missense_Mutation | rs370389171 | c.859N>A | p.Glu287Lys | p.E287K | O14792 | protein_coding | tolerated(0.72) | benign(0.007) | TCGA-AG-A002-01 | Colorectum | rectum adenocarcinoma | Male | <65 | I/II | Unknown | Unknown | SD |
| HS3ST1 | SNV | Missense_Mutation | rs570976366 | c.614G>A | p.Arg205His | p.R205H | O14792 | protein_coding | tolerated(0.09) | benign(0.343) | TCGA-A5-A0G1-01 | Endometrium | uterine corpus endometrioid carcinoma | Female | >=65 | I/II | Unknown | Unknown | SD |
| HS3ST1 | SNV | Missense_Mutation | novel | c.22N>A | p.Ala8Thr | p.A8T | O14792 | protein_coding | tolerated(0.44) | benign(0) | TCGA-A5-A1OF-01 | Endometrium | uterine corpus endometrioid carcinoma | Female | <65 | I/II | Unknown | Unknown | SD |
| HS3ST1 | SNV | Missense_Mutation | rs370389171 | c.859N>A | p.Glu287Lys | p.E287K | O14792 | protein_coding | tolerated(0.72) | benign(0.007) | TCGA-AJ-A3EL-01 | Endometrium | uterine corpus endometrioid carcinoma | Female | <65 | I/II | Unknown | Unknown | SD |
| HS3ST1 | SNV | Missense_Mutation | novel | c.835N>A | p.Pro279Thr | p.P279T | O14792 | protein_coding | tolerated(0.17) | benign(0.007) | TCGA-AP-A056-01 | Endometrium | uterine corpus endometrioid carcinoma | Female | <65 | I/II | Unknown | Unknown | SD |
| HS3ST1 | SNV | Missense_Mutation | rs751861377 | c.791N>A | p.Arg264His | p.R264H | O14792 | protein_coding | deleterious(0.03) | benign(0.327) | TCGA-AP-A059-01 | Endometrium | uterine corpus endometrioid carcinoma | Female | >=65 | I/II | Unknown | Unknown | SD |
| HS3ST1 | SNV | Missense_Mutation | c.365N>T | p.Ala122Val | p.A122V | O14792 | protein_coding | deleterious(0.01) | probably_damaging(0.975) | TCGA-AX-A0J1-01 | Endometrium | uterine corpus endometrioid carcinoma | Female | >=65 | I/II | Unknown | Unknown | SD |
| Page: 1 2 3 4 |
Top |
Related drugs of malignant transformation related genes |
| Identification of chemicals and drugs interact with genes involved in malignant transfromation |
| (DGIdb 4.0) |
| Entrez ID | Symbol | Category | Interaction Types | Drug Claim Name | Drug Name | PMIDs |
| Page: 1 |

Copyright 2023-Present -The University of Texas Health Science Center at Houston |