
|
|||||
|
 | |
| |
| |
| |
| |
| |
|
Gene: HS1BP3 |
Gene summary for HS1BP3 |
| Gene information | Species | Human | Gene symbol | HS1BP3 | Gene ID | 64342 |
| Gene name | HCLS1 binding protein 3 | |
| Gene Alias | ETM2 | |
| Cytomap | 2p24.1 | |
| Gene Type | protein-coding | GO ID | GO:0006915 | UniProtAcc | Q53T59 |
Top |
Malignant transformation analysis |
| Identification of the aberrant gene expression in precancerous and cancerous lesions by comparing the gene expression of stem-like cells in diseased tissues with normal stem cells |
| Entrez ID | Symbol | Replicates | Species | Organ | Tissue | Adj P-value | Log2FC | Malignancy |
| 64342 | HS1BP3 | LZE4T | Human | Esophagus | ESCC | 4.59e-09 | 2.05e-01 | 0.0811 |
| 64342 | HS1BP3 | LZE24T | Human | Esophagus | ESCC | 7.30e-14 | 1.98e-01 | 0.0596 |
| 64342 | HS1BP3 | LZE21T | Human | Esophagus | ESCC | 2.02e-02 | 2.95e-01 | 0.0655 |
| 64342 | HS1BP3 | P1T-E | Human | Esophagus | ESCC | 2.47e-05 | 1.95e-01 | 0.0875 |
| 64342 | HS1BP3 | P2T-E | Human | Esophagus | ESCC | 8.48e-23 | 3.89e-01 | 0.1177 |
| 64342 | HS1BP3 | P4T-E | Human | Esophagus | ESCC | 1.46e-06 | 2.52e-01 | 0.1323 |
| 64342 | HS1BP3 | P5T-E | Human | Esophagus | ESCC | 2.19e-13 | 1.79e-01 | 0.1327 |
| 64342 | HS1BP3 | P8T-E | Human | Esophagus | ESCC | 8.04e-11 | 1.28e-01 | 0.0889 |
| 64342 | HS1BP3 | P9T-E | Human | Esophagus | ESCC | 1.55e-12 | 2.69e-01 | 0.1131 |
| 64342 | HS1BP3 | P10T-E | Human | Esophagus | ESCC | 3.65e-19 | 2.33e-01 | 0.116 |
| 64342 | HS1BP3 | P11T-E | Human | Esophagus | ESCC | 3.95e-11 | 4.63e-01 | 0.1426 |
| 64342 | HS1BP3 | P12T-E | Human | Esophagus | ESCC | 2.51e-19 | 3.87e-01 | 0.1122 |
| 64342 | HS1BP3 | P15T-E | Human | Esophagus | ESCC | 1.11e-10 | 2.88e-01 | 0.1149 |
| 64342 | HS1BP3 | P16T-E | Human | Esophagus | ESCC | 5.95e-08 | 1.33e-01 | 0.1153 |
| 64342 | HS1BP3 | P19T-E | Human | Esophagus | ESCC | 2.84e-04 | 4.64e-01 | 0.1662 |
| 64342 | HS1BP3 | P20T-E | Human | Esophagus | ESCC | 3.02e-16 | 2.29e-01 | 0.1124 |
| 64342 | HS1BP3 | P21T-E | Human | Esophagus | ESCC | 8.40e-13 | 3.22e-01 | 0.1617 |
| 64342 | HS1BP3 | P22T-E | Human | Esophagus | ESCC | 8.46e-28 | 4.00e-01 | 0.1236 |
| 64342 | HS1BP3 | P23T-E | Human | Esophagus | ESCC | 2.17e-16 | 3.61e-01 | 0.108 |
| 64342 | HS1BP3 | P24T-E | Human | Esophagus | ESCC | 2.16e-13 | 1.77e-01 | 0.1287 |
| Page: 1 2 3 4 |
| Tissue | Expression Dynamics | Abbreviation |
| Esophagus | 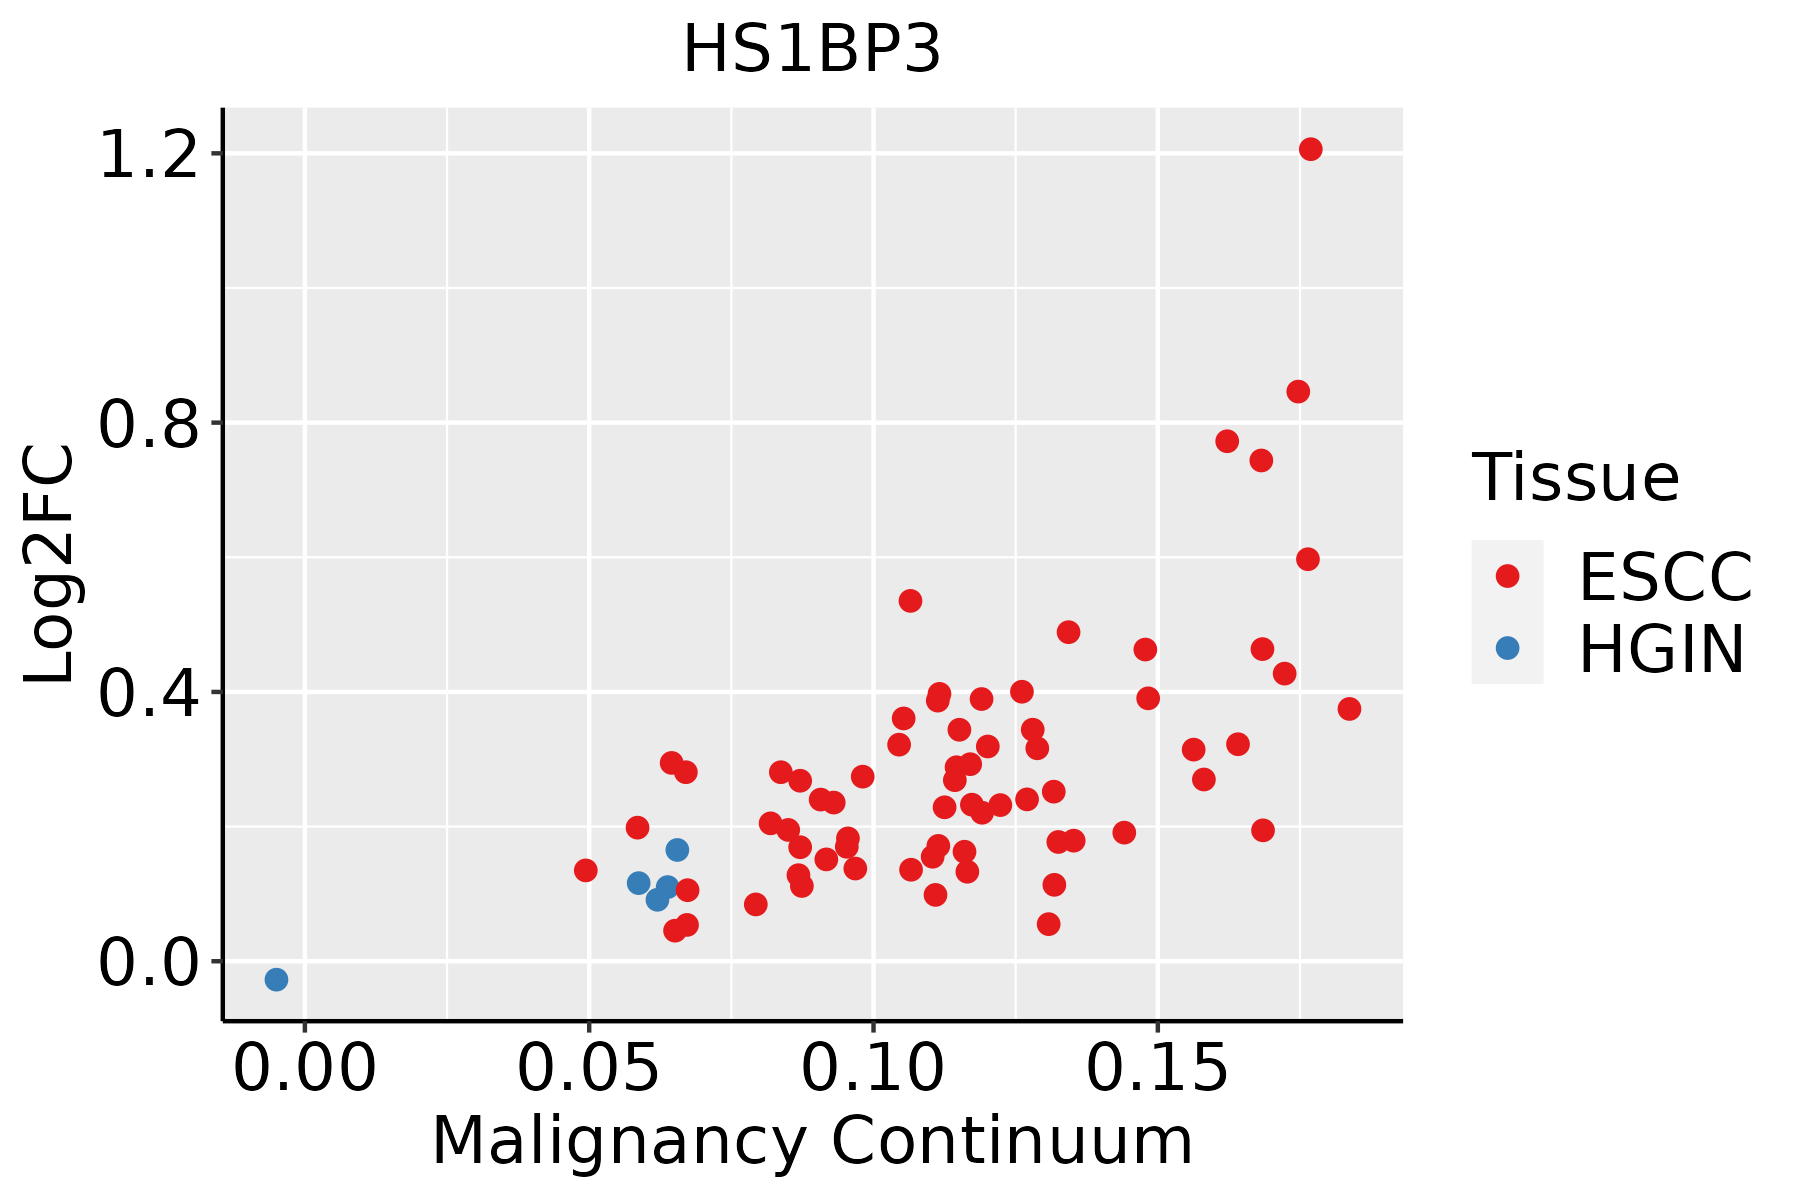 | ESCC: Esophageal squamous cell carcinoma |
| HGIN: High-grade intraepithelial neoplasias | ||
| LGIN: Low-grade intraepithelial neoplasias | ||
| Liver | 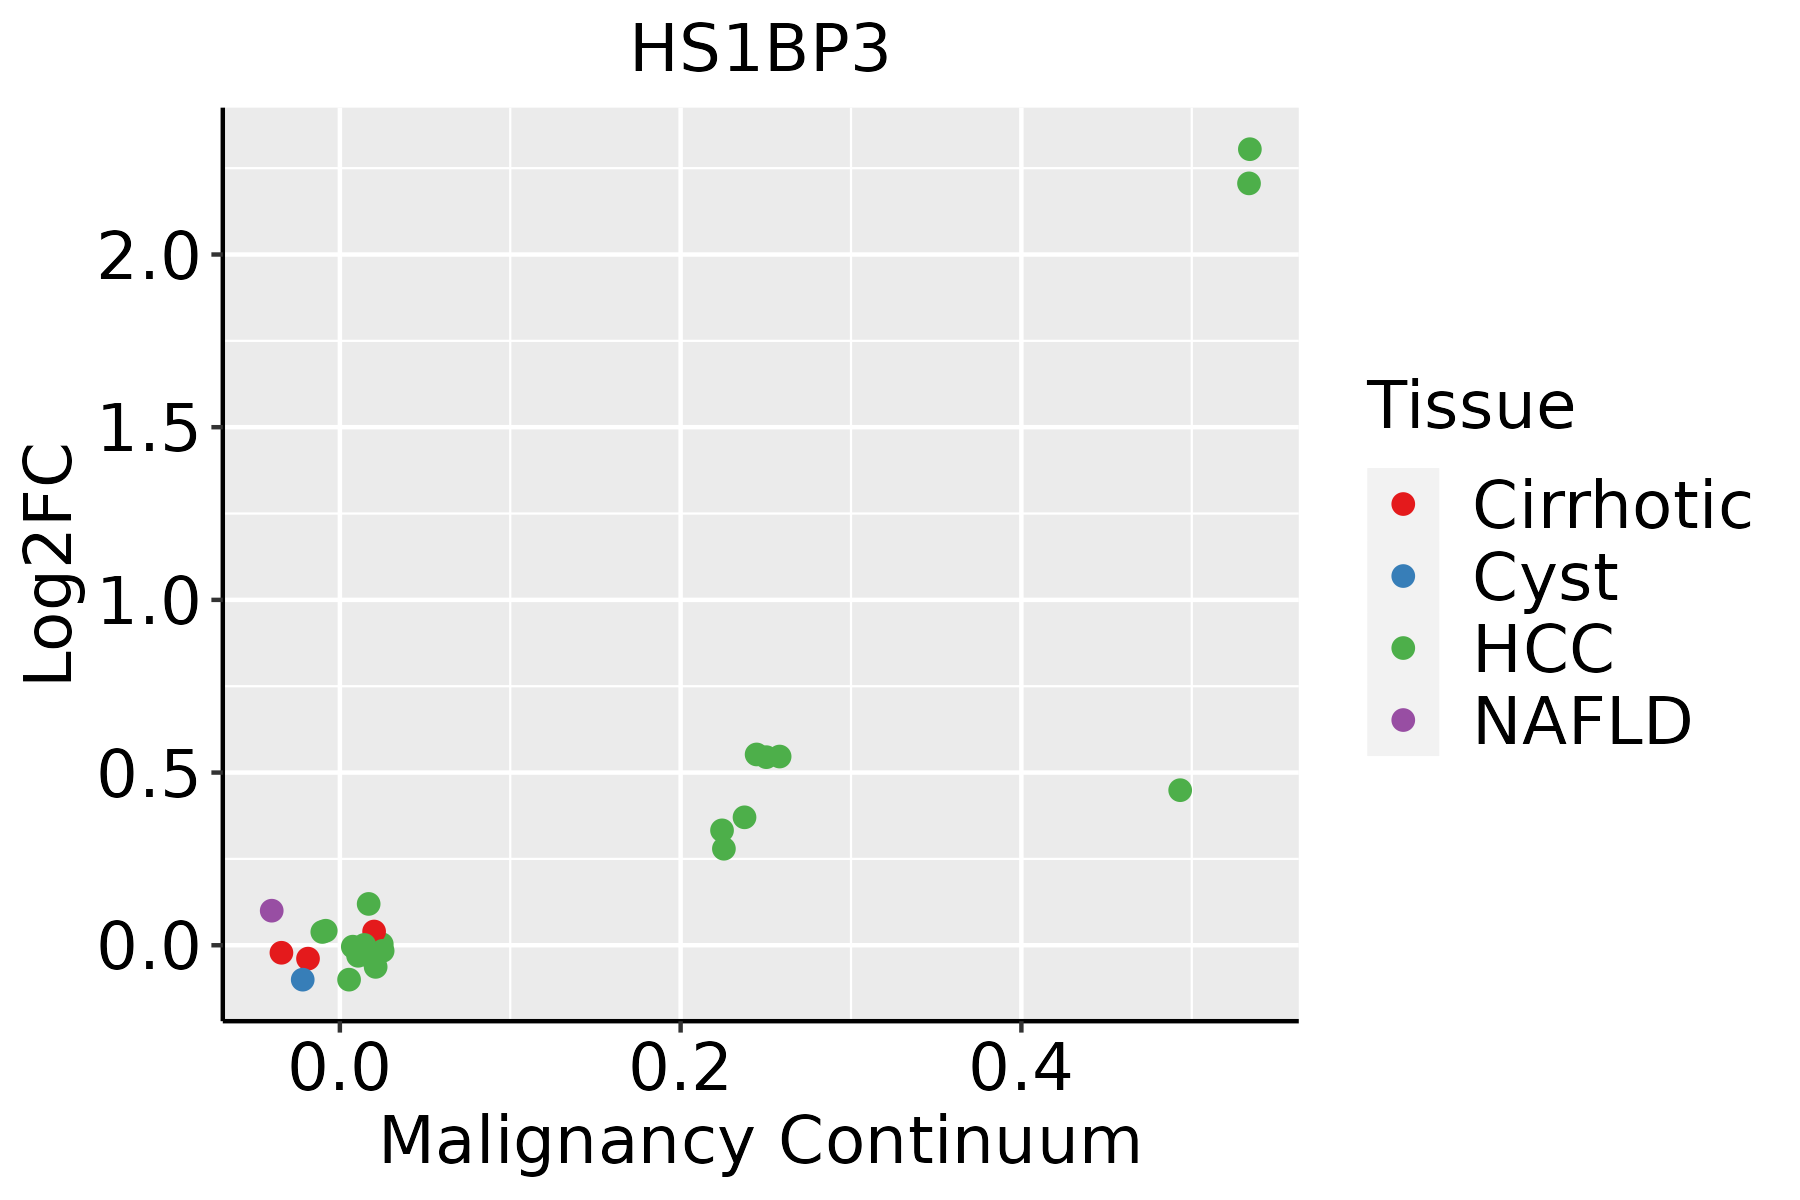 | HCC: Hepatocellular carcinoma |
| NAFLD: Non-alcoholic fatty liver disease |
| ∗log2FC in expression of this searched gene in stem-like cells from each diseased tissue sample relative to stem-like cells in normal samples in each tissue plotted against the malignancy continuum. Samples are colored based on if they are from different disease stage. |
Top |
Malignant transformation related pathway analysis |
| Find out the enriched GO biological processes and KEGG pathways involved in transition from healthy to precancer to cancer |
| Tissue | Disease Stage | Enriched GO biological Processes |
| Colorectum | AD |  |
| Colorectum | SER |  |
| Colorectum | MSS |  |
| Colorectum | MSI-H |  |
| Colorectum | FAP |  |
| ∗Top 15 enriched GO BP terms are showed in the bar plot of each disease state in each tissue. Each row represents a significant GO biological process which is colored according to the -log10(p.adjust). |
| Page: 1 2 3 4 5 6 7 8 9 |
| GO ID | Tissue | Disease Stage | Description | Gene Ratio | Bg Ratio | pvalue | p.adjust | Count |
| Page: 1 |
| Pathway ID | Tissue | Disease Stage | Description | Gene Ratio | Bg Ratio | pvalue | p.adjust | qvalue | Count |
| Page: 1 |
Top |
Cell-cell communication analysis |
| Identification of potential cell-cell interactions between two cell types and their ligand-receptor pairs for different disease states |
| Ligand | Receptor | LRpair | Pathway | Tissue | Disease Stage |
| Page: 1 |
Top |
Single-cell gene regulatory network inference analysis |
| Find out the significant the regulons (TFs) and the target genes of each regulon across cell types for different disease states |
| TF | Cell Type | Tissue | Disease Stage | Target Gene | RSS | Regulon Activity |
| ∗The dot plots of a searched regulon are shown for all cell subpopulations in each disease state of each tissue based on the regulon specific score inferred using pySCENIC and by calculating the average expression. |
| Page: 1 |
Top |
Somatic mutation of malignant transformation related genes |
| Annotation of somatic variants for genes involved in malignant transformation |
| Hugo Symbol | Variant Class | Variant Classification | dbSNP RS | HGVSc | HGVSp | HGVSp Short | SWISSPROT | BIOTYPE | SIFT | PolyPhen | Tumor Sample Barcode | Tissue | Histology | Sex | Age | Stage | Therapy Types | Drugs | Outcome |
| HS1BP3 | SNV | Missense_Mutation | c.99N>C | p.Lys33Asn | p.K33N | Q53T59 | protein_coding | deleterious(0.01) | possibly_damaging(0.745) | TCGA-AC-A23H-01 | Breast | breast invasive carcinoma | Female | >=65 | I/II | Unknown | Unknown | PD | |
| HS1BP3 | insertion | Frame_Shift_Ins | novel | c.469_470insTTTTCCTC | p.Asp157ValfsTer33 | p.D157Vfs*33 | Q53T59 | protein_coding | TCGA-A8-A06X-01 | Breast | breast invasive carcinoma | Female | >=65 | I/II | Unknown | Unknown | SD | ||
| HS1BP3 | insertion | In_Frame_Ins | novel | c.468_469insTCTCTGGCCATTTACAATCTCTTTTCTTCG | p.Thr156_Asp157insSerLeuAlaIleTyrAsnLeuPheSerSer | p.T156_D157insSLAIYNLFSS | Q53T59 | protein_coding | TCGA-A8-A06X-01 | Breast | breast invasive carcinoma | Female | >=65 | I/II | Unknown | Unknown | SD | ||
| HS1BP3 | SNV | Missense_Mutation | rs569287360 | c.715N>A | p.Glu239Lys | p.E239K | Q53T59 | protein_coding | tolerated(0.16) | benign(0.039) | TCGA-UC-A7PG-06 | Cervix | cervical & endocervical cancer | Female | <65 | III/IV | Chemotherapy | cisplatin | PD |
| HS1BP3 | SNV | Missense_Mutation | c.409A>G | p.Thr137Ala | p.T137A | Q53T59 | protein_coding | tolerated(0.2) | possibly_damaging(0.82) | TCGA-AA-3510-01 | Colorectum | colon adenocarcinoma | Male | >=65 | I/II | Unknown | Unknown | SD | |
| HS1BP3 | SNV | Missense_Mutation | novel | c.199G>A | p.Gly67Asp | p.G67D | protein_coding | unknown(0) | TCGA-AM-5821-01 | Colorectum | colon adenocarcinoma | Female | >=65 | I/II | Unknown | Unknown | SD | ||
| HS1BP3 | SNV | Missense_Mutation | rs749637149 | c.91N>T | p.Arg31Trp | p.R31W | Q53T59 | protein_coding | deleterious(0.01) | probably_damaging(0.999) | TCGA-CA-6717-01 | Colorectum | colon adenocarcinoma | Male | <65 | I/II | Chemotherapy | oxaliplatin | CR |
| HS1BP3 | SNV | Missense_Mutation | c.617T>A | p.Ile206Asn | p.I206N | Q53T59 | protein_coding | deleterious(0.04) | possibly_damaging(0.543) | TCGA-D5-6931-01 | Colorectum | colon adenocarcinoma | Male | >=65 | III/IV | Unknown | Unknown | SD | |
| HS1BP3 | SNV | Missense_Mutation | c.702N>T | p.Glu234Asp | p.E234D | Q53T59 | protein_coding | deleterious(0.02) | probably_damaging(0.987) | TCGA-G4-6588-01 | Colorectum | colon adenocarcinoma | Female | <65 | I/II | Unknown | Unknown | SD | |
| HS1BP3 | SNV | Missense_Mutation | rs777489598 | c.143N>A | p.Arg48His | p.R48H | Q53T59 | protein_coding | deleterious(0.04) | probably_damaging(0.989) | TCGA-EI-6513-01 | Colorectum | rectum adenocarcinoma | Male | <65 | III/IV | Unknown | Unknown | SD |
| Page: 1 2 3 4 |
Top |
Related drugs of malignant transformation related genes |
| Identification of chemicals and drugs interact with genes involved in malignant transfromation |
| (DGIdb 4.0) |
| Entrez ID | Symbol | Category | Interaction Types | Drug Claim Name | Drug Name | PMIDs |
| Page: 1 |

Copyright 2023-Present -The University of Texas Health Science Center at Houston |