
|
|||||
|
 | |
| |
| |
| |
| |
| |
|
Gene: HRH4 |
Gene summary for HRH4 |
| Gene information | Species | Human | Gene symbol | HRH4 | Gene ID | 59340 |
| Gene name | histamine receptor H4 | |
| Gene Alias | AXOR35 | |
| Cytomap | 18q11.2 | |
| Gene Type | protein-coding | GO ID | GO:0000165 | UniProtAcc | Q9H3N8 |
Top |
Malignant transformation analysis |
| Identification of the aberrant gene expression in precancerous and cancerous lesions by comparing the gene expression of stem-like cells in diseased tissues with normal stem cells |
| Entrez ID | Symbol | Replicates | Species | Organ | Tissue | Adj P-value | Log2FC | Malignancy |
| 59340 | HRH4 | HCC1 | Human | Liver | HCC | 1.73e-10 | 1.68e+00 | 0.5336 |
| 59340 | HRH4 | HCC2 | Human | Liver | HCC | 9.31e-26 | 1.40e+00 | 0.5341 |
| 59340 | HRH4 | HCC5 | Human | Liver | HCC | 1.48e-15 | 1.26e+00 | 0.4932 |
| Page: 1 |
| Tissue | Expression Dynamics | Abbreviation |
| Liver | 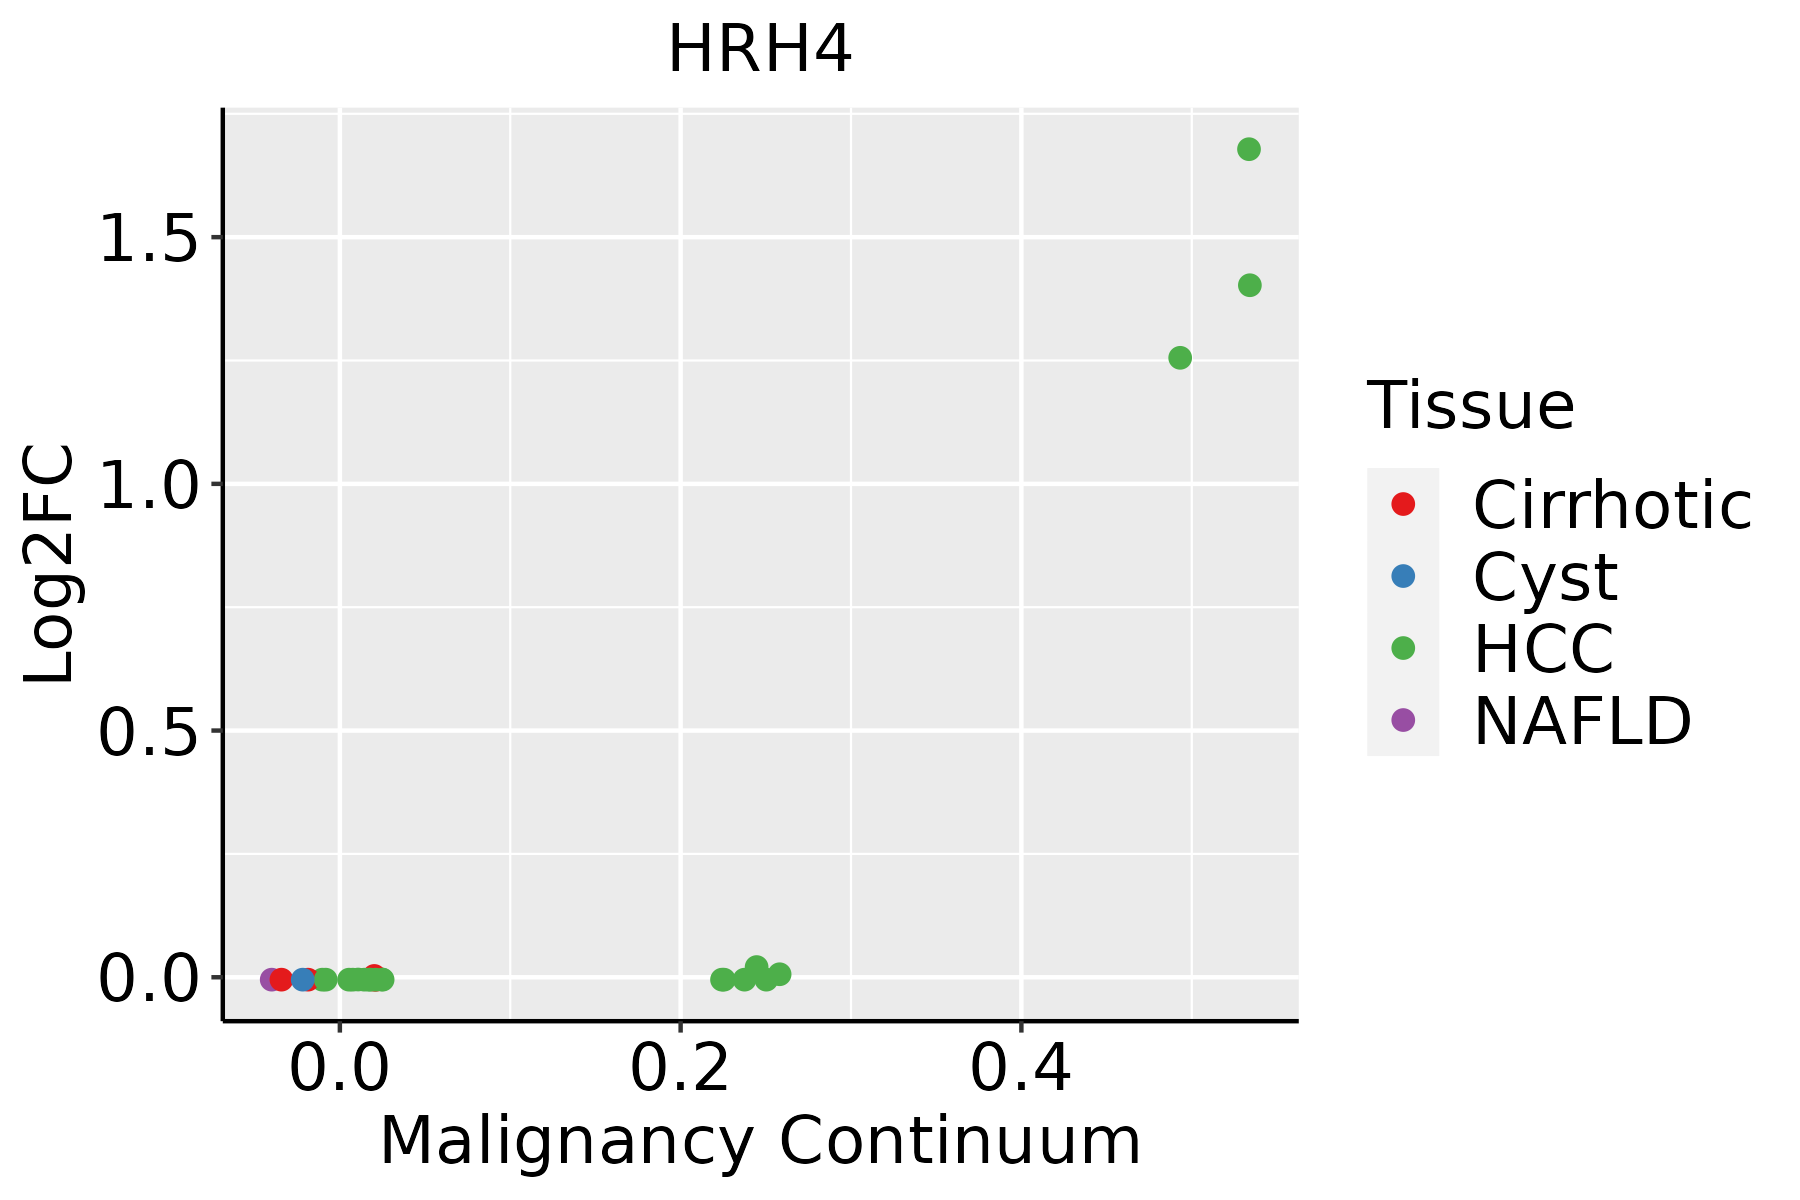 | HCC: Hepatocellular carcinoma |
| NAFLD: Non-alcoholic fatty liver disease |
| ∗log2FC in expression of this searched gene in stem-like cells from each diseased tissue sample relative to stem-like cells in normal samples in each tissue plotted against the malignancy continuum. Samples are colored based on if they are from different disease stage. |
Top |
Malignant transformation related pathway analysis |
| Find out the enriched GO biological processes and KEGG pathways involved in transition from healthy to precancer to cancer |
| Tissue | Disease Stage | Enriched GO biological Processes |
| Colorectum | AD |  |
| Colorectum | SER |  |
| Colorectum | MSS |  |
| Colorectum | MSI-H |  |
| Colorectum | FAP |  |
| ∗Top 15 enriched GO BP terms are showed in the bar plot of each disease state in each tissue. Each row represents a significant GO biological process which is colored according to the -log10(p.adjust). |
| Page: 1 2 3 4 5 6 7 8 9 |
| GO ID | Tissue | Disease Stage | Description | Gene Ratio | Bg Ratio | pvalue | p.adjust | Count |
| Page: 1 |
| Pathway ID | Tissue | Disease Stage | Description | Gene Ratio | Bg Ratio | pvalue | p.adjust | qvalue | Count |
| Page: 1 |
Top |
Cell-cell communication analysis |
| Identification of potential cell-cell interactions between two cell types and their ligand-receptor pairs for different disease states |
| Ligand | Receptor | LRpair | Pathway | Tissue | Disease Stage |
| Page: 1 |
Top |
Single-cell gene regulatory network inference analysis |
| Find out the significant the regulons (TFs) and the target genes of each regulon across cell types for different disease states |
| TF | Cell Type | Tissue | Disease Stage | Target Gene | RSS | Regulon Activity |
| ∗The dot plots of a searched regulon are shown for all cell subpopulations in each disease state of each tissue based on the regulon specific score inferred using pySCENIC and by calculating the average expression. |
| Page: 1 |
Top |
Somatic mutation of malignant transformation related genes |
| Annotation of somatic variants for genes involved in malignant transformation |
| Hugo Symbol | Variant Class | Variant Classification | dbSNP RS | HGVSc | HGVSp | HGVSp Short | SWISSPROT | BIOTYPE | SIFT | PolyPhen | Tumor Sample Barcode | Tissue | Histology | Sex | Age | Stage | Therapy Types | Drugs | Outcome |
| HRH4 | SNV | Missense_Mutation | novel | c.1133N>G | p.Gln378Arg | p.Q378R | Q9H3N8 | protein_coding | tolerated(0.14) | benign(0.115) | TCGA-AR-A0U0-01 | Breast | breast invasive carcinoma | Female | >=65 | I/II | Unknown | Unknown | SD |
| HRH4 | SNV | Missense_Mutation | c.452N>C | p.Ile151Thr | p.I151T | Q9H3N8 | protein_coding | deleterious(0) | probably_damaging(0.991) | TCGA-BH-A0BZ-01 | Breast | breast invasive carcinoma | Female | <65 | III/IV | Chemotherapy | doxorubicin | CR | |
| HRH4 | SNV | Missense_Mutation | c.992C>T | p.Ser331Leu | p.S331L | Q9H3N8 | protein_coding | tolerated(0.23) | benign(0.02) | TCGA-D8-A1J8-01 | Breast | breast invasive carcinoma | Female | >=65 | I/II | Hormone Therapy | nolvadex | SD | |
| HRH4 | SNV | Missense_Mutation | c.989C>T | p.Ser330Phe | p.S330F | Q9H3N8 | protein_coding | tolerated(0.7) | possibly_damaging(0.625) | TCGA-E9-A243-01 | Breast | breast invasive carcinoma | Female | <65 | I/II | Chemotherapy | 5-fluorouracil | PD | |
| HRH4 | insertion | Nonsense_Mutation | novel | c.1135_1136insTAAGATGA | p.Pro379LeufsTer3 | p.P379Lfs*3 | Q9H3N8 | protein_coding | TCGA-AR-A0U0-01 | Breast | breast invasive carcinoma | Female | >=65 | I/II | Unknown | Unknown | SD | ||
| HRH4 | SNV | Missense_Mutation | rs747220498 | c.235N>A | p.Glu79Lys | p.E79K | Q9H3N8 | protein_coding | tolerated(1) | benign(0.01) | TCGA-2W-A8YY-01 | Cervix | cervical & endocervical cancer | Female | <65 | I/II | Chemotherapy | cisplatin | CR |
| HRH4 | SNV | Missense_Mutation | c.43N>T | p.Arg15Cys | p.R15C | Q9H3N8 | protein_coding | tolerated(0.14) | benign(0) | TCGA-EK-A2GZ-01 | Cervix | cervical & endocervical cancer | Female | <65 | III/IV | Unknown | Unknown | SD | |
| HRH4 | SNV | Missense_Mutation | c.368G>T | p.Arg123Ile | p.R123I | Q9H3N8 | protein_coding | deleterious(0) | probably_damaging(0.995) | TCGA-FU-A3HZ-01 | Cervix | cervical & endocervical cancer | Female | <65 | I/II | Chemotherapy | cisplatin | CR | |
| HRH4 | SNV | Missense_Mutation | rs773632780 | c.571N>A | p.Ala191Thr | p.A191T | Q9H3N8 | protein_coding | tolerated(0.93) | benign(0.136) | TCGA-A6-3809-01 | Colorectum | colon adenocarcinoma | Female | >=65 | I/II | Unknown | Unknown | SD |
| HRH4 | SNV | Missense_Mutation | c.1151N>G | p.His384Arg | p.H384R | Q9H3N8 | protein_coding | tolerated(0.06) | benign(0.007) | TCGA-AA-3977-01 | Colorectum | colon adenocarcinoma | Male | >=65 | I/II | Unknown | Unknown | SD |
| Page: 1 2 3 4 5 6 7 |
Top |
Related drugs of malignant transformation related genes |
| Identification of chemicals and drugs interact with genes involved in malignant transfromation |
| (DGIdb 4.0) |
| Entrez ID | Symbol | Category | Interaction Types | Drug Claim Name | Drug Name | PMIDs |
| 59340 | HRH4 | DRUGGABLE GENOME, G PROTEIN COUPLED RECEPTOR | antagonist | 178103918 | MK-0249 | |
| 59340 | HRH4 | DRUGGABLE GENOME, G PROTEIN COUPLED RECEPTOR | agonist | 135650396 | ||
| 59340 | HRH4 | DRUGGABLE GENOME, G PROTEIN COUPLED RECEPTOR | antagonist | 135650102 | CIPROXIFAN | |
| 59340 | HRH4 | DRUGGABLE GENOME, G PROTEIN COUPLED RECEPTOR | antagonist | 310264705 | PITOLISANT | |
| 59340 | HRH4 | DRUGGABLE GENOME, G PROTEIN COUPLED RECEPTOR | antagonist | CHEMBL3301609 | TOREFORANT | |
| 59340 | HRH4 | DRUGGABLE GENOME, G PROTEIN COUPLED RECEPTOR | agonist | 135651493 | HISTAMINE | |
| 59340 | HRH4 | DRUGGABLE GENOME, G PROTEIN COUPLED RECEPTOR | JNJ-7777120 | JNJ-7777120 | 21920751 | |
| 59340 | HRH4 | DRUGGABLE GENOME, G PROTEIN COUPLED RECEPTOR | agonist | 135650388 | IMPROMIDINE | |
| 59340 | HRH4 | DRUGGABLE GENOME, G PROTEIN COUPLED RECEPTOR | risperidone | RISPERIDONE | 23422377 | |
| 59340 | HRH4 | DRUGGABLE GENOME, G PROTEIN COUPLED RECEPTOR | agonist | 135651314 |
| Page: 1 2 3 4 5 6 |

Copyright 2023-Present -The University of Texas Health Science Center at Houston |