| Tissue | Expression Dynamics | Abbreviation |
| Cervix | 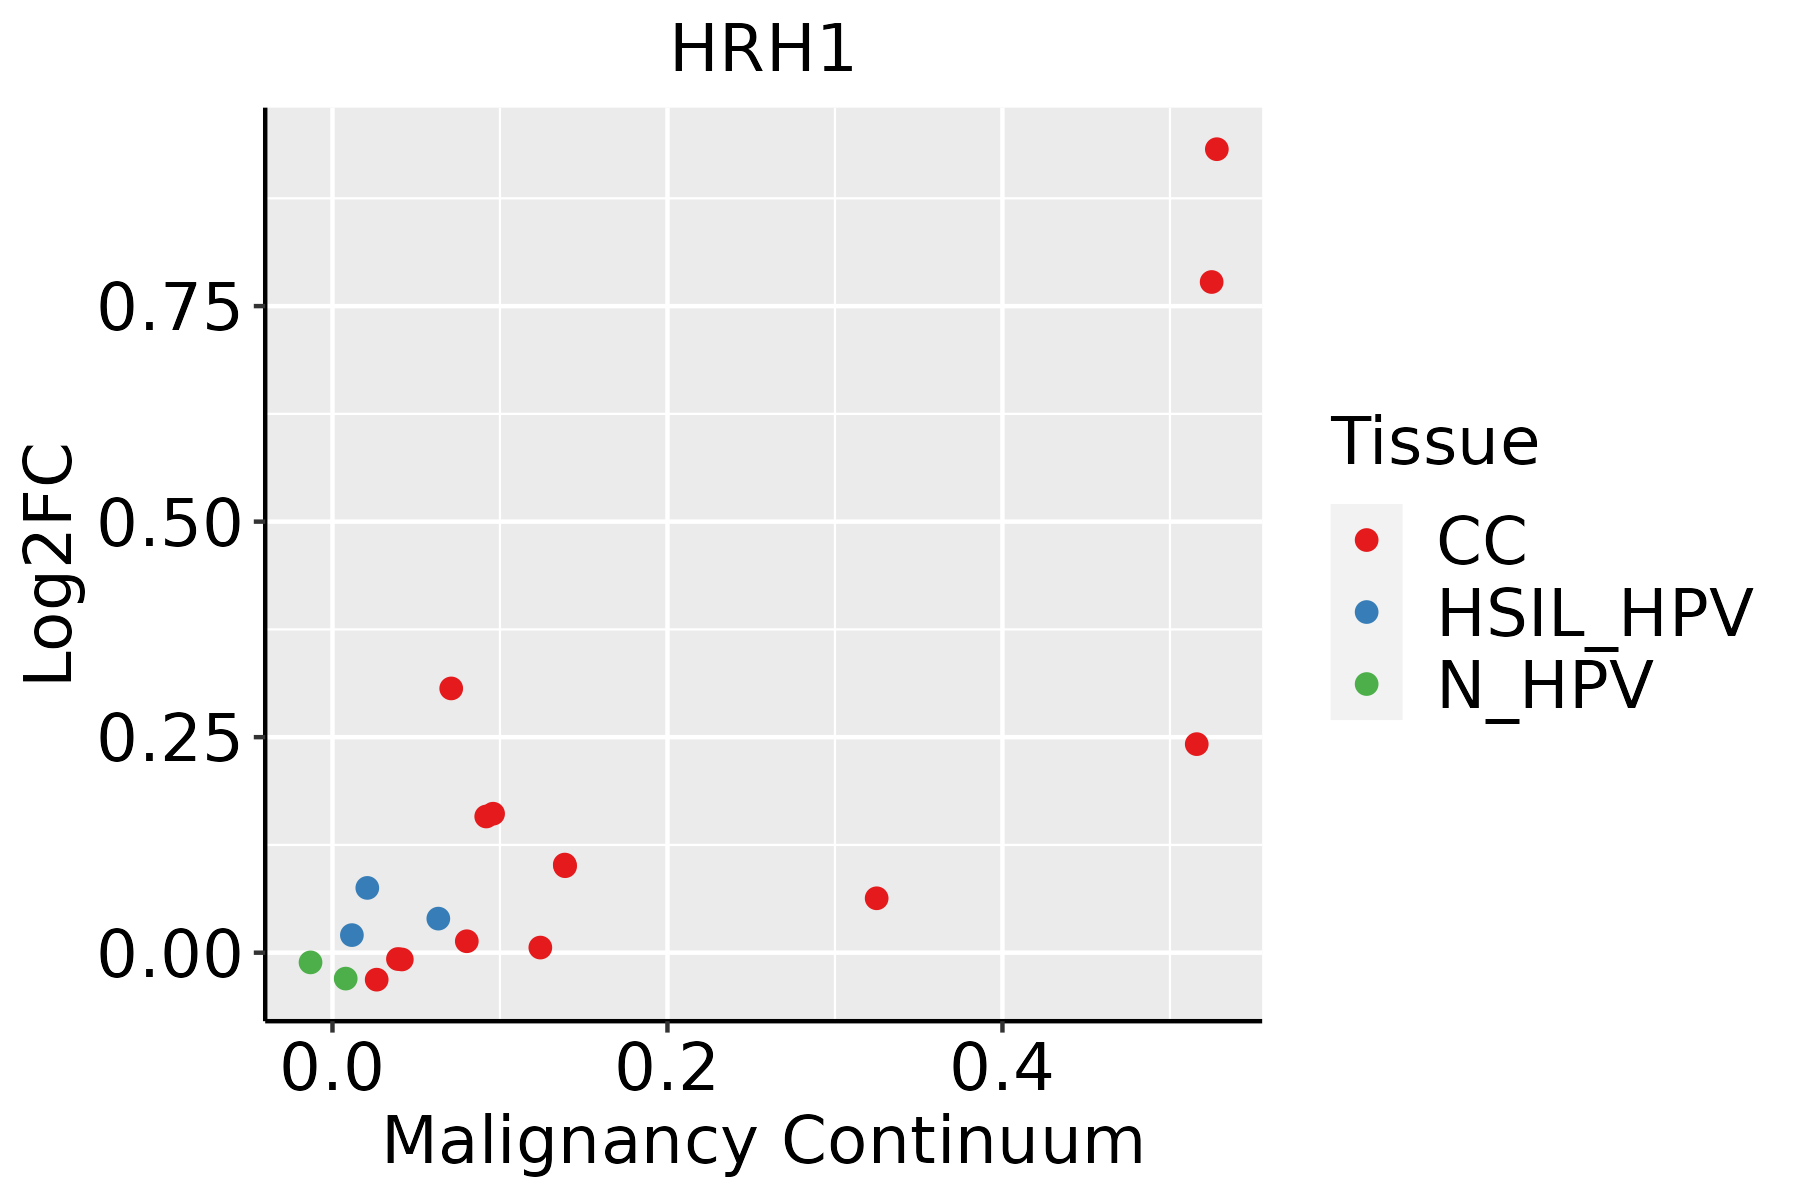 | CC: Cervix cancer |
| HSIL_HPV: HPV-infected high-grade squamous intraepithelial lesions |
| N_HPV: HPV-infected normal cervix |
| Colorectum (GSE201348) |  | FAP: Familial adenomatous polyposis |
| CRC: Colorectal cancer |
| Colorectum (HTA11) |  | AD: Adenomas |
| SER: Sessile serrated lesions |
| MSI-H: Microsatellite-high colorectal cancer |
| MSS: Microsatellite stable colorectal cancer |
| Lung | 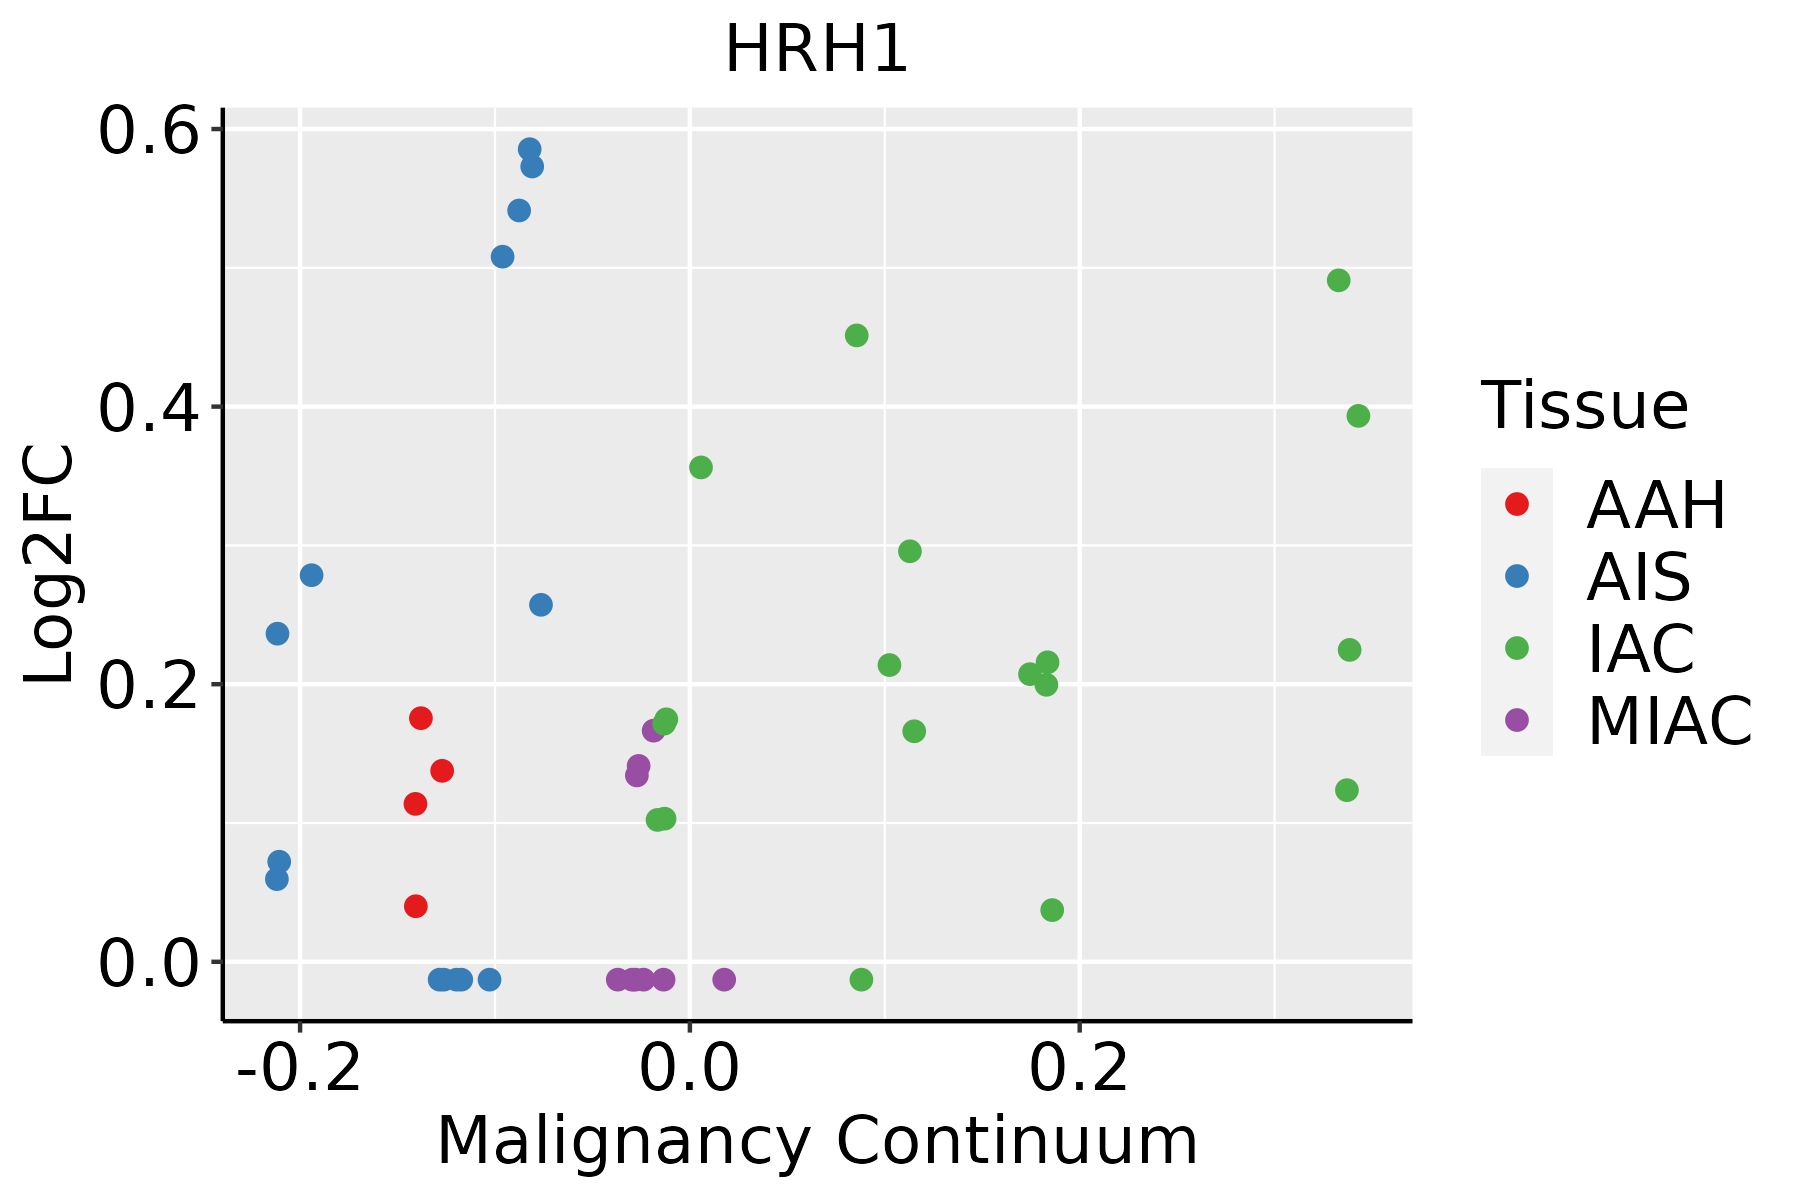 | AAH: Atypical adenomatous hyperplasia |
| AIS: Adenocarcinoma in situ |
| IAC: Invasive lung adenocarcinoma |
| MIA: Minimally invasive adenocarcinoma |
| Thyroid | 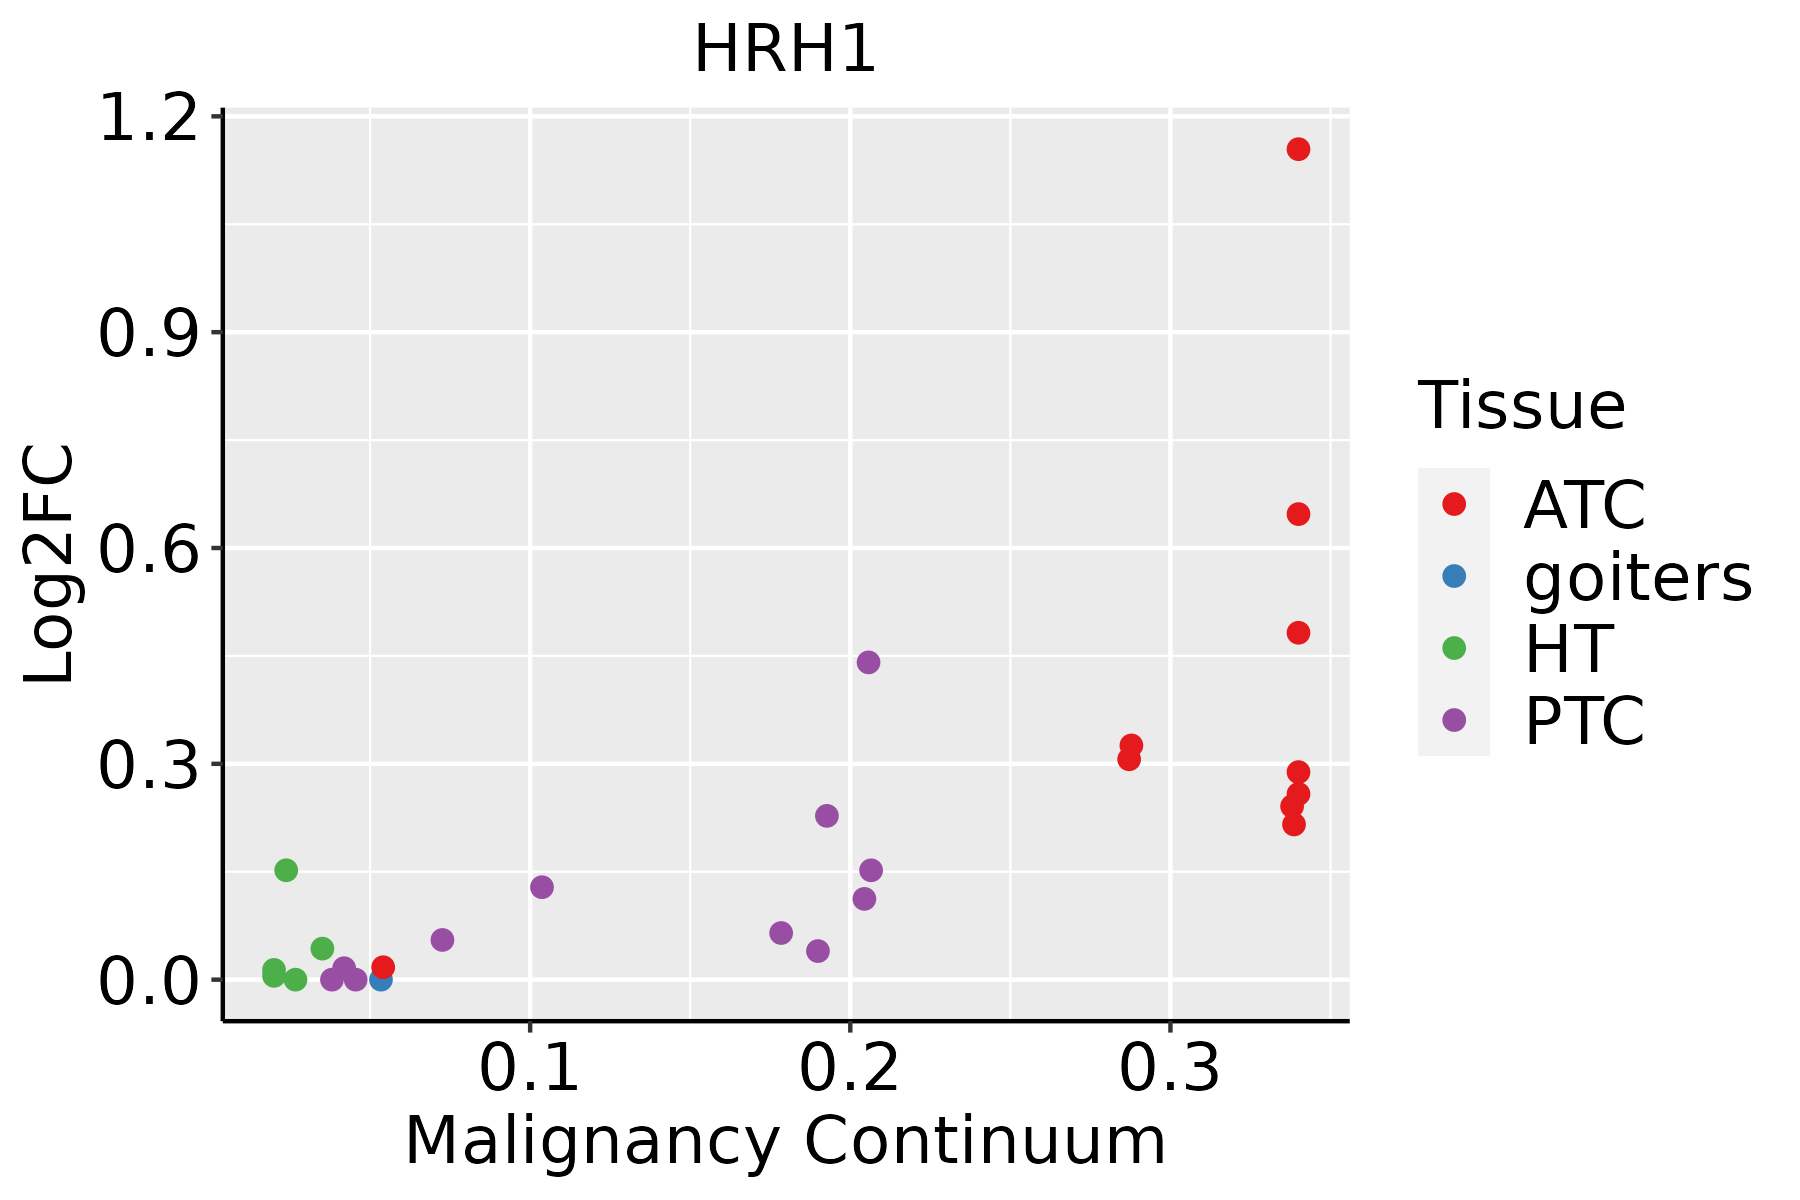 | ATC: Anaplastic thyroid cancer |
| HT: Hashimoto's thyroiditis |
| PTC: Papillary thyroid cancer |
| GO ID | Tissue | Disease Stage | Description | Gene Ratio | Bg Ratio | pvalue | p.adjust | Count |
| GO:00603267 | Cervix | CC | cell chemotaxis | 73/2311 | 310/18723 | 2.82e-08 | 1.96e-06 | 73 |
| GO:00975298 | Cervix | CC | myeloid leukocyte migration | 56/2311 | 220/18723 | 7.21e-08 | 4.15e-06 | 56 |
| GO:00305957 | Cervix | CC | leukocyte chemotaxis | 57/2311 | 230/18723 | 1.48e-07 | 7.07e-06 | 57 |
| GO:00716218 | Cervix | CC | granulocyte chemotaxis | 37/2311 | 125/18723 | 2.16e-07 | 9.56e-06 | 37 |
| GO:00509007 | Cervix | CC | leukocyte migration | 78/2311 | 369/18723 | 1.09e-06 | 3.80e-05 | 78 |
| GO:00975308 | Cervix | CC | granulocyte migration | 39/2311 | 148/18723 | 2.67e-06 | 7.87e-05 | 39 |
| GO:00093149 | Cervix | CC | response to radiation | 86/2311 | 456/18723 | 3.50e-05 | 5.63e-04 | 86 |
| GO:00094163 | Cervix | CC | response to light stimulus | 54/2311 | 320/18723 | 1.03e-02 | 4.97e-02 | 54 |
| GO:0006066 | Colorectum | AD | alcohol metabolic process | 106/3918 | 353/18723 | 3.02e-05 | 5.57e-04 | 106 |
| GO:0044262 | Colorectum | AD | cellular carbohydrate metabolic process | 87/3918 | 283/18723 | 6.00e-05 | 1.01e-03 | 87 |
| GO:0006109 | Colorectum | AD | regulation of carbohydrate metabolic process | 55/3918 | 178/18723 | 1.10e-03 | 1.01e-02 | 55 |
| GO:0062012 | Colorectum | AD | regulation of small molecule metabolic process | 93/3918 | 334/18723 | 1.46e-03 | 1.24e-02 | 93 |
| GO:00060661 | Colorectum | SER | alcohol metabolic process | 79/2897 | 353/18723 | 3.50e-04 | 5.50e-03 | 79 |
| GO:00060662 | Colorectum | MSS | alcohol metabolic process | 92/3467 | 353/18723 | 2.57e-04 | 3.46e-03 | 92 |
| GO:00620121 | Colorectum | MSS | regulation of small molecule metabolic process | 83/3467 | 334/18723 | 2.25e-03 | 1.85e-02 | 83 |
| GO:00061091 | Colorectum | MSS | regulation of carbohydrate metabolic process | 47/3467 | 178/18723 | 5.75e-03 | 3.90e-02 | 47 |
| GO:0062013 | Colorectum | MSS | positive regulation of small molecule metabolic process | 39/3467 | 143/18723 | 6.34e-03 | 4.23e-02 | 39 |
| GO:00442621 | Colorectum | FAP | cellular carbohydrate metabolic process | 66/2622 | 283/18723 | 1.53e-05 | 4.01e-04 | 66 |
| GO:00061092 | Colorectum | FAP | regulation of carbohydrate metabolic process | 46/2622 | 178/18723 | 1.99e-05 | 4.90e-04 | 46 |
| GO:00620122 | Colorectum | FAP | regulation of small molecule metabolic process | 74/2622 | 334/18723 | 3.15e-05 | 7.13e-04 | 74 |
| Hugo Symbol | Variant Class | Variant Classification | dbSNP RS | HGVSc | HGVSp | HGVSp Short | SWISSPROT | BIOTYPE | SIFT | PolyPhen | Tumor Sample Barcode | Tissue | Histology | Sex | Age | Stage | Therapy Types | Drugs | Outcome |
| HRH1 | SNV | Missense_Mutation | rs773371879 | c.434C>T | p.Ser145Leu | p.S145L | P35367 | protein_coding | tolerated(0.18) | probably_damaging(0.931) | TCGA-A2-A04Y-01 | Breast | breast invasive carcinoma | Female | <65 | I/II | Chemotherapy | cytoxan | SD |
| HRH1 | SNV | Missense_Mutation | | c.616N>G | p.Met206Val | p.M206V | P35367 | protein_coding | deleterious(0) | possibly_damaging(0.472) | TCGA-D8-A1XY-01 | Breast | breast invasive carcinoma | Female | >=65 | I/II | Chemotherapy | tamoxiphen | SD |
| HRH1 | SNV | Missense_Mutation | novel | c.916G>A | p.Asp306Asn | p.D306N | P35367 | protein_coding | tolerated(0.49) | benign(0) | TCGA-D8-A73U-01 | Breast | breast invasive carcinoma | Female | >=65 | I/II | Hormone Therapy | tamoxiphen | SD |
| HRH1 | insertion | Frame_Shift_Ins | novel | c.102_103insTTAGGTTTAGGTCCCACTTCTAAATTTACCA | p.Ser35LeufsTer31 | p.S35Lfs*31 | P35367 | protein_coding | | | TCGA-A8-A093-01 | Breast | breast invasive carcinoma | Female | <65 | I/II | Hormone Therapy | tamoxiphen | SD |
| HRH1 | insertion | Nonsense_Mutation | novel | c.412_413insCCTAGAAGAGTGACAGAAATTCAATAAATAGTTGTTAAGTGAGCAA | p.Tyr138SerfsTer2 | p.Y138Sfs*2 | P35367 | protein_coding | | | TCGA-AO-A0JB-01 | Breast | breast invasive carcinoma | Female | <65 | III/IV | Chemotherapy | cyclophosphamide | SD |
| HRH1 | SNV | Missense_Mutation | | c.1299N>G | p.Ile433Met | p.I433M | P35367 | protein_coding | deleterious(0) | probably_damaging(0.947) | TCGA-C5-A7UH-01 | Cervix | cervical & endocervical cancer | Female | <65 | III/IV | Chemotherapy | cisplatin | SD |
| HRH1 | SNV | Missense_Mutation | | c.835A>T | p.Thr279Ser | p.T279S | P35367 | protein_coding | tolerated(0.73) | benign(0) | TCGA-WL-A834-01 | Cervix | cervical & endocervical cancer | Female | <65 | I/II | Chemotherapy | paclitaxel | SD |
| HRH1 | SNV | Missense_Mutation | rs138501310 | c.1187C>T | p.Ser396Leu | p.S396L | P35367 | protein_coding | deleterious(0.03) | possibly_damaging(0.559) | TCGA-A6-6781-01 | Colorectum | colon adenocarcinoma | Male | <65 | III/IV | Chemotherapy | oxaliplatin | SD |
| HRH1 | SNV | Missense_Mutation | | c.469C>A | p.Leu157Met | p.L157M | P35367 | protein_coding | tolerated(0.59) | possibly_damaging(0.484) | TCGA-AA-A010-01 | Colorectum | colon adenocarcinoma | Female | <65 | I/II | Chemotherapy | folinic | CR |
| HRH1 | SNV | Missense_Mutation | rs370754604 | c.226N>A | p.Val76Met | p.V76M | P35367 | protein_coding | deleterious(0) | probably_damaging(0.998) | TCGA-AD-5900-01 | Colorectum | colon adenocarcinoma | Male | >=65 | I/II | Unknown | Unknown | SD |
| Entrez ID | Symbol | Category | Interaction Types | Drug Claim Name | Drug Name | PMIDs |
| 3269 | HRH1 | G PROTEIN COUPLED RECEPTOR, DRUGGABLE GENOME | antagonist | 135650208 | DOXEPIN | |
| 3269 | HRH1 | G PROTEIN COUPLED RECEPTOR, DRUGGABLE GENOME | | BROMODIPHENHYDRAMINE | BROMODIPHENHYDRAMINE | |
| 3269 | HRH1 | G PROTEIN COUPLED RECEPTOR, DRUGGABLE GENOME | | PHENIRAMINE | PHENIRAMINE | |
| 3269 | HRH1 | G PROTEIN COUPLED RECEPTOR, DRUGGABLE GENOME | antagonist | 135650867 | PYRILAMINE | |
| 3269 | HRH1 | G PROTEIN COUPLED RECEPTOR, DRUGGABLE GENOME | | Phenindamine | PHENINDAMINE | |
| 3269 | HRH1 | G PROTEIN COUPLED RECEPTOR, DRUGGABLE GENOME | | BIPERIDEN | BIPERIDEN | 22793499 |
| 3269 | HRH1 | G PROTEIN COUPLED RECEPTOR, DRUGGABLE GENOME | antagonist | 178103781 | KETOTIFEN | |
| 3269 | HRH1 | G PROTEIN COUPLED RECEPTOR, DRUGGABLE GENOME | antagonist | CHEMBL1201007 | HYDROXYZINE HYDROCHLORIDE | |
| 3269 | HRH1 | G PROTEIN COUPLED RECEPTOR, DRUGGABLE GENOME | antagonist | 135650435 | | |
| 3269 | HRH1 | G PROTEIN COUPLED RECEPTOR, DRUGGABLE GENOME | agonist | 135649684 | | |


