
|
|||||
|
 | |
| |
| |
| |
| |
| |
|
Gene: HRG |
Gene summary for HRG |
| Gene information | Species | Human | Gene symbol | HRG | Gene ID | 3273 |
| Gene name | histidine rich glycoprotein | |
| Gene Alias | HPRG | |
| Cytomap | 3q27.3 | |
| Gene Type | protein-coding | GO ID | GO:0000041 | UniProtAcc | P04196 |
Top |
Malignant transformation analysis |
| Identification of the aberrant gene expression in precancerous and cancerous lesions by comparing the gene expression of stem-like cells in diseased tissues with normal stem cells |
| Entrez ID | Symbol | Replicates | Species | Organ | Tissue | Adj P-value | Log2FC | Malignancy |
| 3273 | HRG | NAFLD1 | Human | Liver | NAFLD | 1.99e-09 | 5.12e-01 | -0.04 |
| 3273 | HRG | HCC1_Meng | Human | Liver | HCC | 8.59e-76 | 5.05e-01 | 0.0246 |
| 3273 | HRG | HCC2_Meng | Human | Liver | HCC | 5.01e-07 | -3.06e-01 | 0.0107 |
| 3273 | HRG | cirrhotic1 | Human | Liver | Cirrhotic | 1.02e-04 | -1.44e-01 | 0.0202 |
| 3273 | HRG | cirrhotic2 | Human | Liver | Cirrhotic | 6.58e-09 | -1.02e-01 | 0.0201 |
| 3273 | HRG | HCC1 | Human | Liver | HCC | 1.43e-40 | 4.39e+00 | 0.5336 |
| 3273 | HRG | HCC2 | Human | Liver | HCC | 2.69e-63 | 5.42e+00 | 0.5341 |
| 3273 | HRG | HCC5 | Human | Liver | HCC | 7.42e-03 | -1.24e-01 | 0.4932 |
| 3273 | HRG | Pt13.a | Human | Liver | HCC | 1.94e-02 | -1.05e-01 | 0.021 |
| 3273 | HRG | Pt13.b | Human | Liver | HCC | 2.36e-08 | -1.07e-01 | 0.0251 |
| 3273 | HRG | Pt14.b | Human | Liver | HCC | 4.02e-26 | 5.55e-01 | 0.018 |
| 3273 | HRG | Pt14.d | Human | Liver | HCC | 2.41e-30 | 6.56e-01 | 0.0143 |
| 3273 | HRG | S029 | Human | Liver | HCC | 9.01e-06 | 1.28e+00 | 0.2581 |
| Page: 1 |
| Tissue | Expression Dynamics | Abbreviation |
| Liver | 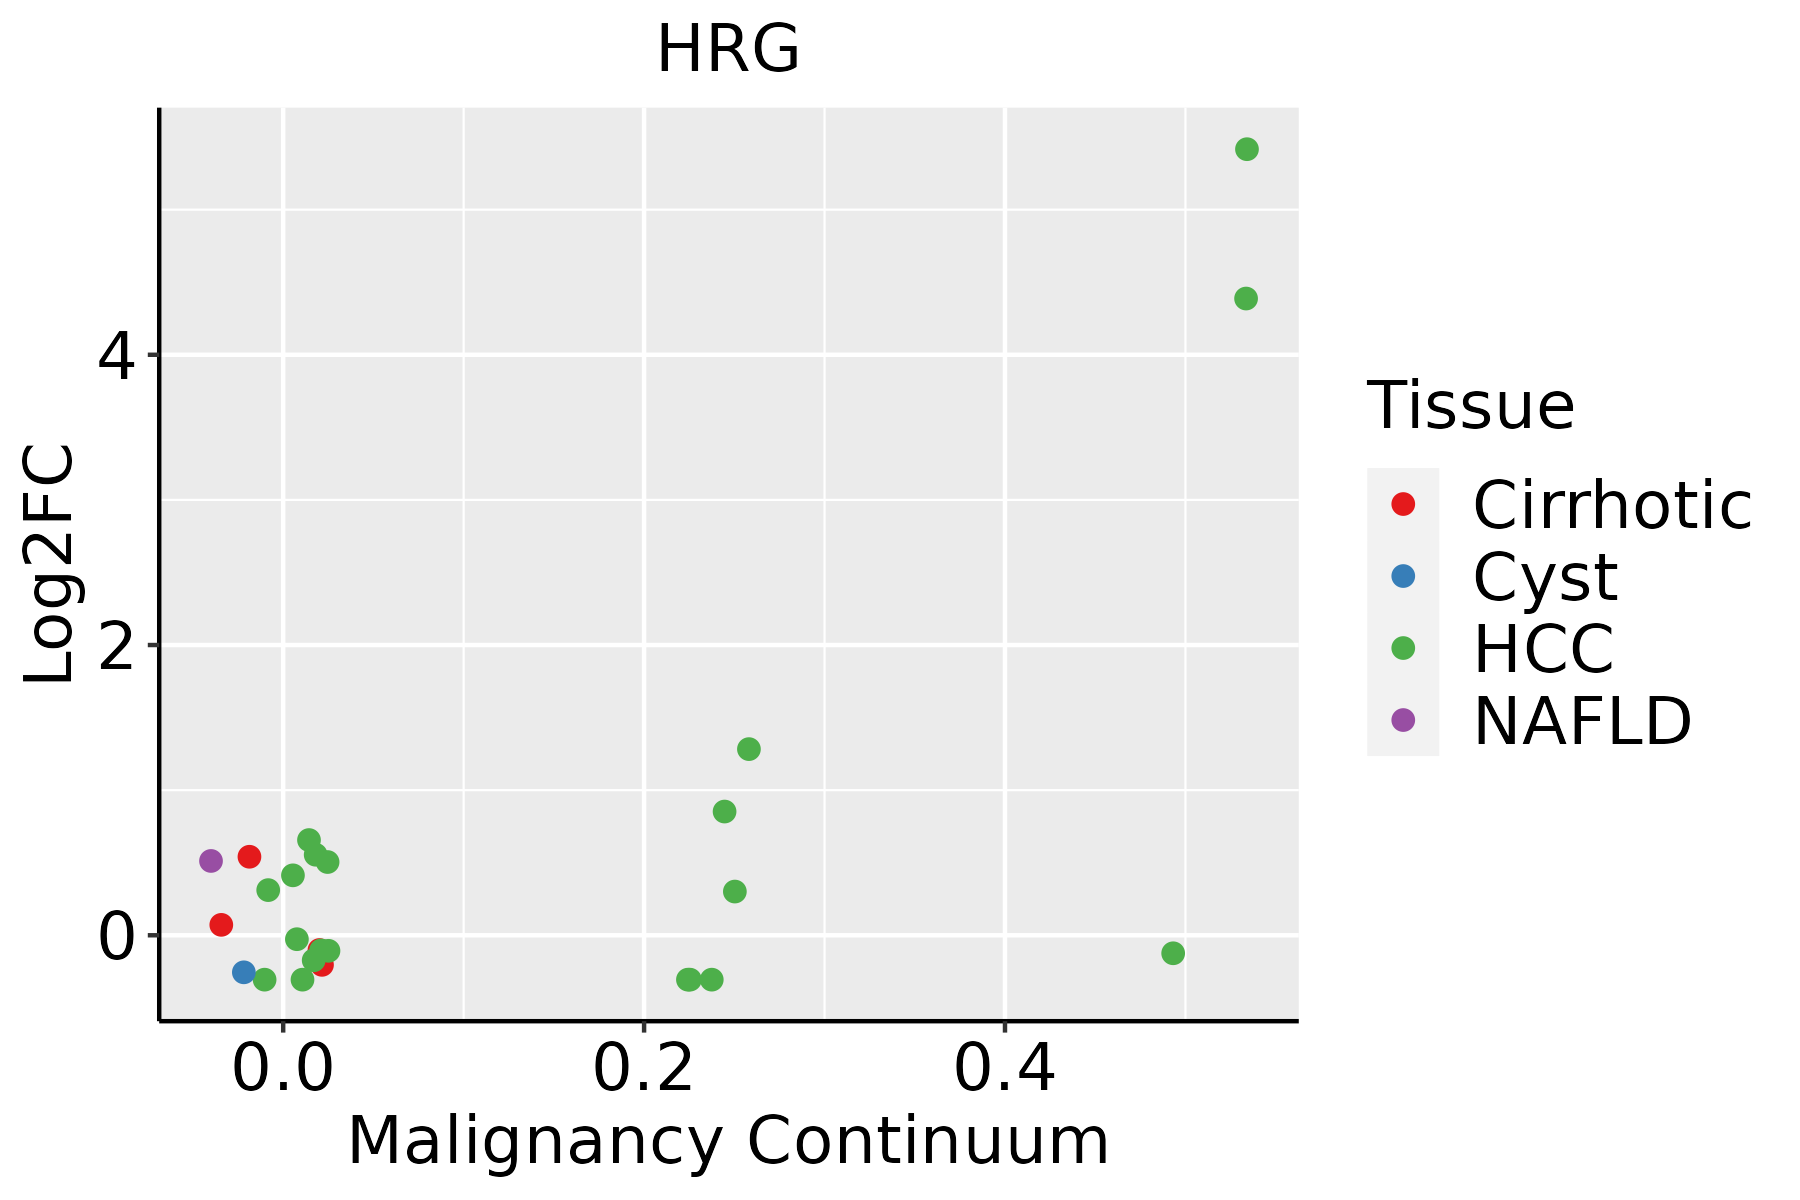 | HCC: Hepatocellular carcinoma |
| NAFLD: Non-alcoholic fatty liver disease |
| ∗log2FC in expression of this searched gene in stem-like cells from each diseased tissue sample relative to stem-like cells in normal samples in each tissue plotted against the malignancy continuum. Samples are colored based on if they are from different disease stage. |
Top |
Malignant transformation related pathway analysis |
| Find out the enriched GO biological processes and KEGG pathways involved in transition from healthy to precancer to cancer |
| Tissue | Disease Stage | Enriched GO biological Processes |
| Colorectum | AD |  |
| Colorectum | SER |  |
| Colorectum | MSS |  |
| Colorectum | MSI-H |  |
| Colorectum | FAP |  |
| ∗Top 15 enriched GO BP terms are showed in the bar plot of each disease state in each tissue. Each row represents a significant GO biological process which is colored according to the -log10(p.adjust). |
| Page: 1 2 3 4 5 6 7 8 9 |
| GO ID | Tissue | Disease Stage | Description | Gene Ratio | Bg Ratio | pvalue | p.adjust | Count |
| GO:00610417 | Liver | NAFLD | regulation of wound healing | 39/1882 | 134/18723 | 5.52e-10 | 1.28e-07 | 39 |
| GO:00420607 | Liver | NAFLD | wound healing | 84/1882 | 422/18723 | 6.56e-10 | 1.37e-07 | 84 |
| GO:0042730 | Liver | NAFLD | fibrinolysis | 15/1882 | 25/18723 | 1.26e-09 | 2.30e-07 | 15 |
| GO:0030195 | Liver | NAFLD | negative regulation of blood coagulation | 21/1882 | 49/18723 | 2.42e-09 | 4.05e-07 | 21 |
| GO:1900047 | Liver | NAFLD | negative regulation of hemostasis | 21/1882 | 50/18723 | 3.78e-09 | 5.40e-07 | 21 |
| GO:0030193 | Liver | NAFLD | regulation of blood coagulation | 24/1882 | 66/18723 | 9.30e-09 | 1.26e-06 | 24 |
| GO:0050819 | Liver | NAFLD | negative regulation of coagulation | 21/1882 | 53/18723 | 1.33e-08 | 1.69e-06 | 21 |
| GO:1900046 | Liver | NAFLD | regulation of hemostasis | 24/1882 | 68/18723 | 1.84e-08 | 2.09e-06 | 24 |
| GO:0061045 | Liver | NAFLD | negative regulation of wound healing | 26/1882 | 78/18723 | 1.86e-08 | 2.09e-06 | 26 |
| GO:00070446 | Liver | NAFLD | cell-substrate junction assembly | 29/1882 | 95/18723 | 2.71e-08 | 2.86e-06 | 29 |
| GO:01501156 | Liver | NAFLD | cell-substrate junction organization | 30/1882 | 101/18723 | 3.15e-08 | 3.23e-06 | 30 |
| GO:19030347 | Liver | NAFLD | regulation of response to wounding | 41/1882 | 167/18723 | 4.70e-08 | 4.58e-06 | 41 |
| GO:0050818 | Liver | NAFLD | regulation of coagulation | 24/1882 | 71/18723 | 4.80e-08 | 4.60e-06 | 24 |
| GO:00480415 | Liver | NAFLD | focal adhesion assembly | 27/1882 | 87/18723 | 5.52e-08 | 5.12e-06 | 27 |
| GO:0051917 | Liver | NAFLD | regulation of fibrinolysis | 10/1882 | 14/18723 | 7.05e-08 | 6.34e-06 | 10 |
| GO:00075994 | Liver | NAFLD | hemostasis | 49/1882 | 222/18723 | 9.23e-08 | 7.59e-06 | 49 |
| GO:00075964 | Liver | NAFLD | blood coagulation | 48/1882 | 217/18723 | 1.16e-07 | 8.81e-06 | 48 |
| GO:00160495 | Liver | NAFLD | cell growth | 85/1882 | 482/18723 | 1.75e-07 | 1.25e-05 | 85 |
| GO:00508174 | Liver | NAFLD | coagulation | 48/1882 | 222/18723 | 2.40e-07 | 1.61e-05 | 48 |
| GO:00458617 | Liver | NAFLD | negative regulation of proteolysis | 66/1882 | 351/18723 | 4.02e-07 | 2.58e-05 | 66 |
| Page: 1 2 3 4 5 6 7 8 9 10 |
| Pathway ID | Tissue | Disease Stage | Description | Gene Ratio | Bg Ratio | pvalue | p.adjust | qvalue | Count |
| Page: 1 |
Top |
Cell-cell communication analysis |
| Identification of potential cell-cell interactions between two cell types and their ligand-receptor pairs for different disease states |
| Ligand | Receptor | LRpair | Pathway | Tissue | Disease Stage |
| Page: 1 |
Top |
Single-cell gene regulatory network inference analysis |
| Find out the significant the regulons (TFs) and the target genes of each regulon across cell types for different disease states |
| TF | Cell Type | Tissue | Disease Stage | Target Gene | RSS | Regulon Activity |
| ∗The dot plots of a searched regulon are shown for all cell subpopulations in each disease state of each tissue based on the regulon specific score inferred using pySCENIC and by calculating the average expression. |
| Page: 1 |
Top |
Somatic mutation of malignant transformation related genes |
| Annotation of somatic variants for genes involved in malignant transformation |
| Hugo Symbol | Variant Class | Variant Classification | dbSNP RS | HGVSc | HGVSp | HGVSp Short | SWISSPROT | BIOTYPE | SIFT | PolyPhen | Tumor Sample Barcode | Tissue | Histology | Sex | Age | Stage | Therapy Types | Drugs | Outcome |
| HRG | SNV | Missense_Mutation | novel | c.554N>C | p.Arg185Thr | p.R185T | P04196 | protein_coding | deleterious(0.05) | possibly_damaging(0.781) | TCGA-AC-A23H-01 | Breast | breast invasive carcinoma | Female | >=65 | I/II | Unknown | Unknown | PD |
| HRG | SNV | Missense_Mutation | c.585N>A | p.Phe195Leu | p.F195L | P04196 | protein_coding | deleterious(0.02) | benign(0.04) | TCGA-AN-A046-01 | Breast | breast invasive carcinoma | Female | >=65 | I/II | Unknown | Unknown | SD | |
| HRG | SNV | Missense_Mutation | rs778212538 | c.154N>T | p.Arg52Trp | p.R52W | P04196 | protein_coding | deleterious(0.03) | benign(0.18) | TCGA-AN-A0AJ-01 | Breast | breast invasive carcinoma | Female | >=65 | I/II | Unknown | Unknown | SD |
| HRG | SNV | Missense_Mutation | rs539003389 | c.1294N>A | p.Gly432Ser | p.G432S | P04196 | protein_coding | tolerated_low_confidence(0.08) | possibly_damaging(0.762) | TCGA-BH-A0BR-01 | Breast | breast invasive carcinoma | Female | <65 | I/II | Unknown | Unknown | SD |
| HRG | SNV | Missense_Mutation | rs138389406 | c.541G>C | p.Glu181Gln | p.E181Q | P04196 | protein_coding | tolerated(0.05) | possibly_damaging(0.705) | TCGA-E2-A1LH-01 | Breast | breast invasive carcinoma | Female | <65 | I/II | Chemotherapy | adriamycin | SD |
| HRG | SNV | Missense_Mutation | novel | c.904N>C | p.Asp302His | p.D302H | P04196 | protein_coding | tolerated(0.15) | benign(0.367) | TCGA-LL-A5YL-01 | Breast | breast invasive carcinoma | Female | <65 | I/II | Chemotherapy | adriamycin | SD |
| HRG | SNV | Missense_Mutation | rs200206741 | c.1459N>G | p.His487Asp | p.H487D | P04196 | protein_coding | tolerated(0.31) | benign(0.035) | TCGA-OL-A5S0-01 | Breast | breast invasive carcinoma | Female | >=65 | I/II | Chemotherapy | taxol | CR |
| HRG | SNV | Missense_Mutation | novel | c.815N>T | p.Ser272Phe | p.S272F | P04196 | protein_coding | tolerated(0.46) | benign(0.015) | TCGA-C5-A8XK-01 | Cervix | cervical & endocervical cancer | Female | <65 | I/II | Chemotherapy | cisplatin | SD |
| HRG | SNV | Missense_Mutation | rs529521530 | c.1322N>A | p.Arg441Gln | p.R441Q | P04196 | protein_coding | tolerated_low_confidence(0.09) | benign(0.007) | TCGA-EK-A3GK-01 | Cervix | cervical & endocervical cancer | Female | <65 | I/II | Unknown | Unknown | SD |
| HRG | SNV | Missense_Mutation | c.1450N>T | p.His484Tyr | p.H484Y | P04196 | protein_coding | deleterious(0.03) | benign(0.062) | TCGA-A6-2686-01 | Colorectum | colon adenocarcinoma | Female | >=65 | I/II | Unknown | Unknown | SD |
| Page: 1 2 3 4 5 6 7 8 |
Top |
Related drugs of malignant transformation related genes |
| Identification of chemicals and drugs interact with genes involved in malignant transfromation |
| (DGIdb 4.0) |
| Entrez ID | Symbol | Category | Interaction Types | Drug Claim Name | Drug Name | PMIDs |
| Page: 1 |

Copyright 2023-Present -The University of Texas Health Science Center at Houston |