
|
|||||
|
 | |
| |
| |
| |
| |
| |
|
Gene: HPX |
Gene summary for HPX |
| Gene information | Species | Human | Gene symbol | HPX | Gene ID | 3263 |
| Gene name | hemopexin | |
| Gene Alias | HX | |
| Cytomap | 11p15.4 | |
| Gene Type | protein-coding | GO ID | GO:0000041 | UniProtAcc | P02790 |
Top |
Malignant transformation analysis |
| Identification of the aberrant gene expression in precancerous and cancerous lesions by comparing the gene expression of stem-like cells in diseased tissues with normal stem cells |
| Entrez ID | Symbol | Replicates | Species | Organ | Tissue | Adj P-value | Log2FC | Malignancy |
| 3263 | HPX | NAFLD1 | Human | Liver | NAFLD | 1.99e-13 | 1.09e+00 | -0.04 |
| 3263 | HPX | HCC1_Meng | Human | Liver | HCC | 5.31e-99 | 4.86e-01 | 0.0246 |
| 3263 | HPX | HCC2_Meng | Human | Liver | HCC | 3.86e-10 | -4.51e-01 | 0.0107 |
| 3263 | HPX | cirrhotic1 | Human | Liver | Cirrhotic | 5.39e-07 | -4.11e-01 | 0.0202 |
| 3263 | HPX | cirrhotic2 | Human | Liver | Cirrhotic | 1.96e-03 | -3.53e-01 | 0.0201 |
| 3263 | HPX | HCC1 | Human | Liver | HCC | 3.03e-16 | 4.62e+00 | 0.5336 |
| 3263 | HPX | HCC2 | Human | Liver | HCC | 6.05e-34 | 5.77e+00 | 0.5341 |
| 3263 | HPX | Pt13.a | Human | Liver | HCC | 1.33e-35 | 7.88e-01 | 0.021 |
| 3263 | HPX | Pt13.b | Human | Liver | HCC | 3.28e-60 | 7.89e-01 | 0.0251 |
| 3263 | HPX | Pt13.c | Human | Liver | HCC | 1.72e-20 | 9.46e-01 | 0.0076 |
| 3263 | HPX | Pt14.a | Human | Liver | HCC | 7.36e-16 | 6.78e-01 | 0.0169 |
| 3263 | HPX | Pt14.b | Human | Liver | HCC | 4.49e-05 | 1.49e-01 | 0.018 |
| 3263 | HPX | Pt14.d | Human | Liver | HCC | 1.74e-06 | 3.90e-01 | 0.0143 |
| 3263 | HPX | S015 | Human | Liver | HCC | 3.17e-02 | -2.11e-01 | 0.2375 |
| 3263 | HPX | S016 | Human | Liver | HCC | 1.51e-03 | -4.22e-01 | 0.2243 |
| 3263 | HPX | S028 | Human | Liver | HCC | 1.07e-07 | 9.20e-01 | 0.2503 |
| 3263 | HPX | S029 | Human | Liver | HCC | 3.74e-29 | 2.26e+00 | 0.2581 |
| Page: 1 |
| Tissue | Expression Dynamics | Abbreviation |
| Liver | 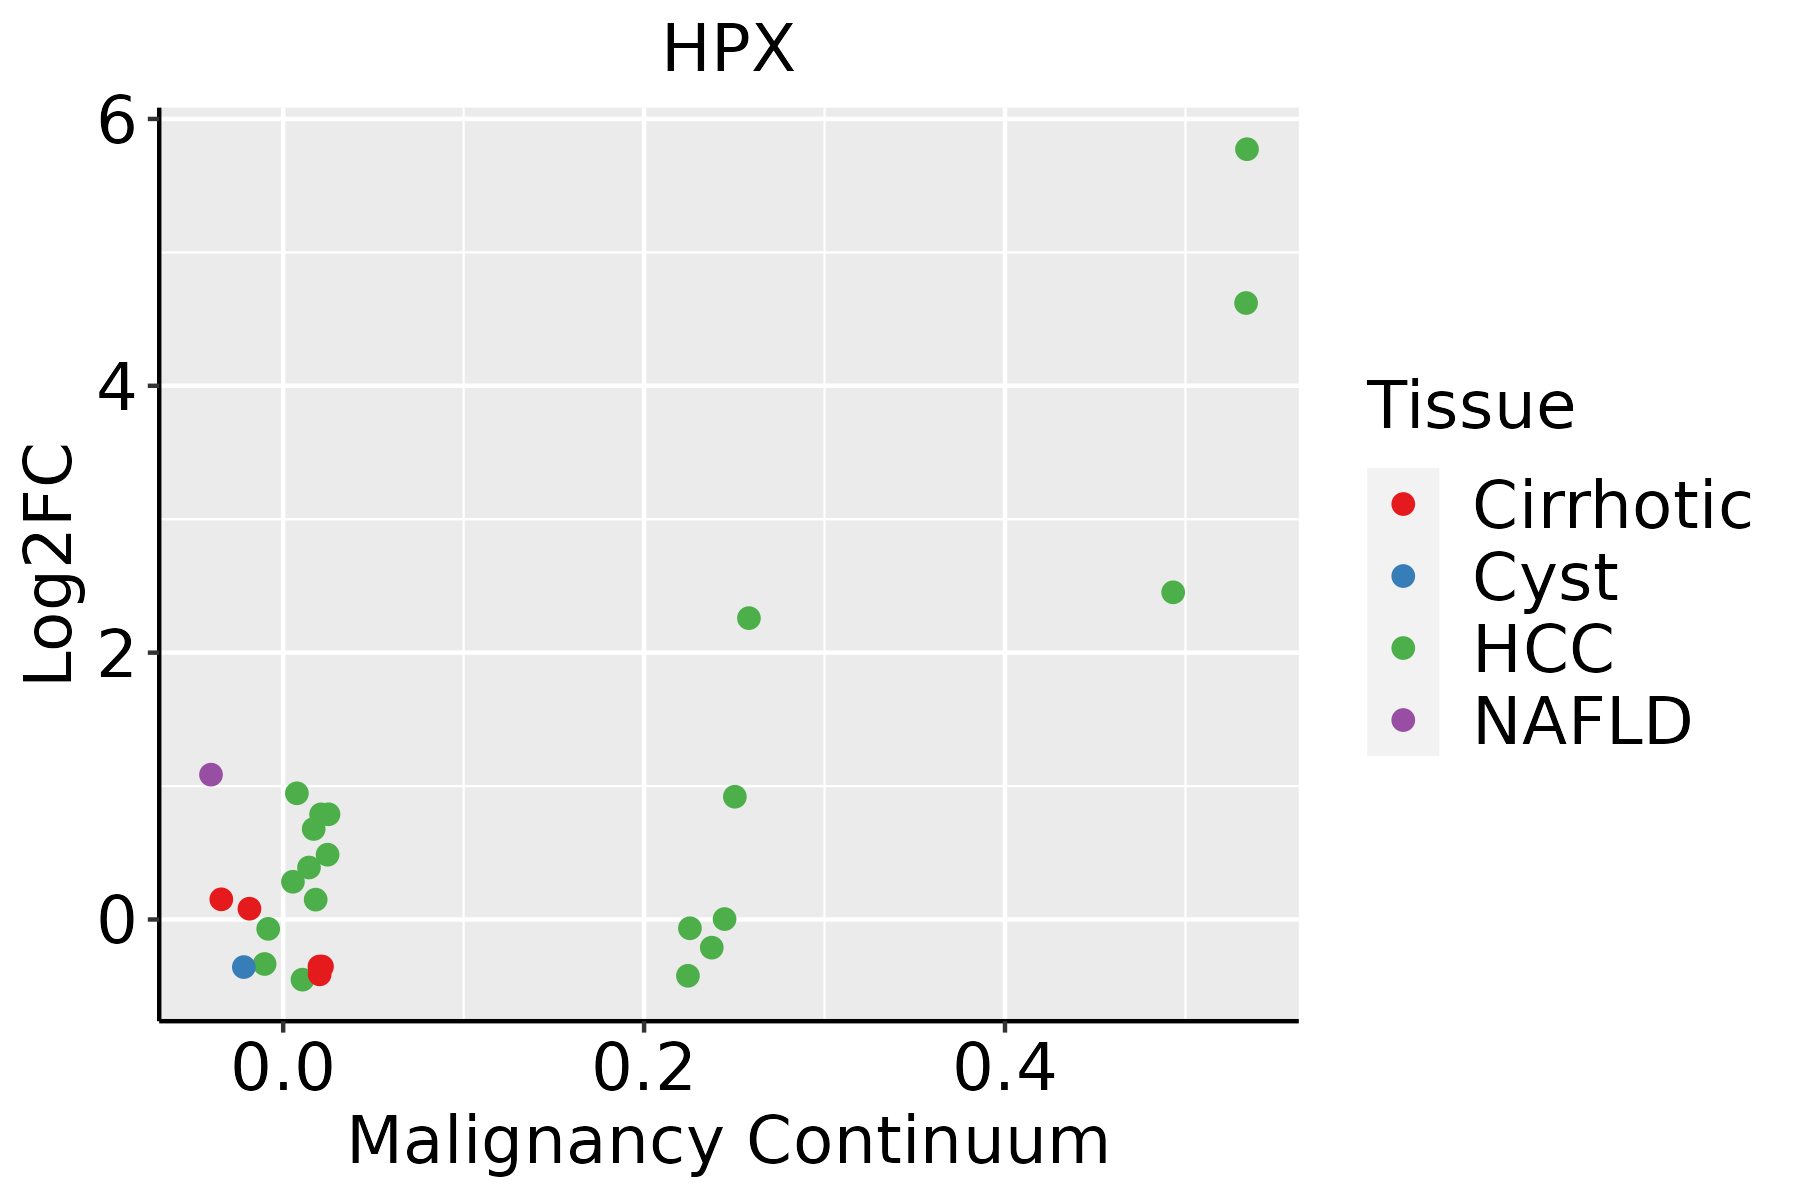 | HCC: Hepatocellular carcinoma |
| NAFLD: Non-alcoholic fatty liver disease |
| ∗log2FC in expression of this searched gene in stem-like cells from each diseased tissue sample relative to stem-like cells in normal samples in each tissue plotted against the malignancy continuum. Samples are colored based on if they are from different disease stage. |
Top |
Malignant transformation related pathway analysis |
| Find out the enriched GO biological processes and KEGG pathways involved in transition from healthy to precancer to cancer |
| Tissue | Disease Stage | Enriched GO biological Processes |
| Colorectum | AD |  |
| Colorectum | SER |  |
| Colorectum | MSS |  |
| Colorectum | MSI-H |  |
| Colorectum | FAP |  |
| ∗Top 15 enriched GO BP terms are showed in the bar plot of each disease state in each tissue. Each row represents a significant GO biological process which is colored according to the -log10(p.adjust). |
| Page: 1 2 3 4 5 6 7 8 9 |
| GO ID | Tissue | Disease Stage | Description | Gene Ratio | Bg Ratio | pvalue | p.adjust | Count |
| GO:00028313 | Liver | NAFLD | regulation of response to biotic stimulus | 49/1882 | 327/18723 | 2.94e-03 | 2.66e-02 | 49 |
| GO:0060330 | Liver | NAFLD | regulation of response to interferon-gamma | 6/1882 | 16/18723 | 3.37e-03 | 2.93e-02 | 6 |
| GO:0060334 | Liver | NAFLD | regulation of interferon-gamma-mediated signaling pathway | 6/1882 | 16/18723 | 3.37e-03 | 2.93e-02 | 6 |
| GO:00068262 | Liver | NAFLD | iron ion transport | 13/1882 | 58/18723 | 4.32e-03 | 3.55e-02 | 13 |
| GO:0045088 | Liver | NAFLD | regulation of innate immune response | 34/1882 | 218/18723 | 6.47e-03 | 4.69e-02 | 34 |
| GO:00343413 | Liver | Cirrhotic | response to interferon-gamma | 60/4634 | 141/18723 | 2.57e-06 | 4.63e-05 | 60 |
| GO:00550766 | Liver | Cirrhotic | transition metal ion homeostasis | 59/4634 | 138/18723 | 2.59e-06 | 4.65e-05 | 59 |
| GO:0071346 | Liver | Cirrhotic | cellular response to interferon-gamma | 49/4634 | 118/18723 | 4.43e-05 | 5.22e-04 | 49 |
| GO:00469164 | Liver | Cirrhotic | cellular transition metal ion homeostasis | 48/4634 | 115/18723 | 4.51e-05 | 5.30e-04 | 48 |
| GO:00603332 | Liver | Cirrhotic | interferon-gamma-mediated signaling pathway | 16/4634 | 27/18723 | 1.41e-04 | 1.36e-03 | 16 |
| GO:00550724 | Liver | Cirrhotic | iron ion homeostasis | 35/4634 | 85/18723 | 6.22e-04 | 4.79e-03 | 35 |
| GO:00321032 | Liver | Cirrhotic | positive regulation of response to external stimulus | 131/4634 | 427/18723 | 2.90e-03 | 1.66e-02 | 131 |
| GO:0033013 | Liver | Cirrhotic | tetrapyrrole metabolic process | 24/4634 | 59/18723 | 5.06e-03 | 2.62e-02 | 24 |
| GO:00028311 | Liver | Cirrhotic | regulation of response to biotic stimulus | 101/4634 | 327/18723 | 6.58e-03 | 3.25e-02 | 101 |
| GO:00603301 | Liver | Cirrhotic | regulation of response to interferon-gamma | 9/4634 | 16/18723 | 6.94e-03 | 3.38e-02 | 9 |
| GO:00603341 | Liver | Cirrhotic | regulation of interferon-gamma-mediated signaling pathway | 9/4634 | 16/18723 | 6.94e-03 | 3.38e-02 | 9 |
| GO:00068792 | Liver | Cirrhotic | cellular iron ion homeostasis | 26/4634 | 67/18723 | 7.53e-03 | 3.57e-02 | 26 |
| GO:0006778 | Liver | Cirrhotic | porphyrin-containing compound metabolic process | 20/4634 | 49/18723 | 9.60e-03 | 4.35e-02 | 20 |
| GO:00028312 | Liver | HCC | regulation of response to biotic stimulus | 173/7958 | 327/18723 | 8.55e-05 | 7.48e-04 | 173 |
| GO:005507612 | Liver | HCC | transition metal ion homeostasis | 81/7958 | 138/18723 | 8.87e-05 | 7.72e-04 | 81 |
| Page: 1 2 |
| Pathway ID | Tissue | Disease Stage | Description | Gene Ratio | Bg Ratio | pvalue | p.adjust | qvalue | Count |
| Page: 1 |
Top |
Cell-cell communication analysis |
| Identification of potential cell-cell interactions between two cell types and their ligand-receptor pairs for different disease states |
| Ligand | Receptor | LRpair | Pathway | Tissue | Disease Stage |
| Page: 1 |
Top |
Single-cell gene regulatory network inference analysis |
| Find out the significant the regulons (TFs) and the target genes of each regulon across cell types for different disease states |
| TF | Cell Type | Tissue | Disease Stage | Target Gene | RSS | Regulon Activity |
| ∗The dot plots of a searched regulon are shown for all cell subpopulations in each disease state of each tissue based on the regulon specific score inferred using pySCENIC and by calculating the average expression. |
| Page: 1 |
Top |
Somatic mutation of malignant transformation related genes |
| Annotation of somatic variants for genes involved in malignant transformation |
| Hugo Symbol | Variant Class | Variant Classification | dbSNP RS | HGVSc | HGVSp | HGVSp Short | SWISSPROT | BIOTYPE | SIFT | PolyPhen | Tumor Sample Barcode | Tissue | Histology | Sex | Age | Stage | Therapy Types | Drugs | Outcome |
| HPX | SNV | Missense_Mutation | rs770220351 | c.1346N>T | p.Pro449Leu | p.P449L | P02790 | protein_coding | deleterious(0.02) | possibly_damaging(0.809) | TCGA-AN-A046-01 | Breast | breast invasive carcinoma | Female | >=65 | I/II | Unknown | Unknown | SD |
| HPX | SNV | Missense_Mutation | rs573615393 | c.136N>A | p.Val46Met | p.V46M | P02790 | protein_coding | tolerated(0.13) | benign(0.015) | TCGA-AO-A128-01 | Breast | breast invasive carcinoma | Female | <65 | I/II | Chemotherapy | doxorubicin | SD |
| HPX | SNV | Missense_Mutation | c.569N>T | p.Ser190Phe | p.S190F | P02790 | protein_coding | deleterious(0) | probably_damaging(0.992) | TCGA-GM-A2D9-01 | Breast | breast invasive carcinoma | Female | >=65 | I/II | Hormone Therapy | arimidex | SD | |
| HPX | SNV | Missense_Mutation | c.1088N>T | p.Ala363Val | p.A363V | P02790 | protein_coding | deleterious(0) | possibly_damaging(0.514) | TCGA-MY-A5BD-01 | Cervix | cervical & endocervical cancer | Female | <65 | I/II | Chemotherapy | cisplatin | CR | |
| HPX | SNV | Missense_Mutation | rs142045379 | c.1031N>A | p.Arg344Gln | p.R344Q | P02790 | protein_coding | tolerated(0.46) | benign(0.007) | TCGA-AA-3715-01 | Colorectum | colon adenocarcinoma | Male | >=65 | I/II | Unknown | Unknown | PD |
| HPX | SNV | Missense_Mutation | novel | c.688C>T | p.Pro230Ser | p.P230S | P02790 | protein_coding | tolerated(0.98) | benign(0.003) | TCGA-AA-A00N-01 | Colorectum | colon adenocarcinoma | Male | >=65 | I/II | Unknown | Unknown | PD |
| HPX | SNV | Missense_Mutation | rs756730036 | c.949N>G | p.Lys317Glu | p.K317E | P02790 | protein_coding | deleterious(0.01) | probably_damaging(0.993) | TCGA-CA-6717-01 | Colorectum | colon adenocarcinoma | Male | <65 | I/II | Chemotherapy | oxaliplatin | CR |
| HPX | SNV | Missense_Mutation | novel | c.375N>T | p.Glu125Asp | p.E125D | P02790 | protein_coding | deleterious(0.04) | benign(0.323) | TCGA-CA-6717-01 | Colorectum | colon adenocarcinoma | Male | <65 | I/II | Chemotherapy | oxaliplatin | CR |
| HPX | deletion | Frame_Shift_Del | c.210delN | p.Phe70LeufsTer16 | p.F70Lfs*16 | P02790 | protein_coding | TCGA-F4-6570-01 | Colorectum | colon adenocarcinoma | Female | >=65 | I/II | Unknown | Unknown | SD | |||
| HPX | deletion | Frame_Shift_Del | c.210delT | p.Phe70LeufsTer16 | p.F70Lfs*16 | P02790 | protein_coding | TCGA-G4-6628-01 | Colorectum | colon adenocarcinoma | Male | >=65 | I/II | Unknown | Unknown | SD |
| Page: 1 2 3 4 5 6 |
Top |
Related drugs of malignant transformation related genes |
| Identification of chemicals and drugs interact with genes involved in malignant transfromation |
| (DGIdb 4.0) |
| Entrez ID | Symbol | Category | Interaction Types | Drug Claim Name | Drug Name | PMIDs |
| Page: 1 |

Copyright 2023-Present -The University of Texas Health Science Center at Houston |