
|
|||||
|
 | |
| |
| |
| |
| |
| |
|
Gene: HPSE |
Gene summary for HPSE |
| Gene information | Species | Human | Gene symbol | HPSE | Gene ID | 10855 |
| Gene name | heparanase | |
| Gene Alias | HPA | |
| Cytomap | 4q21.23 | |
| Gene Type | protein-coding | GO ID | GO:0001525 | UniProtAcc | Q9Y251 |
Top |
Malignant transformation analysis |
| Identification of the aberrant gene expression in precancerous and cancerous lesions by comparing the gene expression of stem-like cells in diseased tissues with normal stem cells |
| Entrez ID | Symbol | Replicates | Species | Organ | Tissue | Adj P-value | Log2FC | Malignancy |
| 10855 | HPSE | P4T-E | Human | Esophagus | ESCC | 6.23e-09 | 2.25e-01 | 0.1323 |
| 10855 | HPSE | P8T-E | Human | Esophagus | ESCC | 5.96e-04 | 1.75e-02 | 0.0889 |
| 10855 | HPSE | P9T-E | Human | Esophagus | ESCC | 1.34e-03 | 1.27e-01 | 0.1131 |
| 10855 | HPSE | P10T-E | Human | Esophagus | ESCC | 1.68e-12 | 1.77e-01 | 0.116 |
| 10855 | HPSE | P12T-E | Human | Esophagus | ESCC | 1.40e-15 | 2.48e-01 | 0.1122 |
| 10855 | HPSE | P15T-E | Human | Esophagus | ESCC | 2.57e-06 | 1.57e-01 | 0.1149 |
| 10855 | HPSE | P21T-E | Human | Esophagus | ESCC | 2.11e-06 | 1.69e-01 | 0.1617 |
| 10855 | HPSE | P26T-E | Human | Esophagus | ESCC | 4.42e-10 | 2.64e-01 | 0.1276 |
| 10855 | HPSE | P27T-E | Human | Esophagus | ESCC | 7.96e-03 | 3.53e-02 | 0.1055 |
| 10855 | HPSE | P28T-E | Human | Esophagus | ESCC | 1.57e-23 | 5.26e-01 | 0.1149 |
| 10855 | HPSE | P30T-E | Human | Esophagus | ESCC | 1.45e-10 | 4.37e-01 | 0.137 |
| 10855 | HPSE | P31T-E | Human | Esophagus | ESCC | 6.65e-06 | 2.05e-01 | 0.1251 |
| 10855 | HPSE | P32T-E | Human | Esophagus | ESCC | 2.96e-07 | 1.72e-01 | 0.1666 |
| 10855 | HPSE | P37T-E | Human | Esophagus | ESCC | 3.38e-07 | 1.73e-01 | 0.1371 |
| 10855 | HPSE | P39T-E | Human | Esophagus | ESCC | 7.43e-08 | 2.20e-01 | 0.0894 |
| 10855 | HPSE | P42T-E | Human | Esophagus | ESCC | 7.42e-04 | 1.99e-01 | 0.1175 |
| 10855 | HPSE | P48T-E | Human | Esophagus | ESCC | 9.81e-03 | 2.08e-02 | 0.0959 |
| 10855 | HPSE | P49T-E | Human | Esophagus | ESCC | 1.13e-07 | 1.10e+00 | 0.1768 |
| 10855 | HPSE | P52T-E | Human | Esophagus | ESCC | 1.89e-03 | 1.42e-01 | 0.1555 |
| 10855 | HPSE | P54T-E | Human | Esophagus | ESCC | 8.10e-05 | 5.26e-02 | 0.0975 |
| Page: 1 2 |
| Tissue | Expression Dynamics | Abbreviation |
| Esophagus | 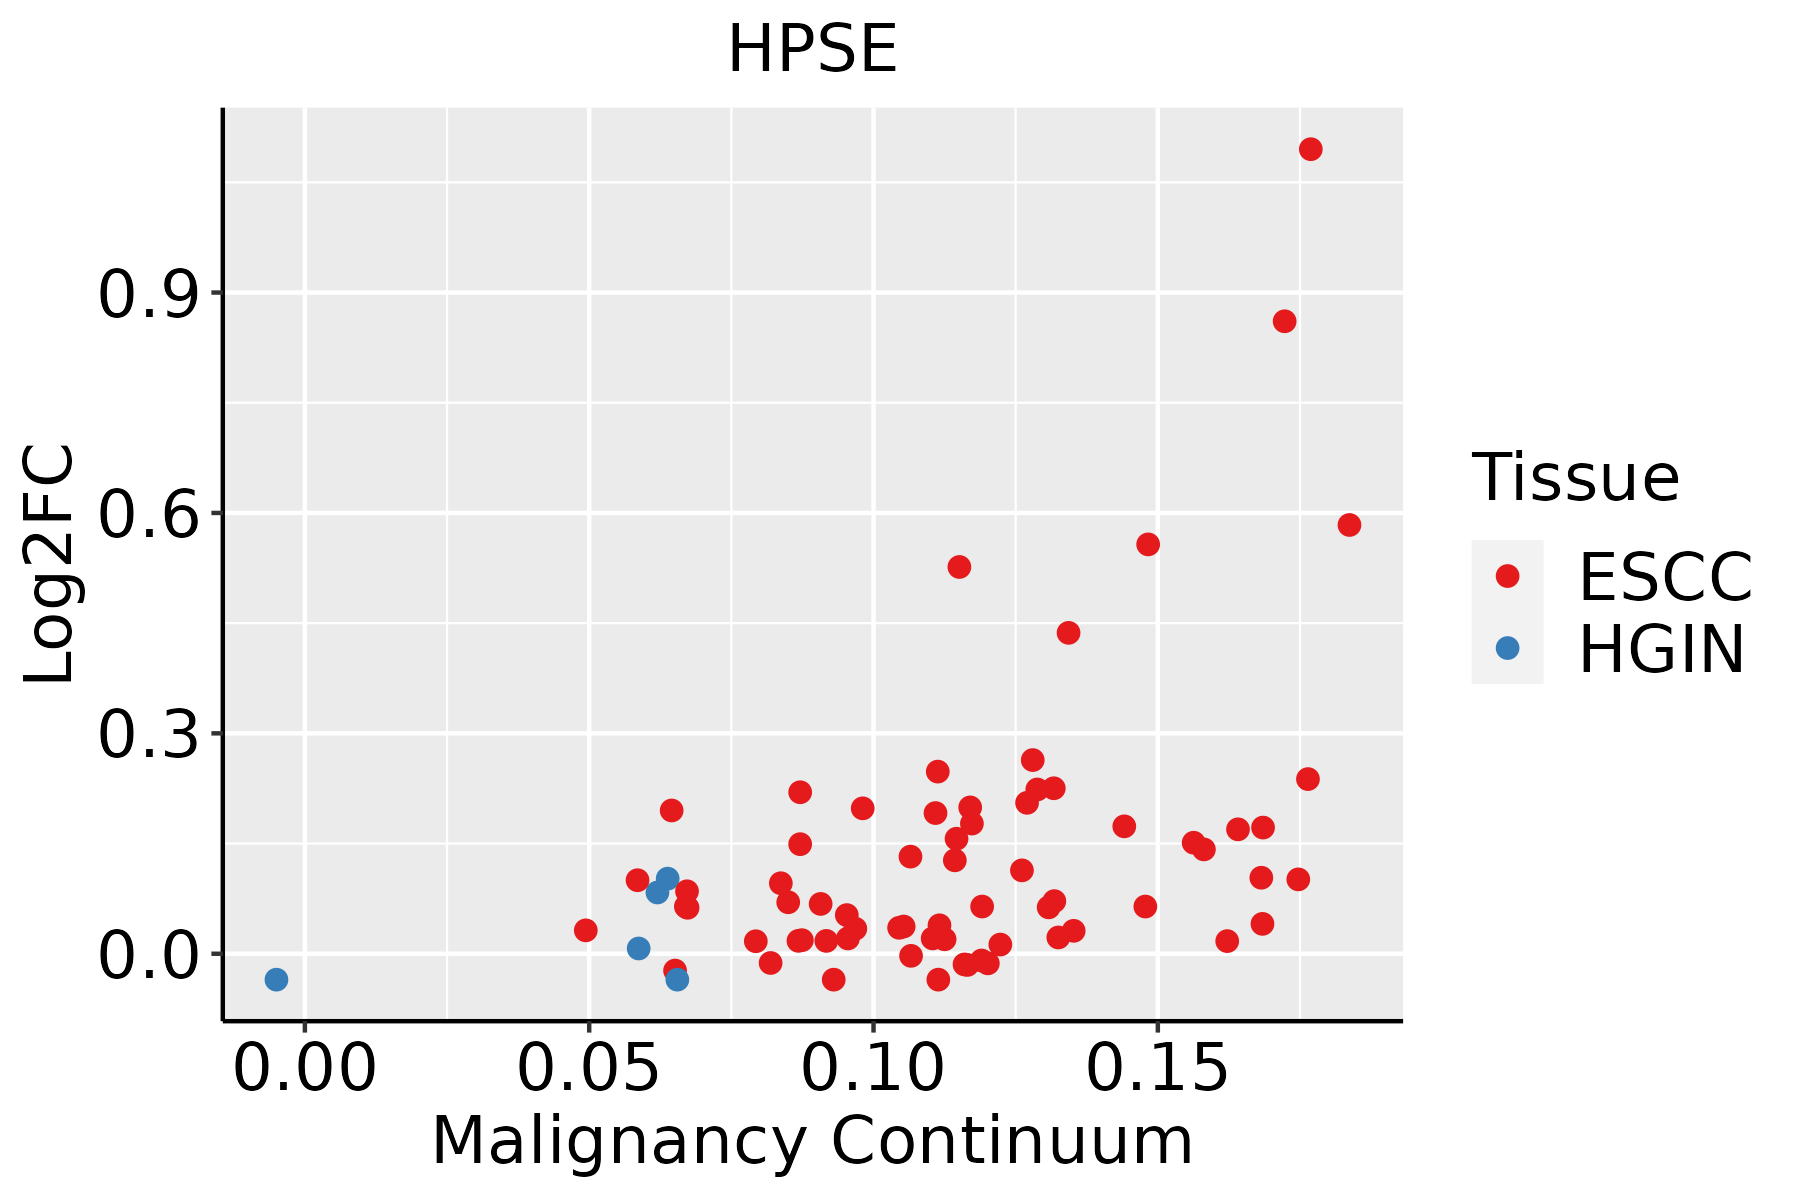 | ESCC: Esophageal squamous cell carcinoma |
| HGIN: High-grade intraepithelial neoplasias | ||
| LGIN: Low-grade intraepithelial neoplasias | ||
| Liver | 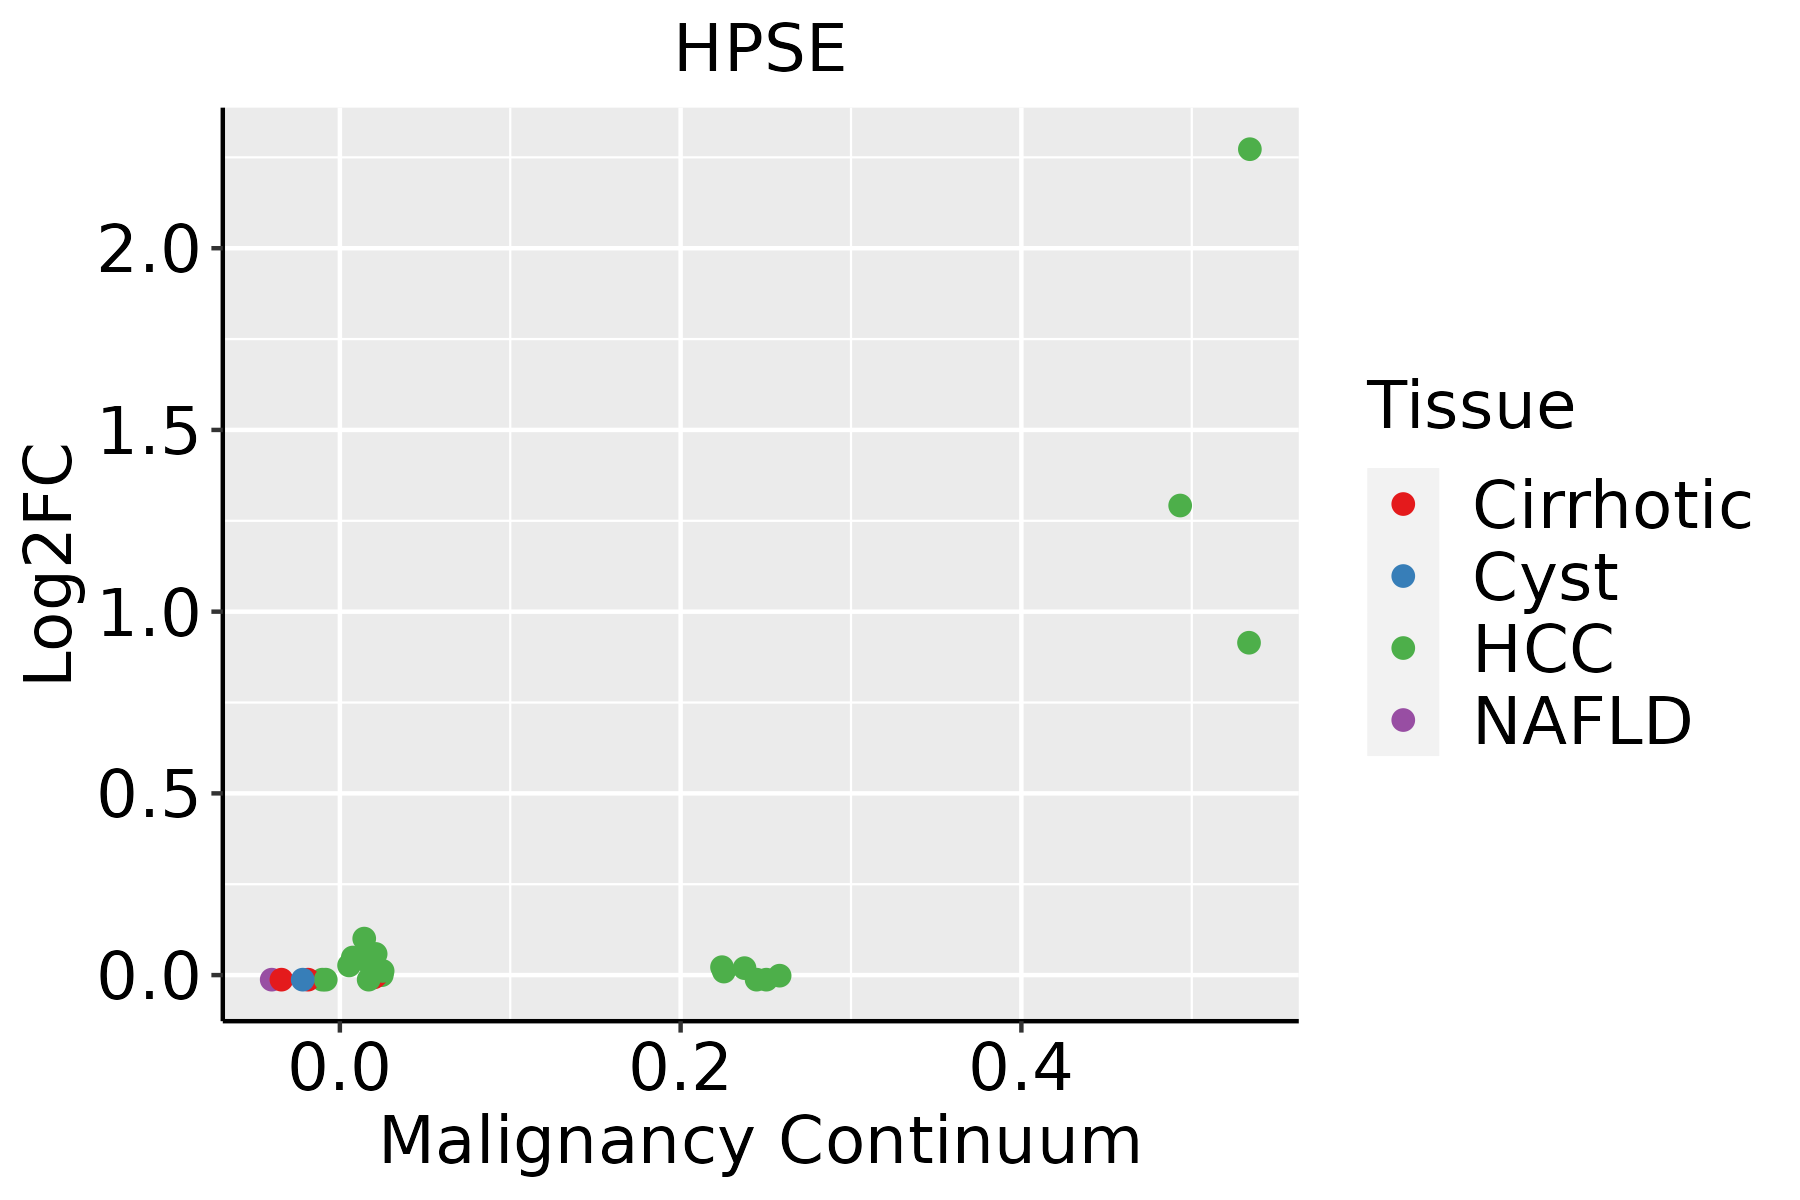 | HCC: Hepatocellular carcinoma |
| NAFLD: Non-alcoholic fatty liver disease |
| ∗log2FC in expression of this searched gene in stem-like cells from each diseased tissue sample relative to stem-like cells in normal samples in each tissue plotted against the malignancy continuum. Samples are colored based on if they are from different disease stage. |
Top |
Malignant transformation related pathway analysis |
| Find out the enriched GO biological processes and KEGG pathways involved in transition from healthy to precancer to cancer |
| Tissue | Disease Stage | Enriched GO biological Processes |
| Colorectum | AD |  |
| Colorectum | SER |  |
| Colorectum | MSS |  |
| Colorectum | MSI-H |  |
| Colorectum | FAP |  |
| ∗Top 15 enriched GO BP terms are showed in the bar plot of each disease state in each tissue. Each row represents a significant GO biological process which is colored according to the -log10(p.adjust). |
| Page: 1 2 3 4 5 6 7 8 9 |
| GO ID | Tissue | Disease Stage | Description | Gene Ratio | Bg Ratio | pvalue | p.adjust | Count |
| GO:003158919 | Esophagus | ESCC | cell-substrate adhesion | 221/8552 | 363/18723 | 3.06e-09 | 6.62e-08 | 221 |
| GO:00435888 | Esophagus | ESCC | skin development | 163/8552 | 263/18723 | 6.48e-08 | 1.14e-06 | 163 |
| GO:00091002 | Esophagus | ESCC | glycoprotein metabolic process | 226/8552 | 387/18723 | 2.64e-07 | 3.94e-06 | 226 |
| GO:000854410 | Esophagus | ESCC | epidermis development | 193/8552 | 324/18723 | 2.87e-07 | 4.19e-06 | 193 |
| GO:004206027 | Esophagus | ESCC | wound healing | 243/8552 | 422/18723 | 4.62e-07 | 6.25e-06 | 243 |
| GO:000716018 | Esophagus | ESCC | cell-matrix adhesion | 141/8552 | 233/18723 | 3.33e-06 | 3.71e-05 | 141 |
| GO:00224043 | Esophagus | ESCC | molting cycle process | 53/8552 | 84/18723 | 9.62e-04 | 4.88e-03 | 53 |
| GO:00224053 | Esophagus | ESCC | hair cycle process | 53/8552 | 84/18723 | 9.62e-04 | 4.88e-03 | 53 |
| GO:19011362 | Esophagus | ESCC | carbohydrate derivative catabolic process | 99/8552 | 172/18723 | 1.11e-03 | 5.54e-03 | 99 |
| GO:0001942 | Esophagus | ESCC | hair follicle development | 51/8552 | 81/18723 | 1.27e-03 | 6.14e-03 | 51 |
| GO:0098773 | Esophagus | ESCC | skin epidermis development | 53/8552 | 85/18723 | 1.43e-03 | 6.77e-03 | 53 |
| GO:00423033 | Esophagus | ESCC | molting cycle | 64/8552 | 107/18723 | 2.24e-03 | 9.85e-03 | 64 |
| GO:00426333 | Esophagus | ESCC | hair cycle | 64/8552 | 107/18723 | 2.24e-03 | 9.85e-03 | 64 |
| GO:000181916 | Esophagus | ESCC | positive regulation of cytokine production | 244/8552 | 467/18723 | 2.29e-03 | 1.01e-02 | 244 |
| GO:0006029 | Esophagus | ESCC | proteoglycan metabolic process | 48/8552 | 79/18723 | 4.93e-03 | 1.89e-02 | 48 |
| GO:190303420 | Esophagus | ESCC | regulation of response to wounding | 93/8552 | 167/18723 | 5.77e-03 | 2.14e-02 | 93 |
| GO:0030201 | Esophagus | ESCC | heparan sulfate proteoglycan metabolic process | 21/8552 | 31/18723 | 1.10e-02 | 3.70e-02 | 21 |
| GO:190303617 | Esophagus | ESCC | positive regulation of response to wounding | 43/8552 | 72/18723 | 1.14e-02 | 3.84e-02 | 43 |
| GO:009030310 | Esophagus | ESCC | positive regulation of wound healing | 36/8552 | 59/18723 | 1.27e-02 | 4.21e-02 | 36 |
| GO:0006516 | Esophagus | ESCC | glycoprotein catabolic process | 19/8552 | 28/18723 | 1.49e-02 | 4.84e-02 | 19 |
| Page: 1 2 |
| Pathway ID | Tissue | Disease Stage | Description | Gene Ratio | Bg Ratio | pvalue | p.adjust | qvalue | Count |
| hsa0520529 | Esophagus | ESCC | Proteoglycans in cancer | 138/4205 | 205/8465 | 1.79e-07 | 1.40e-06 | 7.15e-07 | 138 |
| hsa0520537 | Esophagus | ESCC | Proteoglycans in cancer | 138/4205 | 205/8465 | 1.79e-07 | 1.40e-06 | 7.15e-07 | 138 |
| hsa0520521 | Liver | HCC | Proteoglycans in cancer | 121/4020 | 205/8465 | 5.22e-04 | 2.18e-03 | 1.21e-03 | 121 |
| hsa0520531 | Liver | HCC | Proteoglycans in cancer | 121/4020 | 205/8465 | 5.22e-04 | 2.18e-03 | 1.21e-03 | 121 |
| Page: 1 |
Top |
Cell-cell communication analysis |
| Identification of potential cell-cell interactions between two cell types and their ligand-receptor pairs for different disease states |
| Ligand | Receptor | LRpair | Pathway | Tissue | Disease Stage |
| Page: 1 |
Top |
Single-cell gene regulatory network inference analysis |
| Find out the significant the regulons (TFs) and the target genes of each regulon across cell types for different disease states |
| TF | Cell Type | Tissue | Disease Stage | Target Gene | RSS | Regulon Activity |
| ∗The dot plots of a searched regulon are shown for all cell subpopulations in each disease state of each tissue based on the regulon specific score inferred using pySCENIC and by calculating the average expression. |
| Page: 1 |
Top |
Somatic mutation of malignant transformation related genes |
| Annotation of somatic variants for genes involved in malignant transformation |
| Hugo Symbol | Variant Class | Variant Classification | dbSNP RS | HGVSc | HGVSp | HGVSp Short | SWISSPROT | BIOTYPE | SIFT | PolyPhen | Tumor Sample Barcode | Tissue | Histology | Sex | Age | Stage | Therapy Types | Drugs | Outcome |
| HPSE | SNV | Missense_Mutation | novel | c.10N>A | p.Arg4Ser | p.R4S | Q9Y251 | protein_coding | deleterious_low_confidence(0) | benign(0.003) | TCGA-A2-A0CM-01 | Breast | breast invasive carcinoma | Female | <65 | I/II | Chemotherapy | adriamycin | PD |
| HPSE | SNV | Missense_Mutation | novel | c.124G>A | p.Asp42Asn | p.D42N | Q9Y251 | protein_coding | tolerated(0.08) | benign(0.003) | TCGA-AN-A046-01 | Breast | breast invasive carcinoma | Female | >=65 | I/II | Unknown | Unknown | SD |
| HPSE | SNV | Missense_Mutation | c.1142N>A | p.Met381Lys | p.M381K | Q9Y251 | protein_coding | deleterious(0) | possibly_damaging(0.626) | TCGA-B6-A0I8-01 | Breast | breast invasive carcinoma | Female | <65 | I/II | Unknown | Unknown | PD | |
| HPSE | SNV | Missense_Mutation | rs764330453 | c.558N>A | p.Phe186Leu | p.F186L | Q9Y251 | protein_coding | tolerated(0.07) | probably_damaging(0.999) | TCGA-E2-A14N-01 | Breast | breast invasive carcinoma | Female | <65 | I/II | Chemotherapy | cyclophosphamide | SD |
| HPSE | insertion | Nonsense_Mutation | novel | c.1299_1300insCTTGCGGTTACCCTATCCTTTTTCTAACAAGCAAGT | p.Val433_Tyr434insLeuAlaValThrLeuSerPhePheTerGlnAlaSer | p.V433_Y434insLAVTLSFF*QAS | Q9Y251 | protein_coding | TCGA-B6-A0IN-01 | Breast | breast invasive carcinoma | Female | <65 | I/II | Unknown | Unknown | PD | ||
| HPSE | SNV | Missense_Mutation | novel | c.1492C>G | p.Leu498Val | p.L498V | Q9Y251 | protein_coding | deleterious(0.03) | benign(0.041) | TCGA-DG-A2KK-01 | Cervix | cervical & endocervical cancer | Female | <65 | III/IV | Chemotherapy | cisplatin | SD |
| HPSE | SNV | Missense_Mutation | c.275N>C | p.Leu92Pro | p.L92P | Q9Y251 | protein_coding | deleterious(0.02) | probably_damaging(0.999) | TCGA-VS-A9UJ-01 | Cervix | cervical & endocervical cancer | Female | <65 | I/II | Unknown | Unknown | PD | |
| HPSE | SNV | Missense_Mutation | c.1055N>T | p.Ala352Val | p.A352V | Q9Y251 | protein_coding | deleterious(0.02) | probably_damaging(0.993) | TCGA-AA-3864-01 | Colorectum | colon adenocarcinoma | Male | >=65 | I/II | Unknown | Unknown | SD | |
| HPSE | SNV | Missense_Mutation | c.748N>A | p.His250Asn | p.H250N | Q9Y251 | protein_coding | deleterious(0.01) | possibly_damaging(0.609) | TCGA-AA-A010-01 | Colorectum | colon adenocarcinoma | Female | <65 | I/II | Chemotherapy | folinic | CR | |
| HPSE | SNV | Missense_Mutation | c.992A>G | p.Glu331Gly | p.E331G | Q9Y251 | protein_coding | tolerated(0.22) | benign(0.022) | TCGA-AD-6889-01 | Colorectum | colon adenocarcinoma | Male | >=65 | I/II | Chemotherapy | xeloda | PD |
| Page: 1 2 3 4 5 6 7 8 |
Top |
Related drugs of malignant transformation related genes |
| Identification of chemicals and drugs interact with genes involved in malignant transfromation |
| (DGIdb 4.0) |
| Entrez ID | Symbol | Category | Interaction Types | Drug Claim Name | Drug Name | PMIDs |
| 10855 | HPSE | ENZYME, DRUGGABLE GENOME | TGF | 16320243 | ||
| 10855 | HPSE | ENZYME, DRUGGABLE GENOME | inhibitor | CHEMBL1615835 | MUPARFOSTAT | |
| 10855 | HPSE | ENZYME, DRUGGABLE GENOME | ANTIESTROGEN | 14695198 | ||
| 10855 | HPSE | ENZYME, DRUGGABLE GENOME | 2-O, 3-O DESULFATED HEPARIN | |||
| 10855 | HPSE | ENZYME, DRUGGABLE GENOME | ASTEMIZOLE | ASTEMIZOLE | 23415087 | |
| 10855 | HPSE | ENZYME, DRUGGABLE GENOME | LABETALOL | LABETALOL | 23415087 | |
| 10855 | HPSE | ENZYME, DRUGGABLE GENOME | REL-CISAPRIDE | REL-CISAPRIDE | 23415087 | |
| 10855 | HPSE | ENZYME, DRUGGABLE GENOME | NARINGIN | NARINGIN | 23415087 | |
| 10855 | HPSE | ENZYME, DRUGGABLE GENOME | inhibitor | 363894164 | ||
| 10855 | HPSE | ENZYME, DRUGGABLE GENOME | HESPERIDIN | HESPERIDIN | 23415087 |
| Page: 1 2 3 |

Copyright 2023-Present -The University of Texas Health Science Center at Houston |