
|
|||||
|
 | |
| |
| |
| |
| |
| |
|
Gene: HPS5 |
Gene summary for HPS5 |
| Gene information | Species | Human | Gene symbol | HPS5 | Gene ID | 11234 |
| Gene name | HPS5 biogenesis of lysosomal organelles complex 2 subunit 2 | |
| Gene Alias | AIBP63 | |
| Cytomap | 11p15.1 | |
| Gene Type | protein-coding | GO ID | GO:0006950 | UniProtAcc | Q9UPZ3 |
Top |
Malignant transformation analysis |
| Identification of the aberrant gene expression in precancerous and cancerous lesions by comparing the gene expression of stem-like cells in diseased tissues with normal stem cells |
| Entrez ID | Symbol | Replicates | Species | Organ | Tissue | Adj P-value | Log2FC | Malignancy |
| 11234 | HPS5 | LZE4T | Human | Esophagus | ESCC | 3.47e-12 | 3.90e-01 | 0.0811 |
| 11234 | HPS5 | LZE7T | Human | Esophagus | ESCC | 1.38e-02 | 1.18e-01 | 0.0667 |
| 11234 | HPS5 | LZE8T | Human | Esophagus | ESCC | 1.77e-02 | 9.68e-02 | 0.067 |
| 11234 | HPS5 | P1T-E | Human | Esophagus | ESCC | 8.96e-03 | 2.00e-01 | 0.0875 |
| 11234 | HPS5 | P2T-E | Human | Esophagus | ESCC | 4.52e-11 | 2.36e-01 | 0.1177 |
| 11234 | HPS5 | P4T-E | Human | Esophagus | ESCC | 2.58e-06 | 9.07e-02 | 0.1323 |
| 11234 | HPS5 | P5T-E | Human | Esophagus | ESCC | 1.54e-06 | 6.77e-02 | 0.1327 |
| 11234 | HPS5 | P8T-E | Human | Esophagus | ESCC | 6.07e-16 | 1.37e-01 | 0.0889 |
| 11234 | HPS5 | P9T-E | Human | Esophagus | ESCC | 1.53e-06 | 2.00e-01 | 0.1131 |
| 11234 | HPS5 | P10T-E | Human | Esophagus | ESCC | 1.33e-10 | 1.30e-01 | 0.116 |
| 11234 | HPS5 | P11T-E | Human | Esophagus | ESCC | 1.30e-13 | 4.56e-01 | 0.1426 |
| 11234 | HPS5 | P12T-E | Human | Esophagus | ESCC | 3.23e-11 | 1.46e-01 | 0.1122 |
| 11234 | HPS5 | P15T-E | Human | Esophagus | ESCC | 5.92e-08 | 1.82e-01 | 0.1149 |
| 11234 | HPS5 | P16T-E | Human | Esophagus | ESCC | 9.97e-18 | 3.46e-01 | 0.1153 |
| 11234 | HPS5 | P17T-E | Human | Esophagus | ESCC | 4.91e-03 | 1.95e-01 | 0.1278 |
| 11234 | HPS5 | P19T-E | Human | Esophagus | ESCC | 1.67e-02 | 2.86e-01 | 0.1662 |
| 11234 | HPS5 | P20T-E | Human | Esophagus | ESCC | 2.01e-07 | 1.31e-01 | 0.1124 |
| 11234 | HPS5 | P21T-E | Human | Esophagus | ESCC | 6.41e-14 | 2.99e-01 | 0.1617 |
| 11234 | HPS5 | P22T-E | Human | Esophagus | ESCC | 3.01e-03 | 1.78e-01 | 0.1236 |
| 11234 | HPS5 | P24T-E | Human | Esophagus | ESCC | 1.00e-08 | 1.20e-01 | 0.1287 |
| Page: 1 2 3 |
| Tissue | Expression Dynamics | Abbreviation |
| Esophagus | 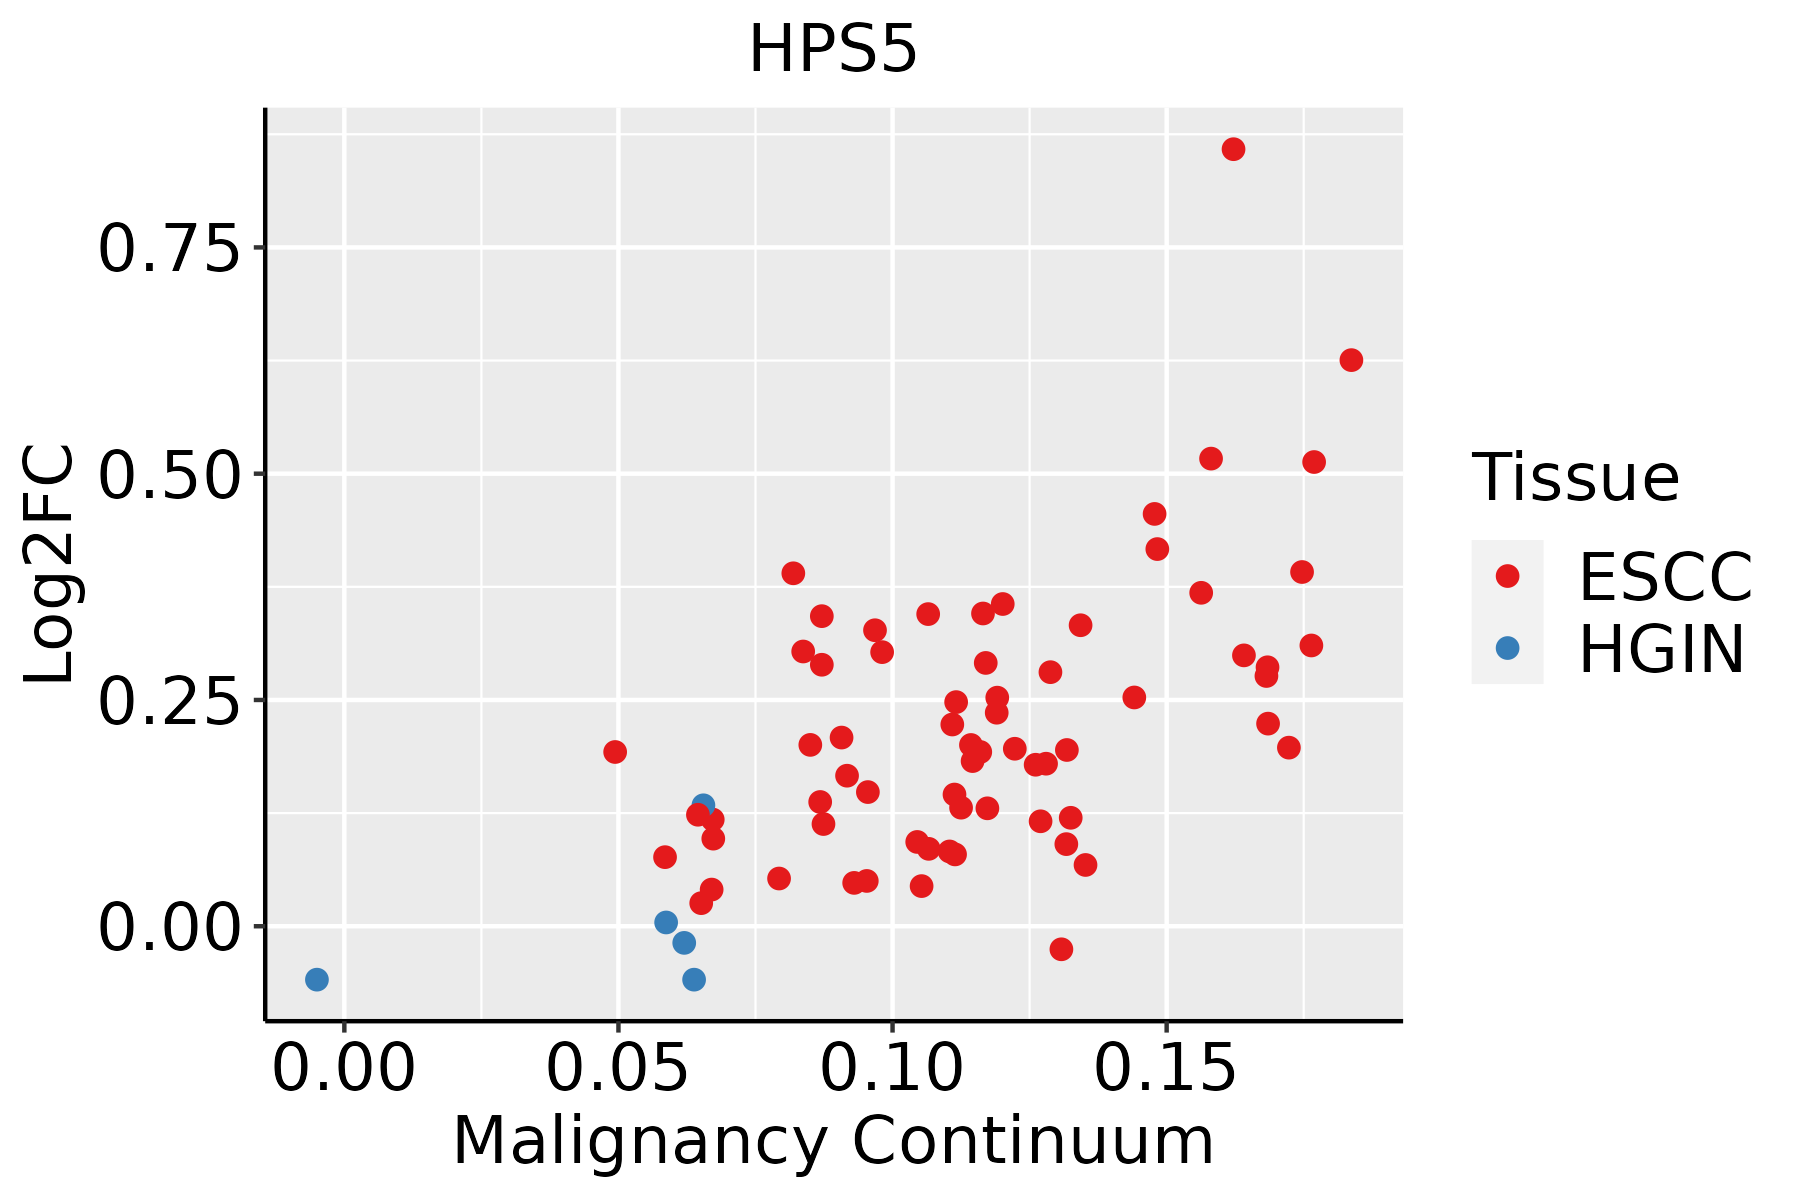 | ESCC: Esophageal squamous cell carcinoma |
| HGIN: High-grade intraepithelial neoplasias | ||
| LGIN: Low-grade intraepithelial neoplasias | ||
| GC | 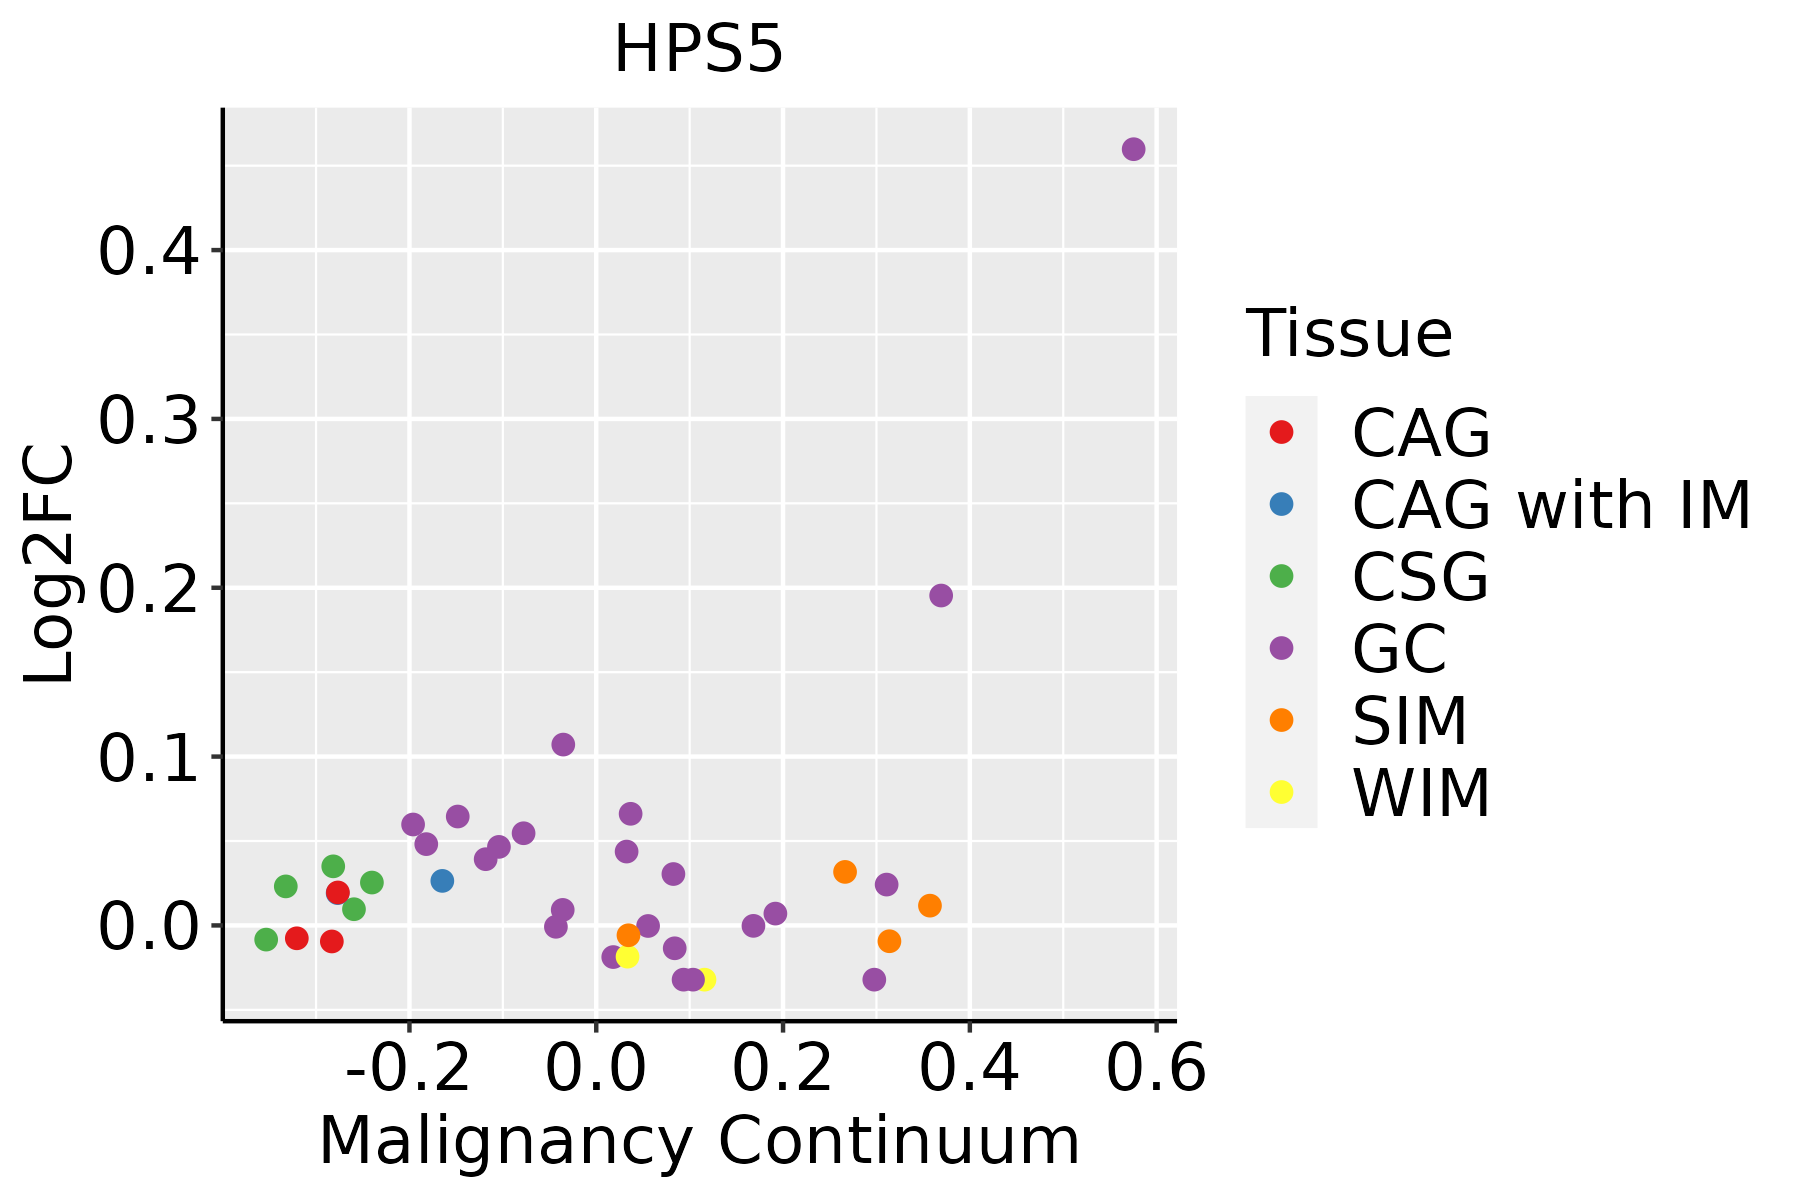 | CAG: Chronic atrophic gastritis |
| CAG with IM: Chronic atrophic gastritis with intestinal metaplasia | ||
| CSG: Chronic superficial gastritis | ||
| GC: Gastric cancer | ||
| SIM: Severe intestinal metaplasia | ||
| WIM: Wild intestinal metaplasia |
| ∗log2FC in expression of this searched gene in stem-like cells from each diseased tissue sample relative to stem-like cells in normal samples in each tissue plotted against the malignancy continuum. Samples are colored based on if they are from different disease stage. |
Top |
Malignant transformation related pathway analysis |
| Find out the enriched GO biological processes and KEGG pathways involved in transition from healthy to precancer to cancer |
| Tissue | Disease Stage | Enriched GO biological Processes |
| Colorectum | AD |  |
| Colorectum | SER |  |
| Colorectum | MSS |  |
| Colorectum | MSI-H |  |
| Colorectum | FAP |  |
| ∗Top 15 enriched GO BP terms are showed in the bar plot of each disease state in each tissue. Each row represents a significant GO biological process which is colored according to the -log10(p.adjust). |
| Page: 1 2 3 4 5 6 7 8 9 |
| GO ID | Tissue | Disease Stage | Description | Gene Ratio | Bg Ratio | pvalue | p.adjust | Count |
| GO:004206027 | Esophagus | ESCC | wound healing | 243/8552 | 422/18723 | 4.62e-07 | 6.25e-06 | 243 |
| GO:00434731 | Esophagus | ESCC | pigmentation | 59/8552 | 98/18723 | 2.64e-03 | 1.12e-02 | 59 |
| GO:00420606 | Stomach | GC | wound healing | 52/1159 | 422/18723 | 1.63e-06 | 7.50e-05 | 52 |
| GO:00508786 | Stomach | GC | regulation of body fluid levels | 40/1159 | 379/18723 | 6.92e-04 | 9.20e-03 | 40 |
| Page: 1 |
| Pathway ID | Tissue | Disease Stage | Description | Gene Ratio | Bg Ratio | pvalue | p.adjust | qvalue | Count |
| Page: 1 |
Top |
Cell-cell communication analysis |
| Identification of potential cell-cell interactions between two cell types and their ligand-receptor pairs for different disease states |
| Ligand | Receptor | LRpair | Pathway | Tissue | Disease Stage |
| Page: 1 |
Top |
Single-cell gene regulatory network inference analysis |
| Find out the significant the regulons (TFs) and the target genes of each regulon across cell types for different disease states |
| TF | Cell Type | Tissue | Disease Stage | Target Gene | RSS | Regulon Activity |
| ∗The dot plots of a searched regulon are shown for all cell subpopulations in each disease state of each tissue based on the regulon specific score inferred using pySCENIC and by calculating the average expression. |
| Page: 1 |
Top |
Somatic mutation of malignant transformation related genes |
| Annotation of somatic variants for genes involved in malignant transformation |
| Hugo Symbol | Variant Class | Variant Classification | dbSNP RS | HGVSc | HGVSp | HGVSp Short | SWISSPROT | BIOTYPE | SIFT | PolyPhen | Tumor Sample Barcode | Tissue | Histology | Sex | Age | Stage | Therapy Types | Drugs | Outcome |
| HPS5 | SNV | Missense_Mutation | c.2837N>T | p.Arg946Met | p.R946M | Q9UPZ3 | protein_coding | deleterious(0) | probably_damaging(0.999) | TCGA-A8-A09Z-01 | Breast | breast invasive carcinoma | Female | >=65 | I/II | Unknown | Unknown | SD | |
| HPS5 | SNV | Missense_Mutation | novel | c.262N>T | p.Asp88Tyr | p.D88Y | Q9UPZ3 | protein_coding | deleterious(0.02) | probably_damaging(0.968) | TCGA-BH-A0B6-01 | Breast | breast invasive carcinoma | Female | <65 | I/II | Unknown | Unknown | SD |
| HPS5 | SNV | Missense_Mutation | novel | c.1955N>T | p.Ala652Val | p.A652V | Q9UPZ3 | protein_coding | tolerated(0.06) | benign(0.242) | TCGA-2W-A8YY-01 | Cervix | cervical & endocervical cancer | Female | <65 | I/II | Chemotherapy | cisplatin | CR |
| HPS5 | SNV | Missense_Mutation | c.1246C>G | p.Gln416Glu | p.Q416E | Q9UPZ3 | protein_coding | deleterious(0.02) | possibly_damaging(0.743) | TCGA-C5-A7UH-01 | Cervix | cervical & endocervical cancer | Female | <65 | III/IV | Chemotherapy | cisplatin | SD | |
| HPS5 | SNV | Missense_Mutation | c.3279N>T | p.Glu1093Asp | p.E1093D | Q9UPZ3 | protein_coding | tolerated(0.26) | benign(0.295) | TCGA-FU-A3HZ-01 | Cervix | cervical & endocervical cancer | Female | <65 | I/II | Chemotherapy | cisplatin | CR | |
| HPS5 | SNV | Missense_Mutation | c.2894N>C | p.Lys965Thr | p.K965T | Q9UPZ3 | protein_coding | deleterious(0.01) | probably_damaging(0.959) | TCGA-FU-A3HZ-01 | Cervix | cervical & endocervical cancer | Female | <65 | I/II | Chemotherapy | cisplatin | CR | |
| HPS5 | SNV | Missense_Mutation | c.1621N>T | p.Ala541Ser | p.A541S | Q9UPZ3 | protein_coding | tolerated(0.1) | probably_damaging(0.999) | TCGA-FU-A3HZ-01 | Cervix | cervical & endocervical cancer | Female | <65 | I/II | Chemotherapy | cisplatin | CR | |
| HPS5 | SNV | Missense_Mutation | c.2707N>A | p.Glu903Lys | p.E903K | Q9UPZ3 | protein_coding | deleterious(0.03) | possibly_damaging(0.906) | TCGA-IR-A3LH-01 | Cervix | cervical & endocervical cancer | Female | <65 | I/II | Chemotherapy | cisplatin | CR | |
| HPS5 | SNV | Missense_Mutation | rs150200184 | c.1087N>T | p.Arg363Cys | p.R363C | Q9UPZ3 | protein_coding | deleterious(0) | probably_damaging(0.999) | TCGA-5M-AAT6-01 | Colorectum | colon adenocarcinoma | Female | <65 | III/IV | Unknown | Unknown | PD |
| HPS5 | SNV | Missense_Mutation | c.2053G>T | p.Asp685Tyr | p.D685Y | Q9UPZ3 | protein_coding | tolerated(0.07) | benign(0.232) | TCGA-AA-3977-01 | Colorectum | colon adenocarcinoma | Male | >=65 | I/II | Unknown | Unknown | SD |
| Page: 1 2 3 4 5 6 7 8 9 10 |
Top |
Related drugs of malignant transformation related genes |
| Identification of chemicals and drugs interact with genes involved in malignant transfromation |
| (DGIdb 4.0) |
| Entrez ID | Symbol | Category | Interaction Types | Drug Claim Name | Drug Name | PMIDs |
| Page: 1 |

Copyright 2023-Present -The University of Texas Health Science Center at Houston |