Schematic overview of the cellular and molecular mechanisms involved in the cancer progression, including the proposed cellular and molecular mechanisms in cancer cells trajectory. AT1: alveolar type 1 cells; AT2: alveolar type 2 cells; AAH: atypical adenomatous hyperplasia; AIS: adenocarcinoma in situ; MIA: minimally invasive adenocarcinoma; IA: invasive adenocarcinoma; EMT: epithelial-mesenchymal transition

Home

Download

Statistics

Help

Contact

Center for Computational Systems Medicine
leaf

Gene summary

leaf

Malignant transformation analysis

leaf

Malignant transformation related pathway analysis

leaf

Cell-cell communication analysis

leaf

Single-cell gene regulatory network inference analysis

leaf

Somatic mutation of malignant transformation related genes

leaf

Related drugs of malignant transformation related genes

Gene: HPS4

Gene summary for HPS4

check button Gene summary.

Gene informationSpeciesHuman
Gene symbol

HPS4

Gene ID

89781

Gene nameHPS4 biogenesis of lysosomal organelles complex 3 subunit 2
Gene AliasBLOC3S2
Cytomap22q12.1
Gene Typeprotein-coding
GO ID

GO:0006605

UniProtAcc

A8K2E6


Top

Malignant transformation analysis

check button Identification of the aberrant gene expression in precancerous and cancerous lesions by comparing the gene expression of stem-like cells in diseased tissues with normal stem cells
check button Malignant transformation involving gene list.
Entrez IDSymbolReplicatesSpeciesOrganTissueAdj P-valueLog2FCMalignancy
89781HPS4LZE4THumanEsophagusESCC1.03e-092.65e-010.0811
89781HPS4LZE7THumanEsophagusESCC7.55e-103.94e-010.0667
89781HPS4LZE8THumanEsophagusESCC1.07e-031.48e-010.067
89781HPS4LZE20THumanEsophagusESCC1.66e-072.09e-010.0662
89781HPS4LZE24THumanEsophagusESCC1.94e-194.09e-010.0596
89781HPS4LZE21THumanEsophagusESCC9.90e-053.77e-010.0655
89781HPS4LZE6THumanEsophagusESCC1.19e-031.68e-010.0845
89781HPS4P1T-EHumanEsophagusESCC2.78e-094.11e-010.0875
89781HPS4P2T-EHumanEsophagusESCC1.20e-345.81e-010.1177
89781HPS4P4T-EHumanEsophagusESCC3.27e-133.23e-010.1323
89781HPS4P5T-EHumanEsophagusESCC1.87e-071.61e-010.1327
89781HPS4P8T-EHumanEsophagusESCC6.65e-173.09e-010.0889
89781HPS4P9T-EHumanEsophagusESCC3.34e-132.86e-010.1131
89781HPS4P10T-EHumanEsophagusESCC1.56e-407.41e-010.116
89781HPS4P11T-EHumanEsophagusESCC3.35e-125.33e-010.1426
89781HPS4P12T-EHumanEsophagusESCC2.44e-254.13e-010.1122
89781HPS4P15T-EHumanEsophagusESCC3.91e-224.47e-010.1149
89781HPS4P16T-EHumanEsophagusESCC2.21e-477.02e-010.1153
89781HPS4P17T-EHumanEsophagusESCC3.81e-073.49e-010.1278
89781HPS4P20T-EHumanEsophagusESCC1.63e-122.61e-010.1124
Page: 1 2 3 4 5 6 

check button Transcriptomic changes along malignancy continuum.
TissueExpression DynamicsAbbreviation
EsophagusThe image shows the transcriptomic changes along malignancy continuum.log2FC in expression of this searched gene in stem-like cells from each diseased tissue sample relative to stem-like cells in normal samples in each tissue plotted against the malignancy continuum. Samples are colored based on if they are from different disease stage.
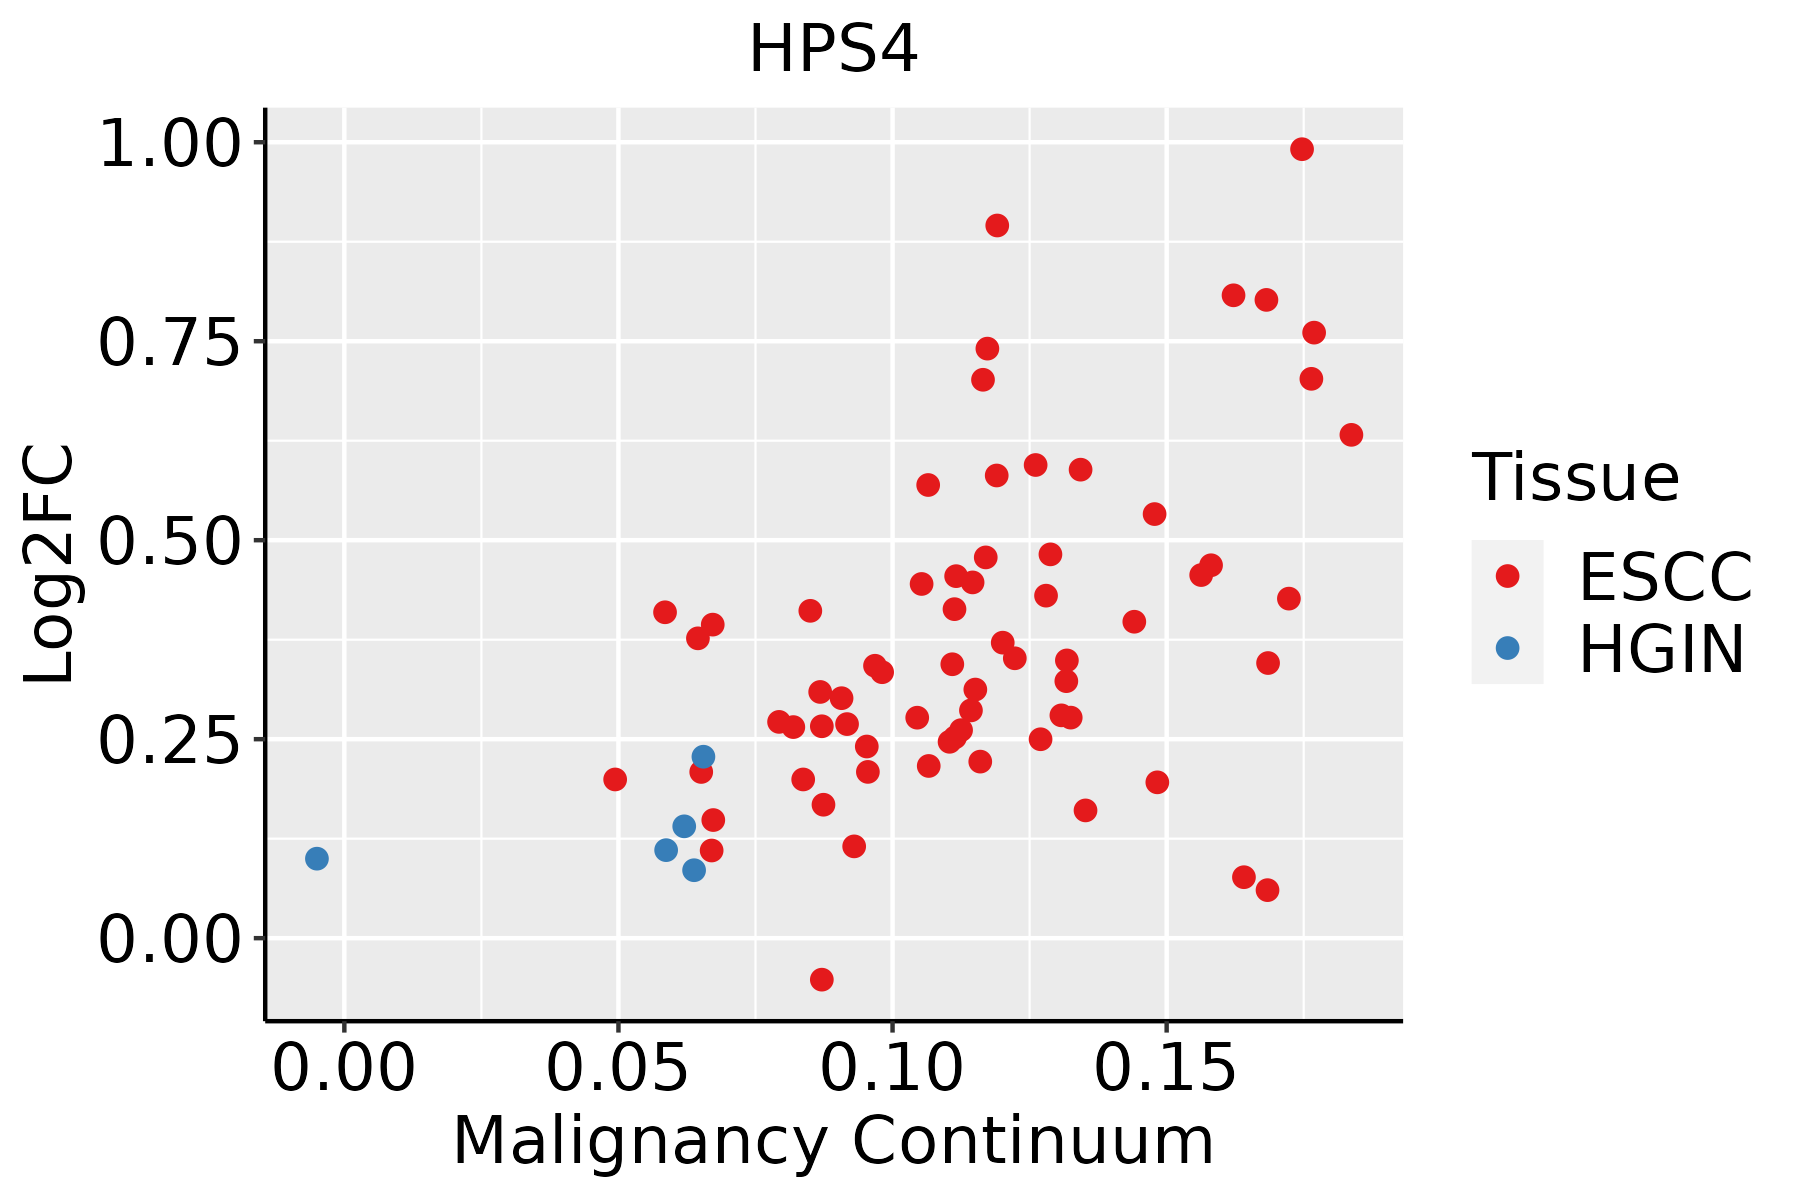
ESCC: Esophageal squamous cell carcinoma
HGIN: High-grade intraepithelial neoplasias
LGIN: Low-grade intraepithelial neoplasias
LiverThe image shows the transcriptomic changes along malignancy continuum.log2FC in expression of this searched gene in stem-like cells from each diseased tissue sample relative to stem-like cells in normal samples in each tissue plotted against the malignancy continuum. Samples are colored based on if they are from different disease stage.
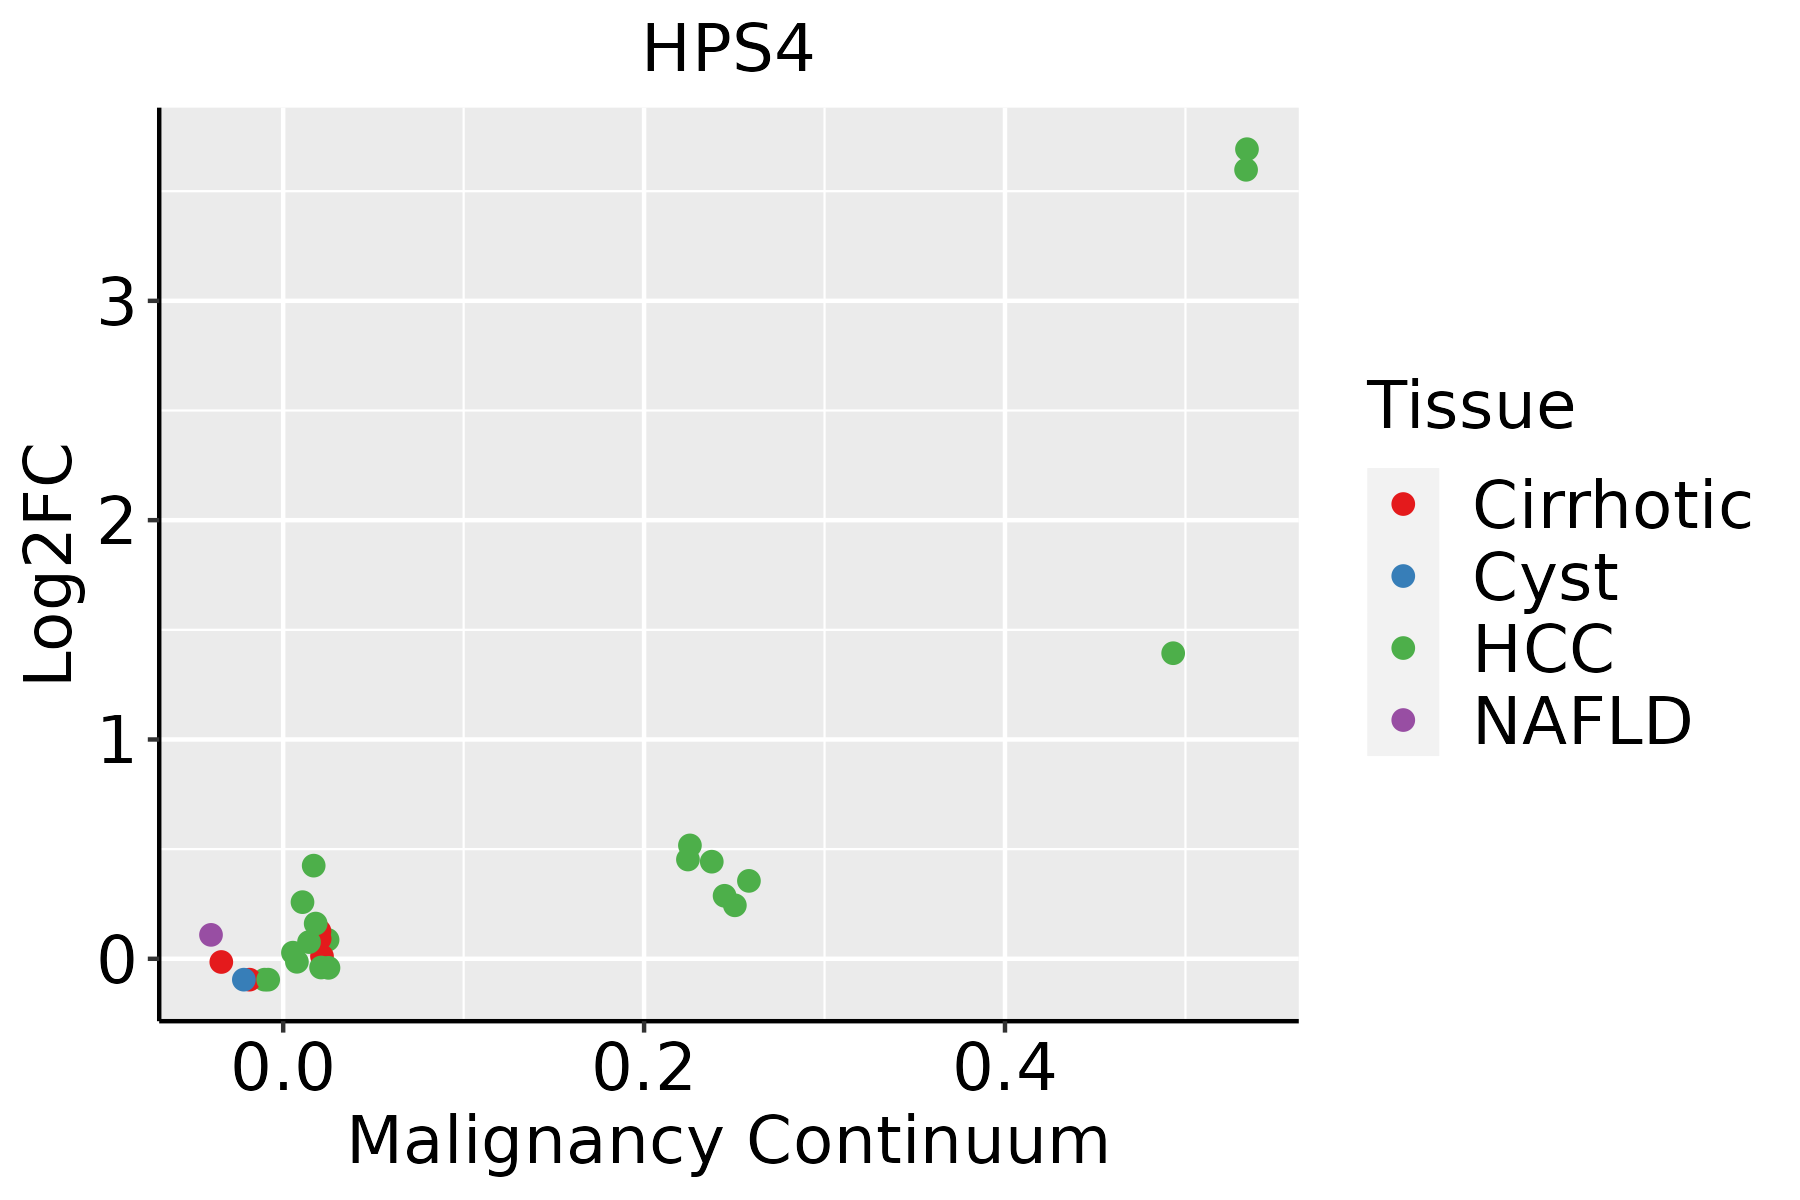
HCC: Hepatocellular carcinoma
NAFLD: Non-alcoholic fatty liver disease
Oral CavityThe image shows the transcriptomic changes along malignancy continuum.log2FC in expression of this searched gene in stem-like cells from each diseased tissue sample relative to stem-like cells in normal samples in each tissue plotted against the malignancy continuum. Samples are colored based on if they are from different disease stage.
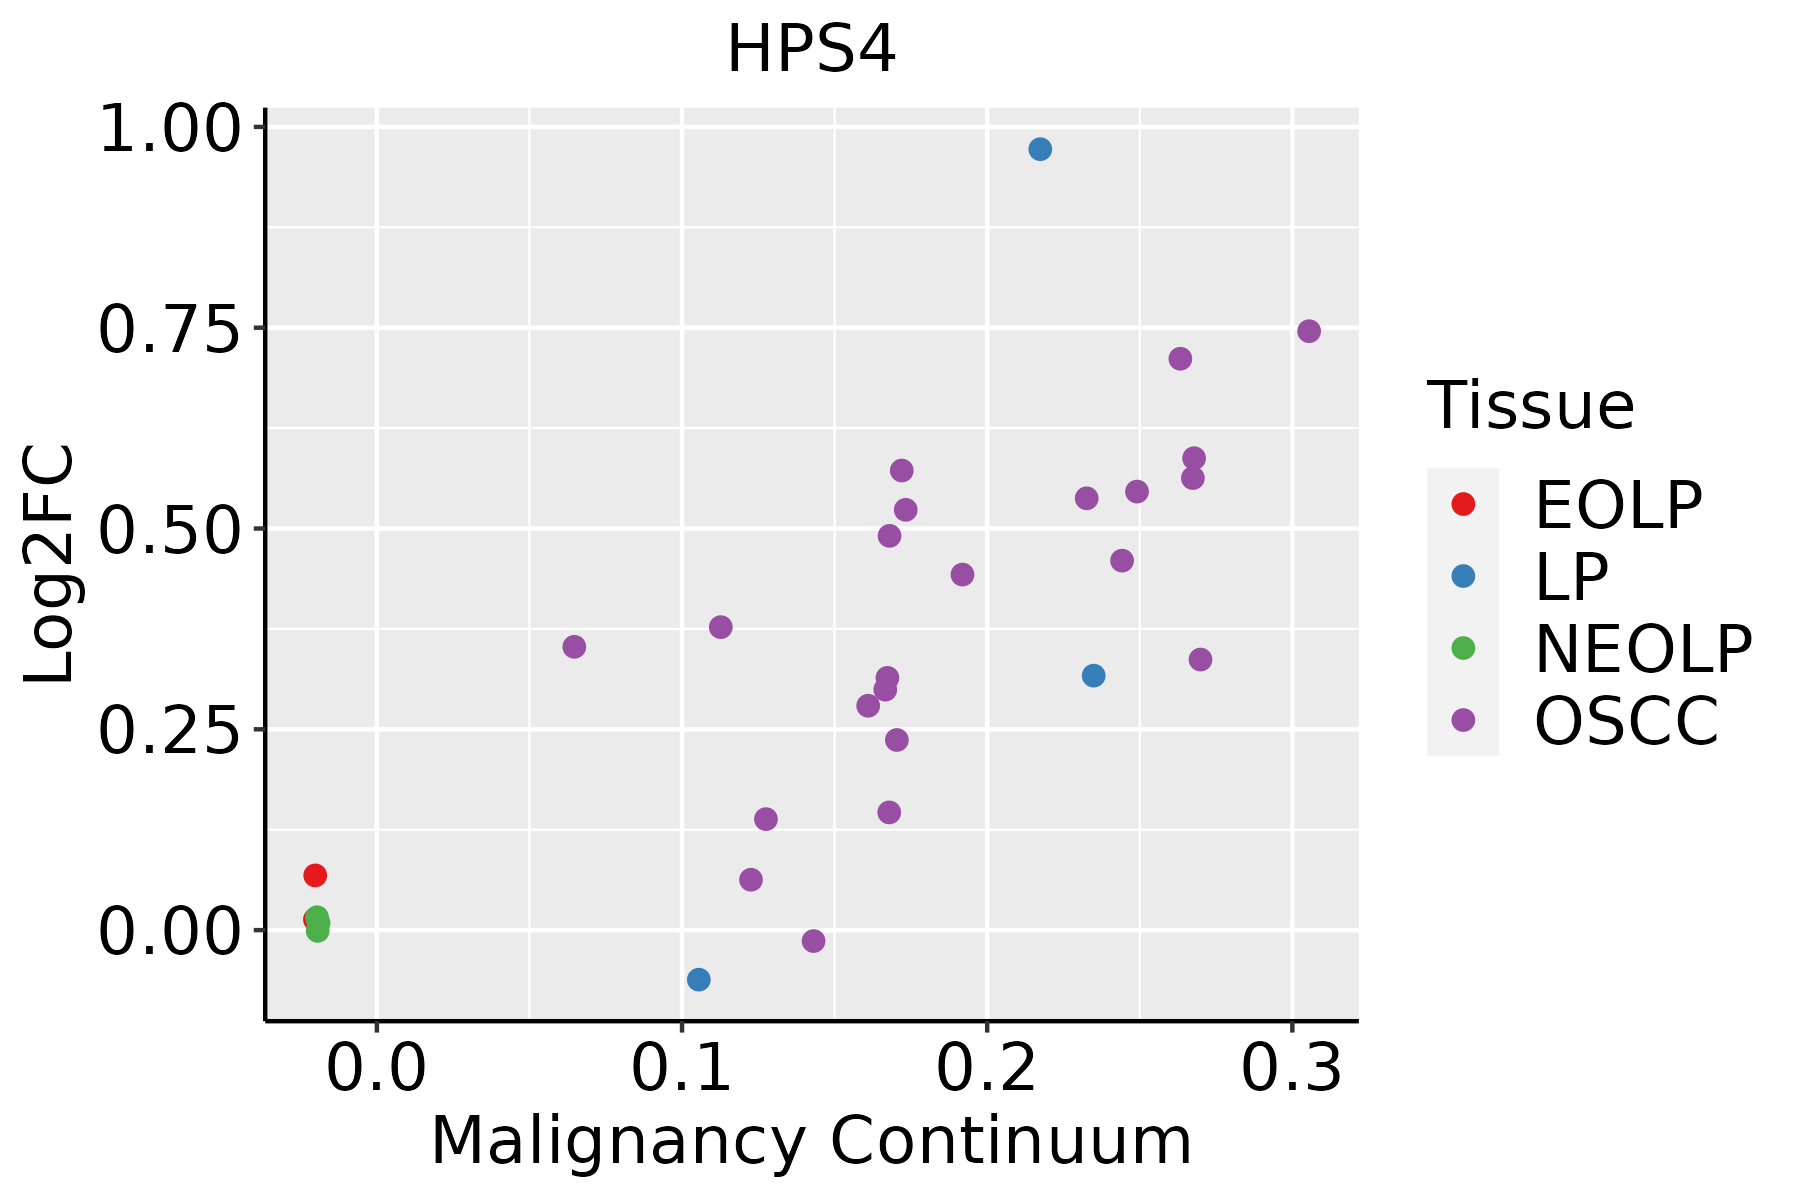
EOLP: Erosive Oral lichen planus
LP: leukoplakia
NEOLP: Non-erosive oral lichen planus
OSCC: Oral squamous cell carcinoma
ThyroidThe image shows the transcriptomic changes along malignancy continuum.log2FC in expression of this searched gene in stem-like cells from each diseased tissue sample relative to stem-like cells in normal samples in each tissue plotted against the malignancy continuum. Samples are colored based on if they are from different disease stage.ATC: Anaplastic thyroid cancer
HT: Hashimoto's thyroiditis
PTC: Papillary thyroid cancer
∗log2FC in expression of this searched gene in stem-like cells from each diseased tissue sample relative to stem-like cells in normal samples in each tissue plotted against the malignancy continuum. Samples are colored based on if they are from different disease stage.

Top

Malignant transformation related pathway analysis

check buttonFind out the enriched GO biological processes and KEGG pathways involved in transition from healthy to precancer to cancer
check button Figure of enriched GO biological processes.
TissueDisease StageEnriched GO biological Processes
ColorectumADGO analysis - Figure of enriched GO biological processes: Top 15 enriched GO BP terms are showed in the bar plot of each disease state in each tissue. Each row represents a significant GO biological process which is colored according to the -log10(p.adjust).
ColorectumSERGO analysis - Figure of enriched GO biological processes: Top 15 enriched GO BP terms are showed in the bar plot of each disease state in each tissue. Each row represents a significant GO biological process which is colored according to the -log10(p.adjust).
ColorectumMSSGO analysis - Figure of enriched GO biological processes: Top 15 enriched GO BP terms are showed in the bar plot of each disease state in each tissue. Each row represents a significant GO biological process which is colored according to the -log10(p.adjust).
ColorectumMSI-HGO analysis - Figure of enriched GO biological processes: Top 15 enriched GO BP terms are showed in the bar plot of each disease state in each tissue. Each row represents a significant GO biological process which is colored according to the -log10(p.adjust).
ColorectumFAPGO analysis - Figure of enriched GO biological processes: Top 15 enriched GO BP terms are showed in the bar plot of each disease state in each tissue. Each row represents a significant GO biological process which is colored according to the -log10(p.adjust).
∗Top 15 enriched GO BP terms are showed in the bar plot of each disease state in each tissue. Each row represents a significant GO biological process which is colored according to the -log10(p.adjust).
Page: 1 2 3 4 5 6 7 8 9 

check button Enriched GO biological processes.
GO IDTissueDisease StageDescriptionGene RatioBg Ratiopvaluep.adjustCount
GO:0072594110EsophagusESCCestablishment of protein localization to organelle311/8552422/187233.02e-322.13e-29311
GO:0031647111EsophagusESCCregulation of protein stability223/8552298/187235.76e-251.52e-22223
GO:003238618EsophagusESCCregulation of intracellular transport243/8552337/187233.20e-237.25e-21243
GO:0006605111EsophagusESCCprotein targeting229/8552314/187234.93e-231.01e-20229
GO:0006839110EsophagusESCCmitochondrial transport187/8552254/187238.35e-209.81e-18187
GO:1903829111EsophagusESCCpositive regulation of cellular protein localization199/8552276/187232.99e-193.45e-17199
GO:001605014EsophagusESCCvesicle organization211/8552300/187232.85e-182.87e-16211
GO:0033157110EsophagusESCCregulation of intracellular protein transport169/8552229/187233.31e-183.23e-16169
GO:0032388110EsophagusESCCpositive regulation of intracellular transport152/8552202/187237.89e-187.36e-16152
GO:1904951111EsophagusESCCpositive regulation of establishment of protein localization216/8552319/187231.01e-156.86e-14216
GO:0072655110EsophagusESCCestablishment of protein localization to mitochondrion97/8552120/187232.17e-151.33e-1397
GO:009031617EsophagusESCCpositive regulation of intracellular protein transport122/8552160/187232.45e-151.49e-13122
GO:0070585110EsophagusESCCprotein localization to mitochondrion100/8552125/187232.96e-151.77e-13100
GO:0050821111EsophagusESCCprotein stabilization140/8552191/187236.50e-153.61e-13140
GO:0051222111EsophagusESCCpositive regulation of protein transport204/8552303/187231.56e-148.38e-13204
GO:0006626110EsophagusESCCprotein targeting to mitochondrion81/8552100/187233.60e-131.67e-1181
GO:000703314EsophagusESCCvacuole organization127/8552180/187231.04e-113.85e-10127
GO:004206027EsophagusESCCwound healing243/8552422/187234.62e-076.25e-06243
GO:00070403EsophagusESCClysosome organization53/855274/187235.34e-065.57e-0553
GO:00801713EsophagusESCClytic vacuole organization53/855274/187235.34e-065.57e-0553
Page: 1 2 3 4 5 6 7 8 9 10 

check button Enriched KEGG pathways.
Pathway IDTissueDisease StageDescriptionGene RatioBg Ratiopvaluep.adjustqvalueCount
Page: 1 

Top

Cell-cell communication analysis

check buttonIdentification of potential cell-cell interactions between two cell types and their ligand-receptor pairs for different disease states
LigandReceptorLRpairPathwayTissueDisease Stage
Page: 1 

Top

Single-cell gene regulatory network inference analysis

check buttonFind out the significant the regulons (TFs) and the target genes of each regulon across cell types for different disease states
TFCell TypeTissueDisease StageTarget GeneRSSRegulon Activity
∗The dot plots of a searched regulon are shown for all cell subpopulations in each disease state of each tissue based on the regulon specific score inferred using pySCENIC and by calculating the average expression.
Page: 1 

Top

Somatic mutation of malignant transformation related genes

check buttonAnnotation of somatic variants for genes involved in malignant transformation
Hugo SymbolVariant ClassVariant ClassificationdbSNP RSHGVScHGVSpHGVSp ShortSWISSPROTBIOTYPESIFTPolyPhenTumor Sample BarcodeTissueHistologySexAgeStageTherapy TypesDrugsOutcome
HPS4SNVMissense_Mutationnovelc.1978N>Tp.Ala660Serp.A660SQ9NQG7protein_codingdeleterious(0.02)probably_damaging(0.986)TCGA-A8-A08H-01Breastbreast invasive carcinomaFemale>=65I/IIUnknownUnknownSD
HPS4SNVMissense_Mutationc.365C>Ap.Pro122Hisp.P122HQ9NQG7protein_codingdeleterious(0)probably_damaging(0.998)TCGA-AN-A0AK-01Breastbreast invasive carcinomaFemale>=65I/IIUnknownUnknownSD
HPS4SNVMissense_Mutationc.874N>Tp.Ala292Serp.A292SQ9NQG7protein_codingtolerated(0.15)benign(0.178)TCGA-BH-A0BJ-01Breastbreast invasive carcinomaFemale<65I/IIChemotherapydoxorubicinSD
HPS4SNVMissense_Mutationc.304N>Cp.Asp102Hisp.D102HQ9NQG7protein_codingdeleterious(0)probably_damaging(0.977)TCGA-BH-A0DZ-01Breastbreast invasive carcinomaFemale<65I/IIChemotherapydocetaxelSD
HPS4insertionNonsense_Mutationnovelc.1411_1412insGGGGGTAAAAGCp.Leu470_Leu471insTrpGlyTerLysp.L470_L471insWG*KQ9NQG7protein_codingTCGA-A2-A0T2-01Breastbreast invasive carcinomaFemale>=65III/IVChemotherapyxelodaPD
HPS4insertionIn_Frame_Insnovelc.2100_2101insTCCCTTACTCTAGGTGAATGCTTCACTGCTGAGGTCCCCTCAp.Leu700_Leu701insSerLeuThrLeuGlyGluCysPheThrAlaGluValProSerp.L700_L701insSLTLGECFTAEVPSQ9NQG7protein_codingTCGA-BH-A0B7-01Breastbreast invasive carcinomaFemale<65I/IIChemotherapyadriamycinCR
HPS4SNVMissense_Mutationnovelc.1547N>Tp.Gln516Leup.Q516LQ9NQG7protein_codingtolerated(0.23)benign(0.15)TCGA-DS-A1OA-01Cervixcervical & endocervical cancerFemale>=65I/IIChemotherapycarboplatinPD
HPS4SNVMissense_Mutationc.1388N>Ap.Arg463Lysp.R463KQ9NQG7protein_codingtolerated(0.33)benign(0.058)TCGA-EK-A2PG-01Cervixcervical & endocervical cancerFemale>=65I/IIUnknownUnknownSD
HPS4SNVMissense_Mutationc.176N>Cp.Gly59Alap.G59AQ9NQG7protein_codingdeleterious(0)probably_damaging(0.999)TCGA-EK-A2RC-01Cervixcervical & endocervical cancerFemale<65I/IIUnknownUnknownSD
HPS4insertionIn_Frame_Insnovelc.1545_1546insTCCp.Cys515_Gln516insSerp.C515_Q516insSQ9NQG7protein_codingTCGA-DS-A1OA-01Cervixcervical & endocervical cancerFemale>=65I/IIChemotherapycarboplatinPD
Page: 1 2 3 4 5 6 7 8 

Top

Related drugs of malignant transformation related genes

check buttonIdentification of chemicals and drugs interact with genes involved in malignant transfromation
(DGIdb 4.0)
Entrez IDSymbolCategoryInteraction TypesDrug Claim NameDrug NamePMIDs
Page: 1