
|
|||||
|
 | |
| |
| |
| |
| |
| |
|
Gene: HPRT1 |
Gene summary for HPRT1 |
| Gene information | Species | Human | Gene symbol | HPRT1 | Gene ID | 3251 |
| Gene name | hypoxanthine phosphoribosyltransferase 1 | |
| Gene Alias | HGPRT | |
| Cytomap | Xq26.2-q26.3 | |
| Gene Type | protein-coding | GO ID | GO:0000902 | UniProtAcc | A0A140VJL3 |
Top |
Malignant transformation analysis |
| Identification of the aberrant gene expression in precancerous and cancerous lesions by comparing the gene expression of stem-like cells in diseased tissues with normal stem cells |
| Entrez ID | Symbol | Replicates | Species | Organ | Tissue | Adj P-value | Log2FC | Malignancy |
| 3251 | HPRT1 | Tumor | Human | Cervix | CC | 4.99e-21 | 5.33e-01 | 0.1241 |
| 3251 | HPRT1 | sample3 | Human | Cervix | CC | 1.11e-30 | 5.69e-01 | 0.1387 |
| 3251 | HPRT1 | T3 | Human | Cervix | CC | 5.80e-30 | 5.68e-01 | 0.1389 |
| 3251 | HPRT1 | LZE2T | Human | Esophagus | ESCC | 2.44e-04 | 6.81e-01 | 0.082 |
| 3251 | HPRT1 | LZE4T | Human | Esophagus | ESCC | 4.23e-23 | 7.84e-01 | 0.0811 |
| 3251 | HPRT1 | LZE5T | Human | Esophagus | ESCC | 3.61e-05 | 6.61e-01 | 0.0514 |
| 3251 | HPRT1 | LZE7T | Human | Esophagus | ESCC | 3.96e-16 | 8.93e-01 | 0.0667 |
| 3251 | HPRT1 | LZE8T | Human | Esophagus | ESCC | 1.55e-16 | 5.05e-01 | 0.067 |
| 3251 | HPRT1 | LZE20T | Human | Esophagus | ESCC | 3.63e-12 | 2.74e-01 | 0.0662 |
| 3251 | HPRT1 | LZE22D1 | Human | Esophagus | HGIN | 7.77e-03 | 1.77e-01 | 0.0595 |
| 3251 | HPRT1 | LZE24T | Human | Esophagus | ESCC | 5.24e-38 | 1.08e+00 | 0.0596 |
| 3251 | HPRT1 | LZE21T | Human | Esophagus | ESCC | 1.94e-05 | 6.29e-01 | 0.0655 |
| 3251 | HPRT1 | LZE6T | Human | Esophagus | ESCC | 1.45e-21 | 1.09e+00 | 0.0845 |
| 3251 | HPRT1 | P1T-E | Human | Esophagus | ESCC | 5.73e-04 | 3.18e-01 | 0.0875 |
| 3251 | HPRT1 | P2T-E | Human | Esophagus | ESCC | 6.63e-42 | 8.83e-01 | 0.1177 |
| 3251 | HPRT1 | P4T-E | Human | Esophagus | ESCC | 3.90e-64 | 1.65e+00 | 0.1323 |
| 3251 | HPRT1 | P5T-E | Human | Esophagus | ESCC | 3.11e-64 | 1.35e+00 | 0.1327 |
| 3251 | HPRT1 | P8T-E | Human | Esophagus | ESCC | 8.79e-24 | 5.11e-01 | 0.0889 |
| 3251 | HPRT1 | P9T-E | Human | Esophagus | ESCC | 6.34e-26 | 7.66e-01 | 0.1131 |
| 3251 | HPRT1 | P10T-E | Human | Esophagus | ESCC | 2.34e-74 | 1.30e+00 | 0.116 |
| Page: 1 2 3 4 5 6 7 |
| Tissue | Expression Dynamics | Abbreviation |
| Cervix | 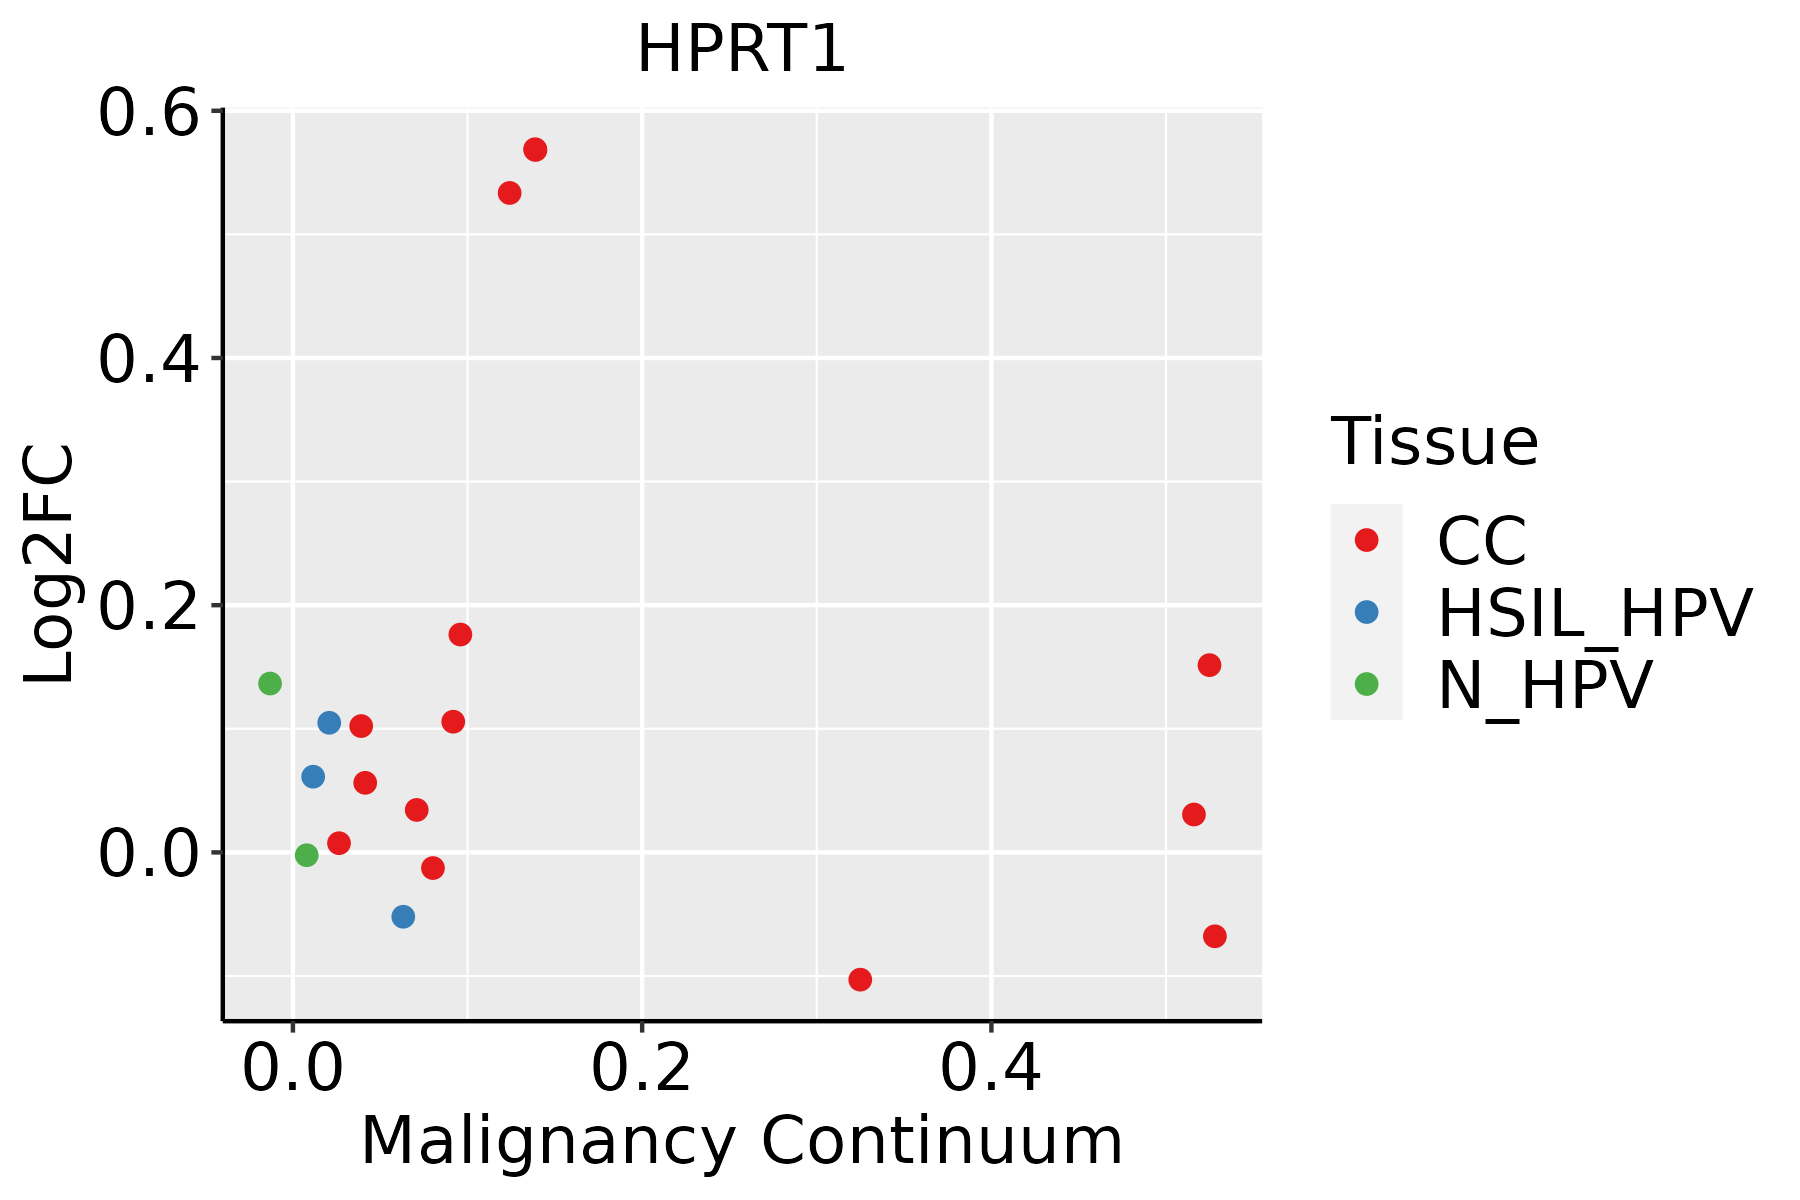 | CC: Cervix cancer |
| HSIL_HPV: HPV-infected high-grade squamous intraepithelial lesions | ||
| N_HPV: HPV-infected normal cervix | ||
| Esophagus |  | ESCC: Esophageal squamous cell carcinoma |
| HGIN: High-grade intraepithelial neoplasias | ||
| LGIN: Low-grade intraepithelial neoplasias | ||
| Liver |  | HCC: Hepatocellular carcinoma |
| NAFLD: Non-alcoholic fatty liver disease | ||
| Oral Cavity |  | EOLP: Erosive Oral lichen planus |
| LP: leukoplakia | ||
| NEOLP: Non-erosive oral lichen planus | ||
| OSCC: Oral squamous cell carcinoma | ||
| Skin |  | AK: Actinic keratosis |
| cSCC: Cutaneous squamous cell carcinoma | ||
| SCCIS:squamous cell carcinoma in situ | ||
| Thyroid |  | ATC: Anaplastic thyroid cancer |
| HT: Hashimoto's thyroiditis | ||
| PTC: Papillary thyroid cancer |
| ∗log2FC in expression of this searched gene in stem-like cells from each diseased tissue sample relative to stem-like cells in normal samples in each tissue plotted against the malignancy continuum. Samples are colored based on if they are from different disease stage. |
Top |
Malignant transformation related pathway analysis |
| Find out the enriched GO biological processes and KEGG pathways involved in transition from healthy to precancer to cancer |
| Tissue | Disease Stage | Enriched GO biological Processes |
| Colorectum | AD |  |
| Colorectum | SER |  |
| Colorectum | MSS |  |
| Colorectum | MSI-H |  |
| Colorectum | FAP |  |
| ∗Top 15 enriched GO BP terms are showed in the bar plot of each disease state in each tissue. Each row represents a significant GO biological process which is colored according to the -log10(p.adjust). |
| Page: 1 2 3 4 5 6 7 8 9 |
| GO ID | Tissue | Disease Stage | Description | Gene Ratio | Bg Ratio | pvalue | p.adjust | Count |
| GO:00163587 | Cervix | CC | dendrite development | 58/2311 | 243/18723 | 4.52e-07 | 1.76e-05 | 58 |
| GO:00706617 | Cervix | CC | leukocyte proliferation | 65/2311 | 318/18723 | 2.56e-05 | 4.32e-04 | 65 |
| GO:00466516 | Cervix | CC | lymphocyte proliferation | 59/2311 | 288/18723 | 5.53e-05 | 8.10e-04 | 59 |
| GO:00329435 | Cervix | CC | mononuclear cell proliferation | 59/2311 | 291/18723 | 7.51e-05 | 1.03e-03 | 59 |
| GO:00467008 | Cervix | CC | heterocycle catabolic process | 80/2311 | 445/18723 | 3.23e-04 | 3.42e-03 | 80 |
| GO:00346559 | Cervix | CC | nucleobase-containing compound catabolic process | 74/2311 | 407/18723 | 3.77e-04 | 3.88e-03 | 74 |
| GO:00196939 | Cervix | CC | ribose phosphate metabolic process | 72/2311 | 396/18723 | 4.49e-04 | 4.48e-03 | 72 |
| GO:00092599 | Cervix | CC | ribonucleotide metabolic process | 70/2311 | 385/18723 | 5.35e-04 | 5.18e-03 | 70 |
| GO:00019135 | Cervix | CC | T cell mediated cytotoxicity | 15/2311 | 49/18723 | 5.81e-04 | 5.52e-03 | 15 |
| GO:00024564 | Cervix | CC | T cell mediated immunity | 26/2311 | 109/18723 | 6.39e-04 | 5.97e-03 | 26 |
| GO:00442709 | Cervix | CC | cellular nitrogen compound catabolic process | 79/2311 | 451/18723 | 7.80e-04 | 6.91e-03 | 79 |
| GO:00463908 | Cervix | CC | ribose phosphate biosynthetic process | 39/2311 | 190/18723 | 9.02e-04 | 7.77e-03 | 39 |
| GO:000915010 | Cervix | CC | purine ribonucleotide metabolic process | 66/2311 | 368/18723 | 1.09e-03 | 9.07e-03 | 66 |
| GO:00092608 | Cervix | CC | ribonucleotide biosynthetic process | 37/2311 | 182/18723 | 1.44e-03 | 1.13e-02 | 37 |
| GO:00194398 | Cervix | CC | aromatic compound catabolic process | 79/2311 | 467/18723 | 2.14e-03 | 1.54e-02 | 79 |
| GO:00019067 | Cervix | CC | cell killing | 37/2311 | 188/18723 | 2.61e-03 | 1.80e-02 | 37 |
| GO:00091529 | Cervix | CC | purine ribonucleotide biosynthetic process | 34/2311 | 169/18723 | 2.62e-03 | 1.81e-02 | 34 |
| GO:00024603 | Cervix | CC | adaptive immune response based on somatic recombination of immune receptors built from immunoglobulin superfamily domains | 62/2311 | 356/18723 | 3.09e-03 | 2.03e-02 | 62 |
| GO:00488135 | Cervix | CC | dendrite morphogenesis | 30/2311 | 146/18723 | 3.27e-03 | 2.13e-02 | 30 |
| GO:00219541 | Cervix | CC | central nervous system neuron development | 19/2311 | 81/18723 | 3.96e-03 | 2.48e-02 | 19 |
| Page: 1 2 3 4 5 6 7 8 9 10 11 12 13 14 15 16 17 18 19 |
| Pathway ID | Tissue | Disease Stage | Description | Gene Ratio | Bg Ratio | pvalue | p.adjust | qvalue | Count |
| hsa012325 | Esophagus | ESCC | Nucleotide metabolism | 59/4205 | 85/8465 | 1.67e-04 | 6.58e-04 | 3.37e-04 | 59 |
| hsa0123212 | Esophagus | ESCC | Nucleotide metabolism | 59/4205 | 85/8465 | 1.67e-04 | 6.58e-04 | 3.37e-04 | 59 |
| hsa01232 | Liver | Cirrhotic | Nucleotide metabolism | 39/2530 | 85/8465 | 1.27e-03 | 6.73e-03 | 4.15e-03 | 39 |
| hsa00983 | Liver | Cirrhotic | Drug metabolism - other enzymes | 34/2530 | 80/8465 | 1.08e-02 | 3.57e-02 | 2.20e-02 | 34 |
| hsa012321 | Liver | Cirrhotic | Nucleotide metabolism | 39/2530 | 85/8465 | 1.27e-03 | 6.73e-03 | 4.15e-03 | 39 |
| hsa009831 | Liver | Cirrhotic | Drug metabolism - other enzymes | 34/2530 | 80/8465 | 1.08e-02 | 3.57e-02 | 2.20e-02 | 34 |
| hsa012322 | Liver | HCC | Nucleotide metabolism | 59/4020 | 85/8465 | 3.30e-05 | 1.88e-04 | 1.04e-04 | 59 |
| hsa009832 | Liver | HCC | Drug metabolism - other enzymes | 54/4020 | 80/8465 | 2.25e-04 | 1.09e-03 | 6.08e-04 | 54 |
| hsa012323 | Liver | HCC | Nucleotide metabolism | 59/4020 | 85/8465 | 3.30e-05 | 1.88e-04 | 1.04e-04 | 59 |
| hsa009833 | Liver | HCC | Drug metabolism - other enzymes | 54/4020 | 80/8465 | 2.25e-04 | 1.09e-03 | 6.08e-04 | 54 |
| hsa012324 | Oral cavity | OSCC | Nucleotide metabolism | 54/3704 | 85/8465 | 1.78e-04 | 5.95e-04 | 3.03e-04 | 54 |
| hsa0123211 | Oral cavity | OSCC | Nucleotide metabolism | 54/3704 | 85/8465 | 1.78e-04 | 5.95e-04 | 3.03e-04 | 54 |
| hsa0123221 | Oral cavity | LP | Nucleotide metabolism | 42/2418 | 85/8465 | 3.62e-05 | 2.36e-04 | 1.52e-04 | 42 |
| hsa0123231 | Oral cavity | LP | Nucleotide metabolism | 42/2418 | 85/8465 | 3.62e-05 | 2.36e-04 | 1.52e-04 | 42 |
| Page: 1 |
Top |
Cell-cell communication analysis |
| Identification of potential cell-cell interactions between two cell types and their ligand-receptor pairs for different disease states |
| Ligand | Receptor | LRpair | Pathway | Tissue | Disease Stage |
| Page: 1 |
Top |
Single-cell gene regulatory network inference analysis |
| Find out the significant the regulons (TFs) and the target genes of each regulon across cell types for different disease states |
| TF | Cell Type | Tissue | Disease Stage | Target Gene | RSS | Regulon Activity |
| ∗The dot plots of a searched regulon are shown for all cell subpopulations in each disease state of each tissue based on the regulon specific score inferred using pySCENIC and by calculating the average expression. |
| Page: 1 |
Top |
Somatic mutation of malignant transformation related genes |
| Annotation of somatic variants for genes involved in malignant transformation |
| Hugo Symbol | Variant Class | Variant Classification | dbSNP RS | HGVSc | HGVSp | HGVSp Short | SWISSPROT | BIOTYPE | SIFT | PolyPhen | Tumor Sample Barcode | Tissue | Histology | Sex | Age | Stage | Therapy Types | Drugs | Outcome |
| HPRT1 | insertion | In_Frame_Ins | novel | c.213_214insCAGTTTCTACAGTCTCTCTTAATATTG | p.Gly71_Tyr72insGlnPheLeuGlnSerLeuLeuIleLeu | p.G71_Y72insQFLQSLLIL | P00492 | protein_coding | TCGA-AN-A03X-01 | Breast | breast invasive carcinoma | Female | >=65 | I/II | Unknown | Unknown | SD | ||
| HPRT1 | SNV | Missense_Mutation | c.229G>A | p.Asp77Asn | p.D77N | P00492 | protein_coding | deleterious(0.04) | possibly_damaging(0.767) | TCGA-EK-A2R7-01 | Cervix | cervical & endocervical cancer | Female | <65 | I/II | Unknown | Unknown | SD | |
| HPRT1 | SNV | Missense_Mutation | novel | c.583N>A | p.Tyr195Asn | p.Y195N | P00492 | protein_coding | deleterious(0) | probably_damaging(0.976) | TCGA-AA-3947-01 | Colorectum | colon adenocarcinoma | Female | <65 | I/II | Unknown | Unknown | SD |
| HPRT1 | SNV | Missense_Mutation | rs387906725 | c.143N>A | p.Arg48His | p.R48H | P00492 | protein_coding | deleterious(0.01) | probably_damaging(0.965) | TCGA-AA-A01R-01 | Colorectum | colon adenocarcinoma | Male | <65 | III/IV | Chemotherapy | 5-fluorouracil | PD |
| HPRT1 | SNV | Missense_Mutation | rs137852484 | c.481N>T | p.Ala161Ser | p.A161S | P00492 | protein_coding | deleterious(0.01) | possibly_damaging(0.854) | TCGA-AG-3725-01 | Colorectum | rectum adenocarcinoma | Female | >=65 | III/IV | Unknown | Unknown | SD |
| HPRT1 | SNV | Missense_Mutation | novel | c.391N>G | p.Leu131Val | p.L131V | P00492 | protein_coding | deleterious(0) | benign(0.191) | TCGA-AP-A1DV-01 | Endometrium | uterine corpus endometrioid carcinoma | Female | <65 | I/II | Unknown | Unknown | SD |
| HPRT1 | SNV | Missense_Mutation | novel | c.272N>T | p.Arg91Ile | p.R91I | P00492 | protein_coding | deleterious(0.01) | benign(0.015) | TCGA-AX-A1CE-01 | Endometrium | uterine corpus endometrioid carcinoma | Female | <65 | I/II | Unspecific | Paclitaxel | SD |
| HPRT1 | SNV | Missense_Mutation | novel | c.628N>A | p.Glu210Lys | p.E210K | P00492 | protein_coding | tolerated(0.07) | benign(0.013) | TCGA-AX-A1CR-01 | Endometrium | uterine corpus endometrioid carcinoma | Female | >=65 | I/II | Chemotherapy | carboplatin | SD |
| HPRT1 | SNV | Missense_Mutation | rs387906725 | c.143G>A | p.Arg48His | p.R48H | P00492 | protein_coding | deleterious(0.01) | probably_damaging(0.965) | TCGA-B5-A3FA-01 | Endometrium | uterine corpus endometrioid carcinoma | Female | >=65 | I/II | Unknown | Unknown | SD |
| HPRT1 | SNV | Missense_Mutation | c.260N>T | p.Arg87Ile | p.R87I | P00492 | protein_coding | deleterious(0.01) | benign(0.387) | TCGA-BS-A0UF-01 | Endometrium | uterine corpus endometrioid carcinoma | Female | >=65 | I/II | Unknown | Unknown | SD |
| Page: 1 2 3 |
Top |
Related drugs of malignant transformation related genes |
| Identification of chemicals and drugs interact with genes involved in malignant transfromation |
| (DGIdb 4.0) |
| Entrez ID | Symbol | Category | Interaction Types | Drug Claim Name | Drug Name | PMIDs |
| 3251 | HPRT1 | DRUGGABLE GENOME, ENZYME | NITROSOUREAS | 3328039 | ||
| 3251 | HPRT1 | DRUGGABLE GENOME, ENZYME | Mycophenolic Acid | |||
| 3251 | HPRT1 | DRUGGABLE GENOME, ENZYME | mycophenolic acid | |||
| 3251 | HPRT1 | DRUGGABLE GENOME, ENZYME | MERCAPTOPURINE | MERCAPTOPURINE | ||
| 3251 | HPRT1 | DRUGGABLE GENOME, ENZYME | MERCAPTOPURINE | MERCAPTOPURINE | ||
| 3251 | HPRT1 | DRUGGABLE GENOME, ENZYME | 3TC | LAMIVUDINE | 17358033 |
| Page: 1 |

Copyright 2023-Present -The University of Texas Health Science Center at Houston |