
|
|||||
|
 | |
| |
| |
| |
| |
| |
|
Gene: HPN |
Gene summary for HPN |
| Gene information | Species | Human | Gene symbol | HPN | Gene ID | 3249 |
| Gene name | hepsin | |
| Gene Alias | TMPRSS1 | |
| Cytomap | 19q13.11 | |
| Gene Type | protein-coding | GO ID | GO:0000902 | UniProtAcc | A0A140VJK9 |
Top |
Malignant transformation analysis |
| Identification of the aberrant gene expression in precancerous and cancerous lesions by comparing the gene expression of stem-like cells in diseased tissues with normal stem cells |
| Entrez ID | Symbol | Replicates | Species | Organ | Tissue | Adj P-value | Log2FC | Malignancy |
| 3249 | HPN | NAFLD1 | Human | Liver | NAFLD | 3.97e-16 | 1.41e+00 | -0.04 |
| 3249 | HPN | S43 | Human | Liver | Cirrhotic | 1.63e-13 | -2.72e-01 | -0.0187 |
| 3249 | HPN | HCC1_Meng | Human | Liver | HCC | 2.76e-76 | -4.64e-02 | 0.0246 |
| 3249 | HPN | HCC2_Meng | Human | Liver | HCC | 1.48e-14 | -3.86e-01 | 0.0107 |
| 3249 | HPN | cirrhotic1 | Human | Liver | Cirrhotic | 1.03e-07 | -2.23e-01 | 0.0202 |
| 3249 | HPN | cirrhotic2 | Human | Liver | Cirrhotic | 1.02e-06 | -1.54e-01 | 0.0201 |
| 3249 | HPN | cirrhotic3 | Human | Liver | Cirrhotic | 6.16e-03 | -2.40e-01 | 0.0215 |
| 3249 | HPN | HCC2 | Human | Liver | HCC | 1.51e-15 | 3.60e+00 | 0.5341 |
| 3249 | HPN | Pt13.a | Human | Liver | HCC | 2.93e-02 | -1.33e-01 | 0.021 |
| 3249 | HPN | Pt13.b | Human | Liver | HCC | 7.69e-27 | 1.98e-02 | 0.0251 |
| 3249 | HPN | Pt14.a | Human | Liver | HCC | 6.99e-05 | 1.28e-01 | 0.0169 |
| 3249 | HPN | Pt14.b | Human | Liver | HCC | 5.71e-07 | 7.69e-02 | 0.018 |
| 3249 | HPN | S027 | Human | Liver | HCC | 4.27e-20 | 1.90e+00 | 0.2446 |
| 3249 | HPN | S028 | Human | Liver | HCC | 1.10e-38 | 1.98e+00 | 0.2503 |
| 3249 | HPN | S029 | Human | Liver | HCC | 3.43e-40 | 2.54e+00 | 0.2581 |
| 3249 | HPN | male-WTA | Human | Thyroid | PTC | 5.31e-35 | 4.60e-01 | 0.1037 |
| 3249 | HPN | PTC01 | Human | Thyroid | PTC | 7.69e-26 | 4.86e-01 | 0.1899 |
| 3249 | HPN | PTC03 | Human | Thyroid | PTC | 5.36e-04 | 3.63e-01 | 0.1784 |
| 3249 | HPN | PTC04 | Human | Thyroid | PTC | 3.27e-07 | 2.05e-01 | 0.1927 |
| 3249 | HPN | PTC05 | Human | Thyroid | PTC | 1.42e-26 | 9.08e-01 | 0.2065 |
| Page: 1 2 |
| Tissue | Expression Dynamics | Abbreviation |
| Liver | 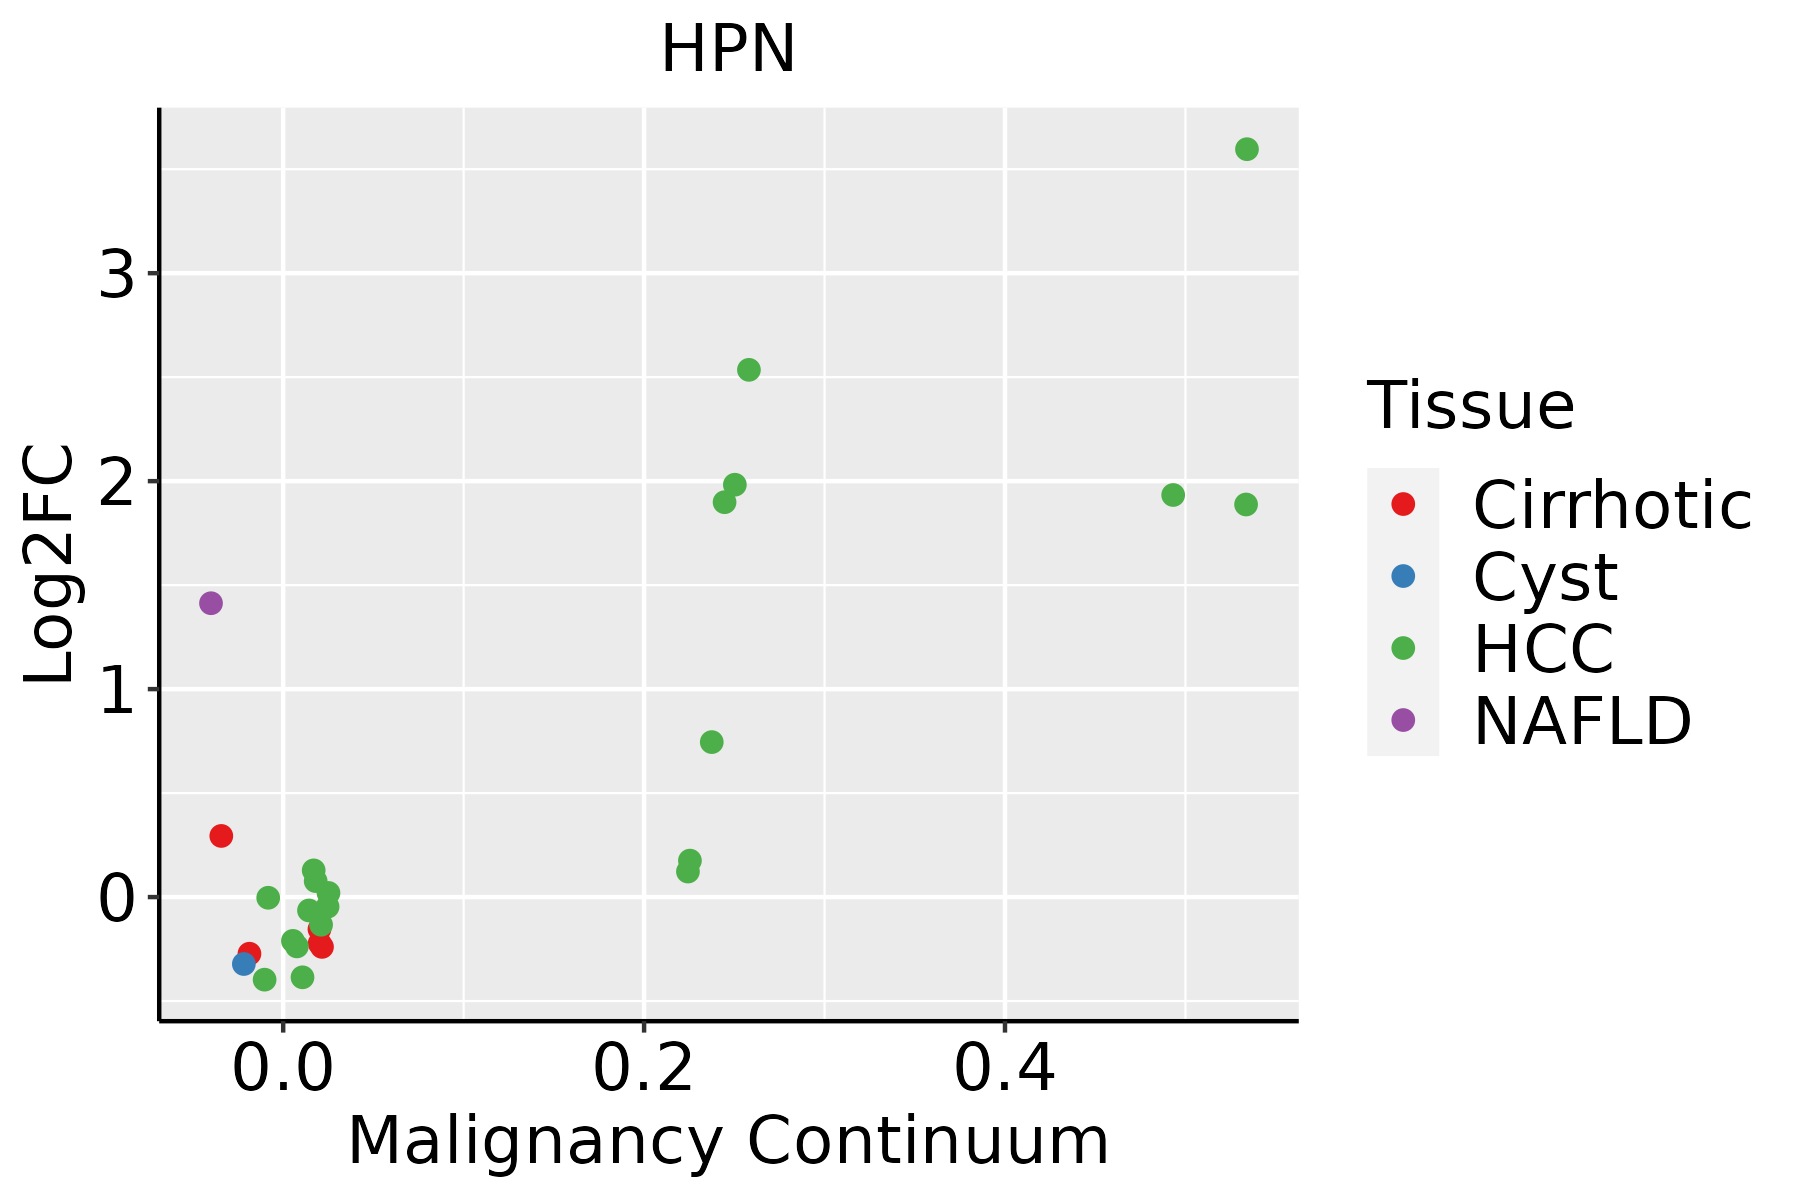 | HCC: Hepatocellular carcinoma |
| NAFLD: Non-alcoholic fatty liver disease | ||
| Prostate |  | BPH: Benign Prostatic Hyperplasia |
| Thyroid | 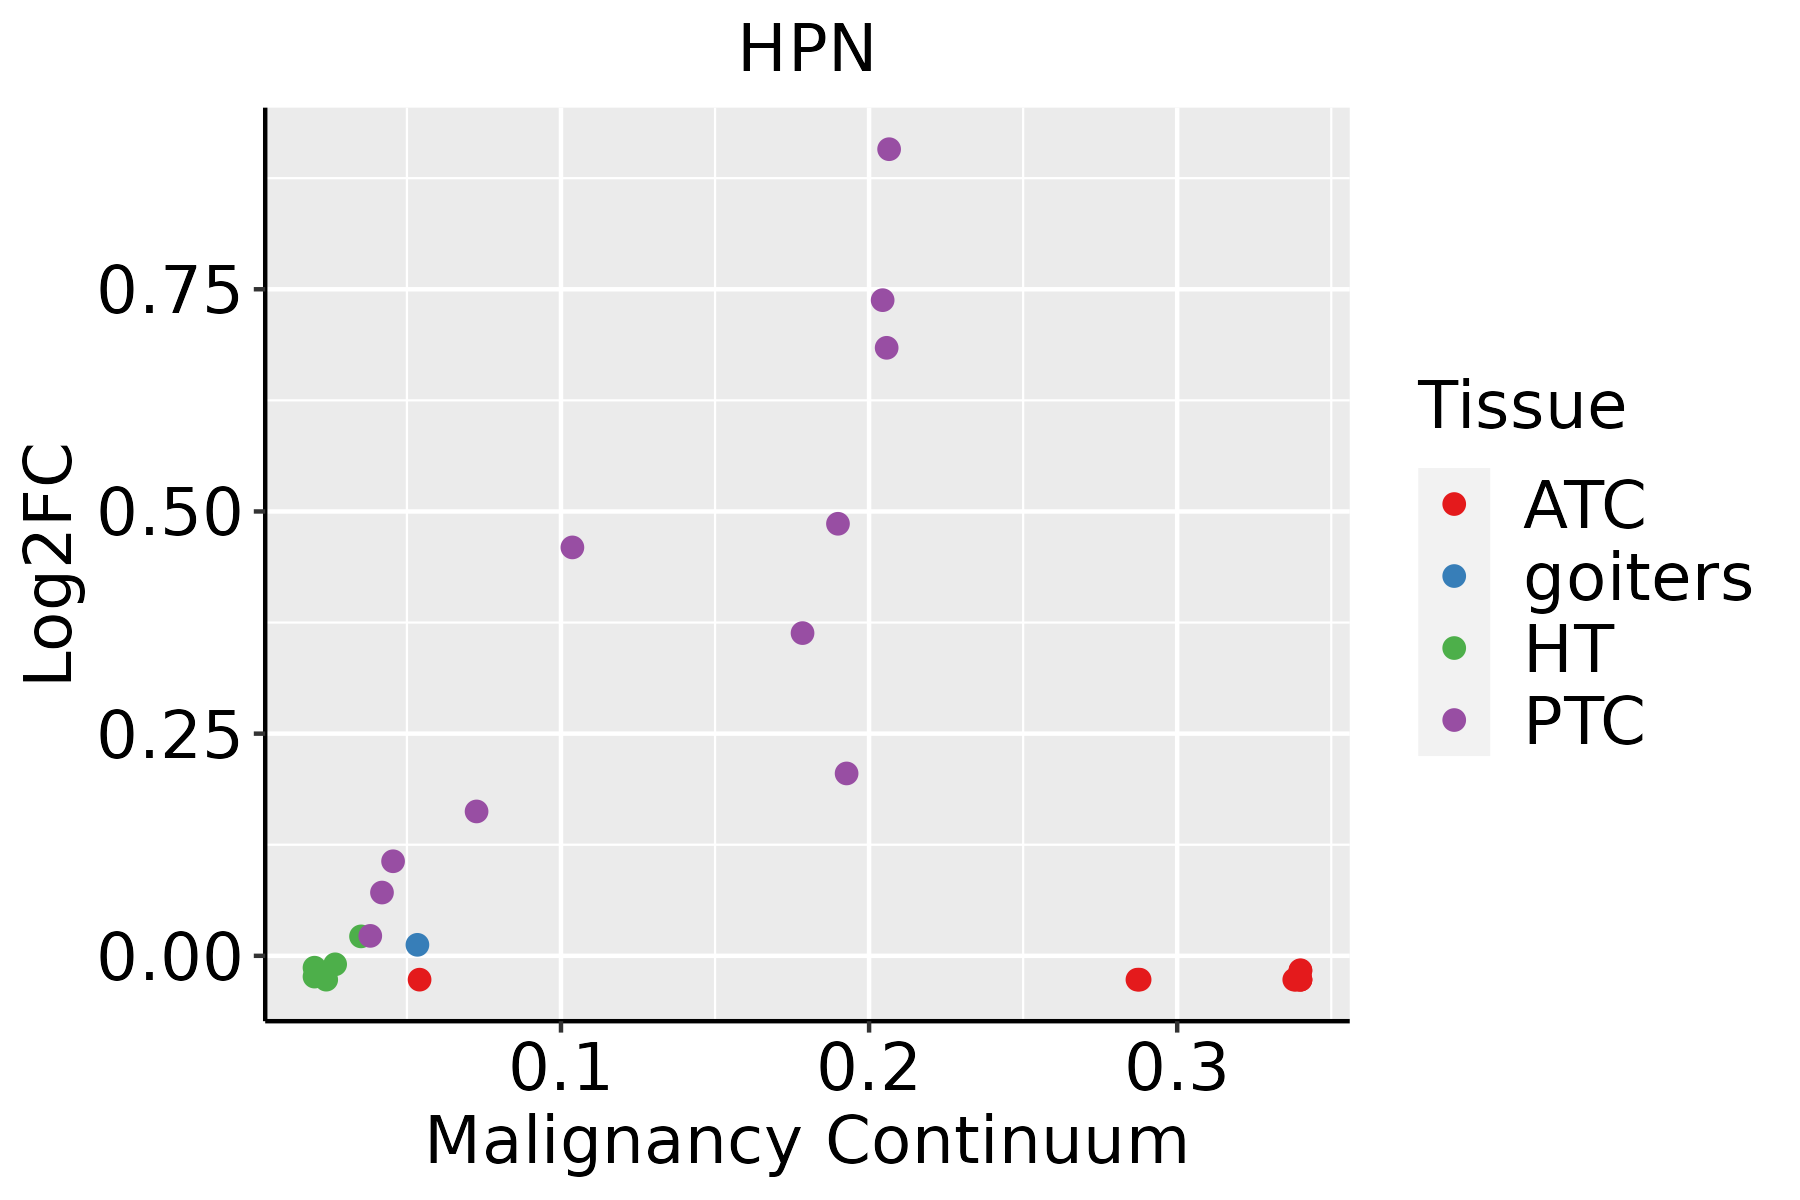 | ATC: Anaplastic thyroid cancer |
| HT: Hashimoto's thyroiditis | ||
| PTC: Papillary thyroid cancer |
| ∗log2FC in expression of this searched gene in stem-like cells from each diseased tissue sample relative to stem-like cells in normal samples in each tissue plotted against the malignancy continuum. Samples are colored based on if they are from different disease stage. |
Top |
Malignant transformation related pathway analysis |
| Find out the enriched GO biological processes and KEGG pathways involved in transition from healthy to precancer to cancer |
| Tissue | Disease Stage | Enriched GO biological Processes |
| Colorectum | AD |  |
| Colorectum | SER |  |
| Colorectum | MSS |  |
| Colorectum | MSI-H |  |
| Colorectum | FAP |  |
| ∗Top 15 enriched GO BP terms are showed in the bar plot of each disease state in each tissue. Each row represents a significant GO biological process which is colored according to the -log10(p.adjust). |
| Page: 1 2 3 4 5 6 7 8 9 |
| GO ID | Tissue | Disease Stage | Description | Gene Ratio | Bg Ratio | pvalue | p.adjust | Count |
| GO:0007015 | Colorectum | AD | actin filament organization | 167/3918 | 442/18723 | 1.65e-16 | 7.94e-14 | 167 |
| GO:1902903 | Colorectum | AD | regulation of supramolecular fiber organization | 139/3918 | 383/18723 | 2.01e-12 | 3.19e-10 | 139 |
| GO:0032970 | Colorectum | AD | regulation of actin filament-based process | 142/3918 | 397/18723 | 4.05e-12 | 5.90e-10 | 142 |
| GO:0110053 | Colorectum | AD | regulation of actin filament organization | 108/3918 | 278/18723 | 5.02e-12 | 6.98e-10 | 108 |
| GO:0032956 | Colorectum | AD | regulation of actin cytoskeleton organization | 127/3918 | 358/18723 | 1.03e-10 | 1.04e-08 | 127 |
| GO:0010639 | Colorectum | AD | negative regulation of organelle organization | 114/3918 | 348/18723 | 1.41e-07 | 6.49e-06 | 114 |
| GO:0061572 | Colorectum | AD | actin filament bundle organization | 60/3918 | 161/18723 | 1.33e-06 | 4.23e-05 | 60 |
| GO:0051017 | Colorectum | AD | actin filament bundle assembly | 58/3918 | 157/18723 | 2.74e-06 | 7.89e-05 | 58 |
| GO:1902904 | Colorectum | AD | negative regulation of supramolecular fiber organization | 60/3918 | 167/18723 | 5.23e-06 | 1.35e-04 | 60 |
| GO:0051494 | Colorectum | AD | negative regulation of cytoskeleton organization | 58/3918 | 163/18723 | 1.04e-05 | 2.40e-04 | 58 |
| GO:0031032 | Colorectum | AD | actomyosin structure organization | 65/3918 | 196/18723 | 4.17e-05 | 7.37e-04 | 65 |
| GO:0030038 | Colorectum | AD | contractile actin filament bundle assembly | 39/3918 | 106/18723 | 1.22e-04 | 1.78e-03 | 39 |
| GO:0043149 | Colorectum | AD | stress fiber assembly | 39/3918 | 106/18723 | 1.22e-04 | 1.78e-03 | 39 |
| GO:0032231 | Colorectum | AD | regulation of actin filament bundle assembly | 37/3918 | 105/18723 | 4.82e-04 | 5.27e-03 | 37 |
| GO:0110020 | Colorectum | AD | regulation of actomyosin structure organization | 35/3918 | 100/18723 | 7.78e-04 | 7.78e-03 | 35 |
| GO:0051492 | Colorectum | AD | regulation of stress fiber assembly | 32/3918 | 91/18723 | 1.17e-03 | 1.05e-02 | 32 |
| GO:0003014 | Colorectum | AD | renal system process | 35/3918 | 110/18723 | 4.85e-03 | 3.27e-02 | 35 |
| GO:00070151 | Colorectum | SER | actin filament organization | 134/2897 | 442/18723 | 1.39e-15 | 5.70e-13 | 134 |
| GO:01100531 | Colorectum | SER | regulation of actin filament organization | 91/2897 | 278/18723 | 4.33e-13 | 1.40e-10 | 91 |
| GO:19029031 | Colorectum | SER | regulation of supramolecular fiber organization | 114/2897 | 383/18723 | 7.32e-13 | 1.95e-10 | 114 |
| Page: 1 2 3 4 5 6 7 8 9 10 11 12 13 14 15 16 17 18 19 20 21 |
| Pathway ID | Tissue | Disease Stage | Description | Gene Ratio | Bg Ratio | pvalue | p.adjust | qvalue | Count |
| hsa05203 | Liver | Cirrhotic | Viral carcinogenesis | 76/2530 | 204/8465 | 1.34e-02 | 4.20e-02 | 2.59e-02 | 76 |
| hsa052031 | Liver | Cirrhotic | Viral carcinogenesis | 76/2530 | 204/8465 | 1.34e-02 | 4.20e-02 | 2.59e-02 | 76 |
| hsa052032 | Liver | HCC | Viral carcinogenesis | 117/4020 | 204/8465 | 2.68e-03 | 8.98e-03 | 5.00e-03 | 117 |
| hsa052033 | Liver | HCC | Viral carcinogenesis | 117/4020 | 204/8465 | 2.68e-03 | 8.98e-03 | 5.00e-03 | 117 |
| hsa0520323 | Prostate | Tumor | Viral carcinogenesis | 70/1791 | 204/8465 | 7.53e-06 | 6.56e-05 | 4.07e-05 | 70 |
| hsa0520333 | Prostate | Tumor | Viral carcinogenesis | 70/1791 | 204/8465 | 7.53e-06 | 6.56e-05 | 4.07e-05 | 70 |
| Page: 1 |
Top |
Cell-cell communication analysis |
| Identification of potential cell-cell interactions between two cell types and their ligand-receptor pairs for different disease states |
| Ligand | Receptor | LRpair | Pathway | Tissue | Disease Stage |
| Page: 1 |
Top |
Single-cell gene regulatory network inference analysis |
| Find out the significant the regulons (TFs) and the target genes of each regulon across cell types for different disease states |
| TF | Cell Type | Tissue | Disease Stage | Target Gene | RSS | Regulon Activity |
| ∗The dot plots of a searched regulon are shown for all cell subpopulations in each disease state of each tissue based on the regulon specific score inferred using pySCENIC and by calculating the average expression. |
| Page: 1 |
Top |
Somatic mutation of malignant transformation related genes |
| Annotation of somatic variants for genes involved in malignant transformation |
| Hugo Symbol | Variant Class | Variant Classification | dbSNP RS | HGVSc | HGVSp | HGVSp Short | SWISSPROT | BIOTYPE | SIFT | PolyPhen | Tumor Sample Barcode | Tissue | Histology | Sex | Age | Stage | Therapy Types | Drugs | Outcome |
| HPN | SNV | Missense_Mutation | novel | c.1232N>A | p.Ser411Asn | p.S411N | P05981 | protein_coding | tolerated(0.22) | benign(0) | TCGA-AN-A0AK-01 | Breast | breast invasive carcinoma | Female | >=65 | I/II | Unknown | Unknown | SD |
| HPN | SNV | Missense_Mutation | c.721N>T | p.Gly241Trp | p.G241W | P05981 | protein_coding | deleterious(0) | probably_damaging(0.992) | TCGA-EW-A6S9-01 | Breast | breast invasive carcinoma | Female | <65 | I/II | Unknown | Unknown | SD | |
| HPN | SNV | Missense_Mutation | rs751620154 | c.484N>T | p.Arg162Cys | p.R162C | P05981 | protein_coding | deleterious(0) | probably_damaging(0.961) | TCGA-PE-A5DD-01 | Breast | breast invasive carcinoma | Female | <65 | I/II | Chemotherapy | CR | |
| HPN | SNV | Missense_Mutation | novel | c.281G>T | p.Gly94Val | p.G94V | P05981 | protein_coding | deleterious(0) | probably_damaging(1) | TCGA-S3-AA10-01 | Breast | breast invasive carcinoma | Female | >=65 | I/II | Chemotherapy | cytoxan | CR |
| HPN | insertion | Frame_Shift_Ins | novel | c.105_118+8dupATCCTGGGCCATTGGTGAGAGC | P05981 | protein_coding | TCGA-B6-A0I6-01 | Breast | breast invasive carcinoma | Female | <65 | I/II | Unknown | Unknown | PD | ||||
| HPN | SNV | Missense_Mutation | novel | c.407N>T | p.Ser136Phe | p.S136F | P05981 | protein_coding | tolerated(0.68) | benign(0.007) | TCGA-2W-A8YY-01 | Cervix | cervical & endocervical cancer | Female | <65 | I/II | Chemotherapy | cisplatin | CR |
| HPN | SNV | Missense_Mutation | rs753366151 | c.1223N>T | p.Ser408Phe | p.S408F | P05981 | protein_coding | deleterious(0.02) | possibly_damaging(0.806) | TCGA-EK-A3GM-01 | Cervix | cervical & endocervical cancer | Female | >=65 | I/II | Unknown | Unknown | SD |
| HPN | SNV | Missense_Mutation | c.341C>T | p.Thr114Met | p.T114M | P05981 | protein_coding | deleterious(0.01) | probably_damaging(0.979) | TCGA-AA-3489-01 | Colorectum | colon adenocarcinoma | Male | >=65 | I/II | Unknown | Unknown | PD | |
| HPN | SNV | Missense_Mutation | rs374894952 | c.641N>A | p.Arg214Gln | p.R214Q | P05981 | protein_coding | tolerated(0.07) | benign(0.089) | TCGA-CA-6718-01 | Colorectum | colon adenocarcinoma | Male | <65 | I/II | Unknown | Unknown | PD |
| HPN | SNV | Missense_Mutation | c.112G>C | p.Ala38Pro | p.A38P | P05981 | protein_coding | deleterious(0.01) | possibly_damaging(0.694) | TCGA-CM-6171-01 | Colorectum | colon adenocarcinoma | Female | >=65 | I/II | Unknown | Unknown | SD |
| Page: 1 2 3 4 5 6 |
Top |
Related drugs of malignant transformation related genes |
| Identification of chemicals and drugs interact with genes involved in malignant transfromation |
| (DGIdb 4.0) |
| Entrez ID | Symbol | Category | Interaction Types | Drug Claim Name | Drug Name | PMIDs |
| 3249 | HPN | DRUGGABLE GENOME, PROTEASE, CELL SURFACE | BENTIROMIDE | BENTIROMIDE | ||
| 3249 | HPN | DRUGGABLE GENOME, PROTEASE, CELL SURFACE | AC1LFXA6 | |||
| 3249 | HPN | DRUGGABLE GENOME, PROTEASE, CELL SURFACE | N-Methyl-D-aspartic acid | |||
| 3249 | HPN | DRUGGABLE GENOME, PROTEASE, CELL SURFACE | Meclizine | MECLIZINE | ||
| 3249 | HPN | DRUGGABLE GENOME, PROTEASE, CELL SURFACE | BENTIROMIDE | BENTIROMIDE |
| Page: 1 |

Copyright 2023-Present -The University of Texas Health Science Center at Houston |