
|
|||||
|
 | |
| |
| |
| |
| |
| |
|
Gene: HPF1 |
Gene summary for HPF1 |
| Gene information | Species | Human | Gene symbol | HPF1 | Gene ID | 54969 |
| Gene name | histone PARylation factor 1 | |
| Gene Alias | C4orf27 | |
| Cytomap | 4q33 | |
| Gene Type | protein-coding | GO ID | GO:0006139 | UniProtAcc | Q9NWY4 |
Top |
Malignant transformation analysis |
| Identification of the aberrant gene expression in precancerous and cancerous lesions by comparing the gene expression of stem-like cells in diseased tissues with normal stem cells |
| Entrez ID | Symbol | Replicates | Species | Organ | Tissue | Adj P-value | Log2FC | Malignancy |
| 54969 | HPF1 | HCC2 | Human | Liver | HCC | 2.48e-26 | 3.66e+00 | 0.5341 |
| 54969 | HPF1 | S014 | Human | Liver | HCC | 1.94e-11 | 4.64e-01 | 0.2254 |
| 54969 | HPF1 | S015 | Human | Liver | HCC | 1.34e-12 | 3.97e-01 | 0.2375 |
| 54969 | HPF1 | S016 | Human | Liver | HCC | 3.25e-17 | 4.38e-01 | 0.2243 |
| 54969 | HPF1 | S027 | Human | Liver | HCC | 1.17e-06 | 5.11e-01 | 0.2446 |
| 54969 | HPF1 | S028 | Human | Liver | HCC | 1.16e-19 | 6.64e-01 | 0.2503 |
| 54969 | HPF1 | S029 | Human | Liver | HCC | 9.28e-21 | 7.42e-01 | 0.2581 |
| 54969 | HPF1 | male-WTA | Human | Thyroid | PTC | 3.43e-08 | -3.10e-03 | 0.1037 |
| 54969 | HPF1 | PTC01 | Human | Thyroid | PTC | 1.68e-16 | 1.01e-01 | 0.1899 |
| 54969 | HPF1 | PTC04 | Human | Thyroid | PTC | 8.68e-08 | 1.51e-02 | 0.1927 |
| 54969 | HPF1 | PTC05 | Human | Thyroid | PTC | 3.70e-15 | 5.33e-01 | 0.2065 |
| 54969 | HPF1 | PTC06 | Human | Thyroid | PTC | 1.87e-27 | 5.15e-01 | 0.2057 |
| 54969 | HPF1 | PTC07 | Human | Thyroid | PTC | 2.26e-22 | 3.41e-01 | 0.2044 |
| 54969 | HPF1 | ATC09 | Human | Thyroid | ATC | 1.27e-02 | 2.19e-01 | 0.2871 |
| 54969 | HPF1 | ATC11 | Human | Thyroid | ATC | 4.94e-05 | 5.36e-01 | 0.3386 |
| 54969 | HPF1 | ATC12 | Human | Thyroid | ATC | 8.70e-11 | 1.75e-01 | 0.34 |
| 54969 | HPF1 | ATC13 | Human | Thyroid | ATC | 2.42e-14 | 1.48e-01 | 0.34 |
| 54969 | HPF1 | ATC1 | Human | Thyroid | ATC | 4.78e-03 | 2.44e-01 | 0.2878 |
| 54969 | HPF1 | ATC2 | Human | Thyroid | ATC | 9.00e-07 | 1.05e+00 | 0.34 |
| 54969 | HPF1 | ATC3 | Human | Thyroid | ATC | 3.53e-02 | 3.46e-01 | 0.338 |
| Page: 1 2 |
| Tissue | Expression Dynamics | Abbreviation |
| Liver |  | HCC: Hepatocellular carcinoma |
| NAFLD: Non-alcoholic fatty liver disease | ||
| Thyroid | 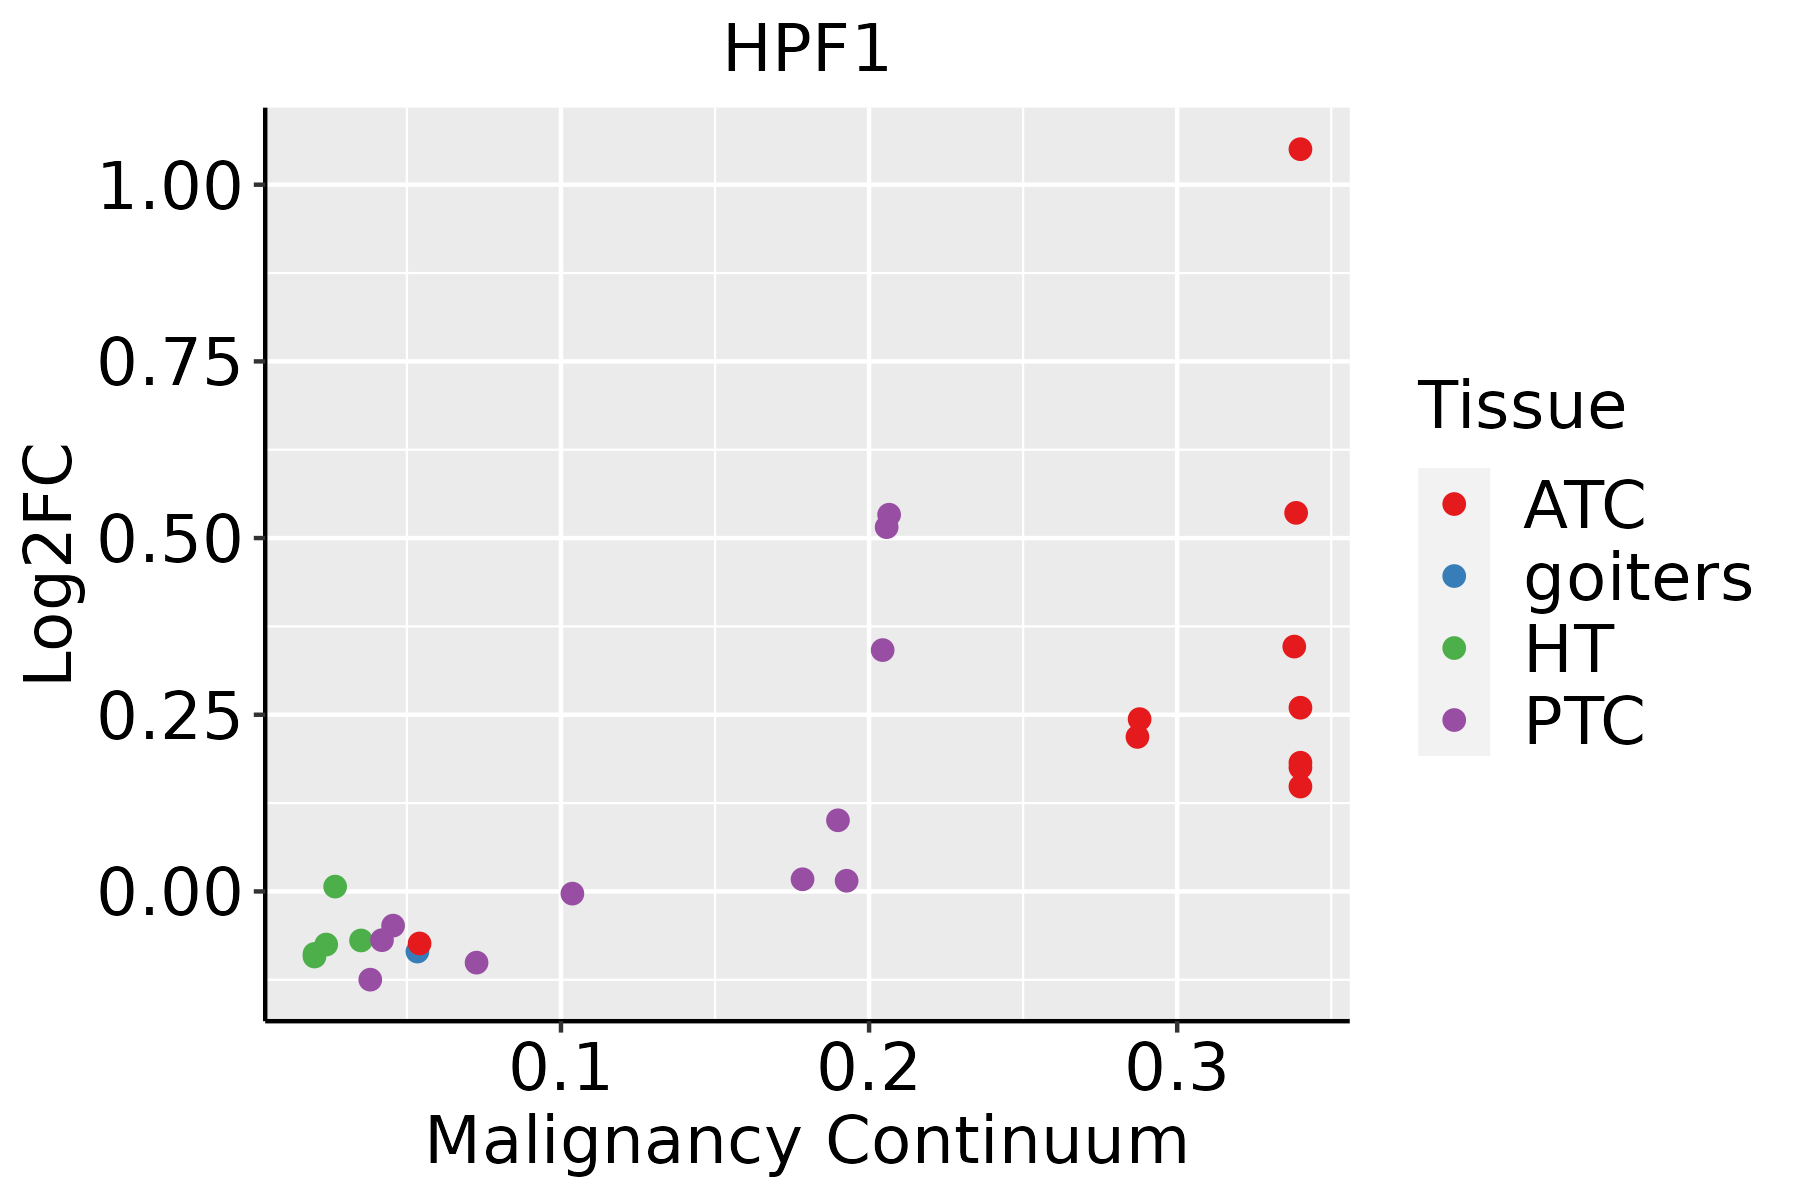 | ATC: Anaplastic thyroid cancer |
| HT: Hashimoto's thyroiditis | ||
| PTC: Papillary thyroid cancer |
| ∗log2FC in expression of this searched gene in stem-like cells from each diseased tissue sample relative to stem-like cells in normal samples in each tissue plotted against the malignancy continuum. Samples are colored based on if they are from different disease stage. |
Top |
Malignant transformation related pathway analysis |
| Find out the enriched GO biological processes and KEGG pathways involved in transition from healthy to precancer to cancer |
| Tissue | Disease Stage | Enriched GO biological Processes |
| Colorectum | AD |  |
| Colorectum | SER |  |
| Colorectum | MSS |  |
| Colorectum | MSI-H |  |
| Colorectum | FAP |  |
| ∗Top 15 enriched GO BP terms are showed in the bar plot of each disease state in each tissue. Each row represents a significant GO biological process which is colored according to the -log10(p.adjust). |
| Page: 1 2 3 4 5 6 7 8 9 |
| GO ID | Tissue | Disease Stage | Description | Gene Ratio | Bg Ratio | pvalue | p.adjust | Count |
| GO:001657021 | Liver | HCC | histone modification | 283/7958 | 463/18723 | 2.68e-16 | 2.33e-14 | 283 |
| GO:003105621 | Liver | HCC | regulation of histone modification | 99/7958 | 152/18723 | 1.40e-08 | 3.40e-07 | 99 |
| GO:001820911 | Liver | HCC | peptidyl-serine modification | 177/7958 | 338/18723 | 1.45e-04 | 1.17e-03 | 177 |
| GO:00063021 | Liver | HCC | double-strand break repair | 131/7958 | 251/18723 | 1.17e-03 | 6.54e-03 | 131 |
| GO:001657010 | Thyroid | PTC | histone modification | 235/5968 | 463/18723 | 1.17e-17 | 1.15e-15 | 235 |
| GO:003105610 | Thyroid | PTC | regulation of histone modification | 83/5968 | 152/18723 | 5.19e-09 | 1.34e-07 | 83 |
| GO:001820916 | Thyroid | PTC | peptidyl-serine modification | 151/5968 | 338/18723 | 4.61e-07 | 7.51e-06 | 151 |
| GO:00063026 | Thyroid | PTC | double-strand break repair | 103/5968 | 251/18723 | 1.30e-03 | 7.40e-03 | 103 |
| GO:00064712 | Thyroid | PTC | protein ADP-ribosylation | 18/5968 | 35/18723 | 1.26e-02 | 4.90e-02 | 18 |
| GO:001657017 | Thyroid | ATC | histone modification | 243/6293 | 463/18723 | 2.23e-17 | 2.27e-15 | 243 |
| GO:003105616 | Thyroid | ATC | regulation of histone modification | 85/6293 | 152/18723 | 1.23e-08 | 2.55e-07 | 85 |
| GO:001820917 | Thyroid | ATC | peptidyl-serine modification | 161/6293 | 338/18723 | 5.23e-08 | 9.44e-07 | 161 |
| GO:000630212 | Thyroid | ATC | double-strand break repair | 110/6293 | 251/18723 | 4.48e-04 | 2.65e-03 | 110 |
| GO:00064711 | Thyroid | ATC | protein ADP-ribosylation | 19/6293 | 35/18723 | 9.36e-03 | 3.44e-02 | 19 |
| Page: 1 |
| Pathway ID | Tissue | Disease Stage | Description | Gene Ratio | Bg Ratio | pvalue | p.adjust | qvalue | Count |
| Page: 1 |
Top |
Cell-cell communication analysis |
| Identification of potential cell-cell interactions between two cell types and their ligand-receptor pairs for different disease states |
| Ligand | Receptor | LRpair | Pathway | Tissue | Disease Stage |
| Page: 1 |
Top |
Single-cell gene regulatory network inference analysis |
| Find out the significant the regulons (TFs) and the target genes of each regulon across cell types for different disease states |
| TF | Cell Type | Tissue | Disease Stage | Target Gene | RSS | Regulon Activity |
| ∗The dot plots of a searched regulon are shown for all cell subpopulations in each disease state of each tissue based on the regulon specific score inferred using pySCENIC and by calculating the average expression. |
| Page: 1 |
Top |
Somatic mutation of malignant transformation related genes |
| Annotation of somatic variants for genes involved in malignant transformation |
| Hugo Symbol | Variant Class | Variant Classification | dbSNP RS | HGVSc | HGVSp | HGVSp Short | SWISSPROT | BIOTYPE | SIFT | PolyPhen | Tumor Sample Barcode | Tissue | Histology | Sex | Age | Stage | Therapy Types | Drugs | Outcome |
| HPF1 | SNV | Missense_Mutation | c.540N>C | p.Lys180Asn | p.K180N | Q9NWY4 | protein_coding | deleterious(0.03) | possibly_damaging(0.513) | TCGA-AC-A23H-01 | Breast | breast invasive carcinoma | Female | >=65 | I/II | Unknown | Unknown | PD | |
| HPF1 | SNV | Missense_Mutation | c.157N>A | p.Phe53Ile | p.F53I | Q9NWY4 | protein_coding | deleterious(0.01) | possibly_damaging(0.7) | TCGA-D8-A1XK-01 | Breast | breast invasive carcinoma | Female | <65 | I/II | Chemotherapy | doxorubicine+cyclophosphamide | SD | |
| HPF1 | insertion | Frame_Shift_Ins | novel | c.213_214insACCTTCCCTAGGATGGGTAAACT | p.Leu72ThrfsTer17 | p.L72Tfs*17 | Q9NWY4 | protein_coding | TCGA-BH-A0EE-01 | Breast | breast invasive carcinoma | Female | >=65 | I/II | Chemotherapy | docetaxel | SD | ||
| HPF1 | SNV | Missense_Mutation | novel | c.173N>C | p.Lys58Thr | p.K58T | Q9NWY4 | protein_coding | tolerated(0.07) | benign(0.003) | TCGA-AA-3947-01 | Colorectum | colon adenocarcinoma | Female | <65 | I/II | Unknown | Unknown | SD |
| HPF1 | SNV | Missense_Mutation | rs766910277 | c.518N>G | p.Leu173Arg | p.L173R | Q9NWY4 | protein_coding | tolerated(0.11) | benign(0.376) | TCGA-CA-6717-01 | Colorectum | colon adenocarcinoma | Male | <65 | I/II | Chemotherapy | oxaliplatin | CR |
| HPF1 | SNV | Missense_Mutation | novel | c.542A>G | p.Lys181Arg | p.K181R | Q9NWY4 | protein_coding | tolerated(0.09) | benign(0.105) | TCGA-F5-6814-01 | Colorectum | rectum adenocarcinoma | Male | <65 | I/II | Unknown | Unknown | SD |
| HPF1 | SNV | Missense_Mutation | novel | c.364G>T | p.Asp122Tyr | p.D122Y | Q9NWY4 | protein_coding | deleterious(0) | probably_damaging(0.982) | TCGA-F5-6814-01 | Colorectum | rectum adenocarcinoma | Male | <65 | I/II | Unknown | Unknown | SD |
| HPF1 | SNV | Missense_Mutation | novel | c.1003A>G | p.Asn335Asp | p.N335D | Q9NWY4 | protein_coding | tolerated(0.4) | benign(0) | TCGA-A5-A0G1-01 | Endometrium | uterine corpus endometrioid carcinoma | Female | >=65 | I/II | Unknown | Unknown | SD |
| HPF1 | SNV | Missense_Mutation | novel | c.881G>A | p.Gly294Glu | p.G294E | Q9NWY4 | protein_coding | deleterious(0.02) | possibly_damaging(0.879) | TCGA-A5-A0G2-01 | Endometrium | uterine corpus endometrioid carcinoma | Female | <65 | III/IV | Unknown | Unknown | SD |
| HPF1 | SNV | Missense_Mutation | novel | c.821N>G | p.Met274Arg | p.M274R | Q9NWY4 | protein_coding | deleterious(0) | possibly_damaging(0.828) | TCGA-A5-A2K5-01 | Endometrium | uterine corpus endometrioid carcinoma | Female | >=65 | I/II | Unknown | Unknown | SD |
| Page: 1 2 3 4 |
Top |
Related drugs of malignant transformation related genes |
| Identification of chemicals and drugs interact with genes involved in malignant transfromation |
| (DGIdb 4.0) |
| Entrez ID | Symbol | Category | Interaction Types | Drug Claim Name | Drug Name | PMIDs |
| Page: 1 |

Copyright 2023-Present -The University of Texas Health Science Center at Houston |