
|
|||||
|
 | |
| |
| |
| |
| |
| |
|
Gene: HPD |
Gene summary for HPD |
| Gene information | Species | Human | Gene symbol | HPD | Gene ID | 3242 |
| Gene name | 4-hydroxyphenylpyruvate dioxygenase | |
| Gene Alias | 4-HPPD | |
| Cytomap | 12q24.31 | |
| Gene Type | protein-coding | GO ID | GO:0006082 | UniProtAcc | P32754 |
Top |
Malignant transformation analysis |
| Identification of the aberrant gene expression in precancerous and cancerous lesions by comparing the gene expression of stem-like cells in diseased tissues with normal stem cells |
| Entrez ID | Symbol | Replicates | Species | Organ | Tissue | Adj P-value | Log2FC | Malignancy |
| 3242 | HPD | NAFLD1 | Human | Liver | NAFLD | 1.37e-04 | 7.47e-01 | -0.04 |
| 3242 | HPD | S43 | Human | Liver | Cirrhotic | 3.14e-07 | 1.20e-01 | -0.0187 |
| 3242 | HPD | S44 | Human | Liver | HCC | 1.53e-33 | 1.99e+00 | -0.0083 |
| 3242 | HPD | HCC1_Meng | Human | Liver | HCC | 5.06e-16 | -1.44e-01 | 0.0246 |
| 3242 | HPD | HCC2_Meng | Human | Liver | HCC | 1.05e-09 | -2.51e-01 | 0.0107 |
| 3242 | HPD | HCC1 | Human | Liver | HCC | 8.36e-03 | 2.79e+00 | 0.5336 |
| 3242 | HPD | HCC5 | Human | Liver | HCC | 1.77e-04 | 3.98e+00 | 0.4932 |
| 3242 | HPD | Pt13.a | Human | Liver | HCC | 7.90e-35 | 9.20e-01 | 0.021 |
| 3242 | HPD | Pt13.b | Human | Liver | HCC | 9.78e-63 | 1.04e+00 | 0.0251 |
| 3242 | HPD | Pt14.b | Human | Liver | HCC | 8.61e-23 | 1.14e+00 | 0.018 |
| 3242 | HPD | Pt14.c | Human | Liver | HCC | 6.66e-15 | 1.06e+00 | 0.0054 |
| 3242 | HPD | Pt14.d | Human | Liver | HCC | 2.38e-04 | 3.52e-01 | 0.0143 |
| 3242 | HPD | S027 | Human | Liver | HCC | 6.90e-09 | 1.96e+00 | 0.2446 |
| 3242 | HPD | S028 | Human | Liver | HCC | 3.62e-23 | 1.70e+00 | 0.2503 |
| 3242 | HPD | S029 | Human | Liver | HCC | 5.23e-33 | 2.46e+00 | 0.2581 |
| Page: 1 |
| Tissue | Expression Dynamics | Abbreviation |
| Liver | 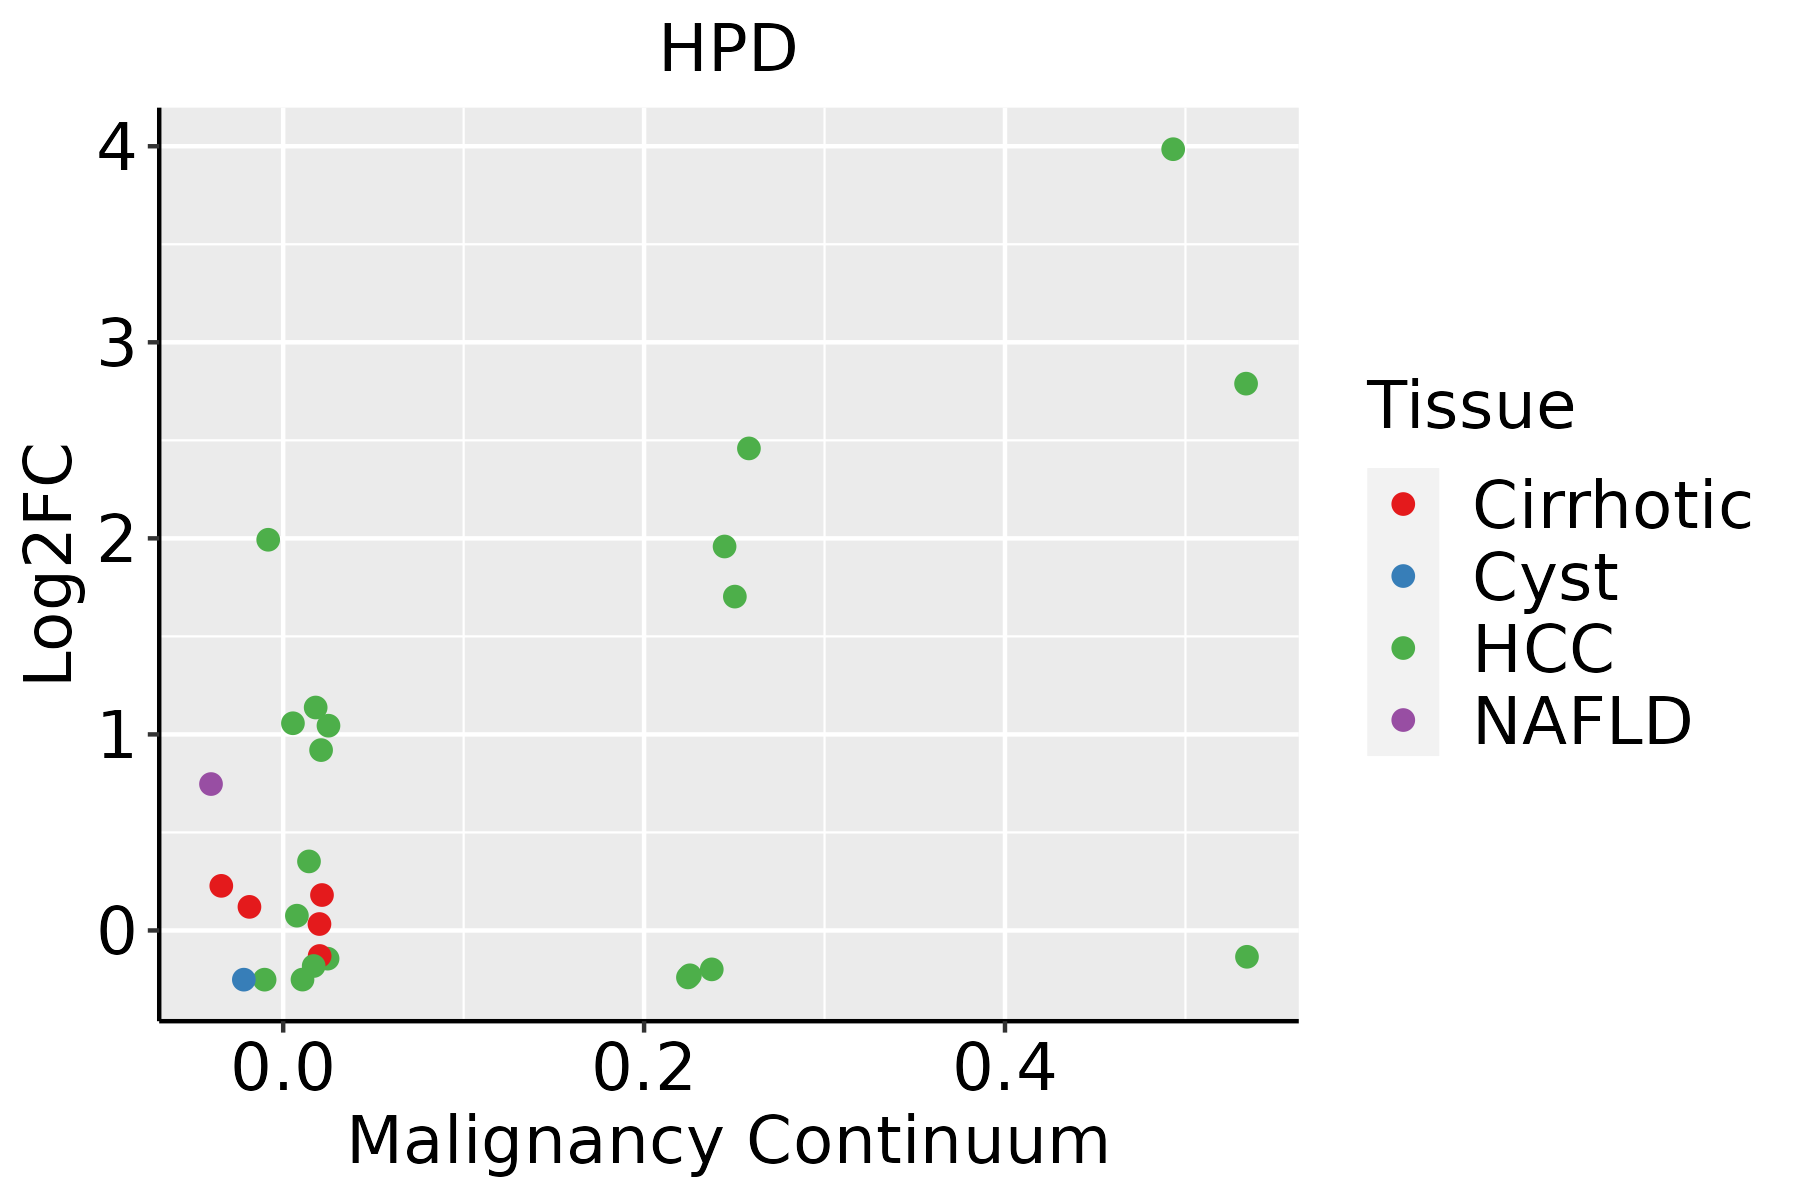 | HCC: Hepatocellular carcinoma |
| NAFLD: Non-alcoholic fatty liver disease |
| ∗log2FC in expression of this searched gene in stem-like cells from each diseased tissue sample relative to stem-like cells in normal samples in each tissue plotted against the malignancy continuum. Samples are colored based on if they are from different disease stage. |
Top |
Malignant transformation related pathway analysis |
| Find out the enriched GO biological processes and KEGG pathways involved in transition from healthy to precancer to cancer |
| Tissue | Disease Stage | Enriched GO biological Processes |
| Colorectum | AD |  |
| Colorectum | SER |  |
| Colorectum | MSS |  |
| Colorectum | MSI-H |  |
| Colorectum | FAP |  |
| ∗Top 15 enriched GO BP terms are showed in the bar plot of each disease state in each tissue. Each row represents a significant GO biological process which is colored according to the -log10(p.adjust). |
| Page: 1 2 3 4 5 6 7 8 9 |
| GO ID | Tissue | Disease Stage | Description | Gene Ratio | Bg Ratio | pvalue | p.adjust | Count |
| GO:00463953 | Liver | NAFLD | carboxylic acid catabolic process | 73/1882 | 236/18723 | 4.16e-19 | 1.22e-15 | 73 |
| GO:00160544 | Liver | NAFLD | organic acid catabolic process | 73/1882 | 240/18723 | 1.20e-18 | 2.34e-15 | 73 |
| GO:00442825 | Liver | NAFLD | small molecule catabolic process | 91/1882 | 376/18723 | 8.96e-16 | 1.31e-12 | 91 |
| GO:00194396 | Liver | NAFLD | aromatic compound catabolic process | 102/1882 | 467/18723 | 2.29e-14 | 1.91e-11 | 102 |
| GO:19013616 | Liver | NAFLD | organic cyclic compound catabolic process | 105/1882 | 495/18723 | 7.04e-14 | 5.15e-11 | 105 |
| GO:0009063 | Liver | NAFLD | cellular amino acid catabolic process | 36/1882 | 110/18723 | 6.56e-11 | 1.99e-08 | 36 |
| GO:00065203 | Liver | NAFLD | cellular amino acid metabolic process | 63/1882 | 284/18723 | 1.14e-09 | 2.17e-07 | 63 |
| GO:19016053 | Liver | NAFLD | alpha-amino acid metabolic process | 46/1882 | 195/18723 | 2.74e-08 | 2.86e-06 | 46 |
| GO:1901606 | Liver | NAFLD | alpha-amino acid catabolic process | 25/1882 | 87/18723 | 8.67e-07 | 4.60e-05 | 25 |
| GO:0009074 | Liver | NAFLD | aromatic amino acid family catabolic process | 8/1882 | 16/18723 | 6.30e-05 | 1.37e-03 | 8 |
| GO:0009072 | Liver | NAFLD | aromatic amino acid family metabolic process | 9/1882 | 30/18723 | 2.07e-03 | 2.05e-02 | 9 |
| GO:190136111 | Liver | Cirrhotic | organic cyclic compound catabolic process | 213/4634 | 495/18723 | 1.58e-19 | 3.67e-17 | 213 |
| GO:001943911 | Liver | Cirrhotic | aromatic compound catabolic process | 202/4634 | 467/18723 | 6.93e-19 | 1.28e-16 | 202 |
| GO:004428211 | Liver | Cirrhotic | small molecule catabolic process | 151/4634 | 376/18723 | 2.20e-11 | 1.34e-09 | 151 |
| GO:001605411 | Liver | Cirrhotic | organic acid catabolic process | 104/4634 | 240/18723 | 1.91e-10 | 9.53e-09 | 104 |
| GO:004639511 | Liver | Cirrhotic | carboxylic acid catabolic process | 102/4634 | 236/18723 | 3.41e-10 | 1.63e-08 | 102 |
| GO:19016051 | Liver | Cirrhotic | alpha-amino acid metabolic process | 82/4634 | 195/18723 | 7.72e-08 | 2.30e-06 | 82 |
| GO:00090631 | Liver | Cirrhotic | cellular amino acid catabolic process | 49/4634 | 110/18723 | 4.47e-06 | 7.42e-05 | 49 |
| GO:000652011 | Liver | Cirrhotic | cellular amino acid metabolic process | 103/4634 | 284/18723 | 8.88e-06 | 1.30e-04 | 103 |
| GO:19016061 | Liver | Cirrhotic | alpha-amino acid catabolic process | 36/4634 | 87/18723 | 4.69e-04 | 3.78e-03 | 36 |
| Page: 1 2 |
| Pathway ID | Tissue | Disease Stage | Description | Gene Ratio | Bg Ratio | pvalue | p.adjust | qvalue | Count |
| hsa01240 | Liver | Cirrhotic | Biosynthesis of cofactors | 66/2530 | 153/8465 | 3.11e-04 | 1.99e-03 | 1.23e-03 | 66 |
| hsa012401 | Liver | Cirrhotic | Biosynthesis of cofactors | 66/2530 | 153/8465 | 3.11e-04 | 1.99e-03 | 1.23e-03 | 66 |
| hsa012402 | Liver | HCC | Biosynthesis of cofactors | 103/4020 | 153/8465 | 4.67e-07 | 5.05e-06 | 2.81e-06 | 103 |
| hsa012403 | Liver | HCC | Biosynthesis of cofactors | 103/4020 | 153/8465 | 4.67e-07 | 5.05e-06 | 2.81e-06 | 103 |
| Page: 1 |
Top |
Cell-cell communication analysis |
| Identification of potential cell-cell interactions between two cell types and their ligand-receptor pairs for different disease states |
| Ligand | Receptor | LRpair | Pathway | Tissue | Disease Stage |
| Page: 1 |
Top |
Single-cell gene regulatory network inference analysis |
| Find out the significant the regulons (TFs) and the target genes of each regulon across cell types for different disease states |
| TF | Cell Type | Tissue | Disease Stage | Target Gene | RSS | Regulon Activity |
| ∗The dot plots of a searched regulon are shown for all cell subpopulations in each disease state of each tissue based on the regulon specific score inferred using pySCENIC and by calculating the average expression. |
| Page: 1 |
Top |
Somatic mutation of malignant transformation related genes |
| Annotation of somatic variants for genes involved in malignant transformation |
| Hugo Symbol | Variant Class | Variant Classification | dbSNP RS | HGVSc | HGVSp | HGVSp Short | SWISSPROT | BIOTYPE | SIFT | PolyPhen | Tumor Sample Barcode | Tissue | Histology | Sex | Age | Stage | Therapy Types | Drugs | Outcome |
| HPD | SNV | Missense_Mutation | c.328N>A | p.Ala110Thr | p.A110T | protein_coding | tolerated(0.24) | probably_damaging(0.999) | TCGA-A2-A25E-01 | Breast | breast invasive carcinoma | Female | <65 | III/IV | Chemotherapy | cytoxan | PD | ||
| HPD | SNV | Missense_Mutation | novel | c.640N>T | p.Asp214Tyr | p.D214Y | protein_coding | deleterious(0) | probably_damaging(0.997) | TCGA-AN-A046-01 | Breast | breast invasive carcinoma | Female | >=65 | I/II | Unknown | Unknown | SD | |
| HPD | SNV | Missense_Mutation | rs752018560 | c.476N>A | p.Gly159Glu | p.G159E | protein_coding | deleterious(0.01) | possibly_damaging(0.857) | TCGA-AR-A0U3-01 | Breast | breast invasive carcinoma | Female | <65 | I/II | Chemotherapy | doxorubicin | SD | |
| HPD | SNV | Missense_Mutation | c.1016C>T | p.Pro339Leu | p.P339L | protein_coding | deleterious(0.01) | benign(0.383) | TCGA-E9-A1RF-01 | Breast | breast invasive carcinoma | Female | >=65 | III/IV | Hormone Therapy | tamoxiphen | SD | ||
| HPD | insertion | Frame_Shift_Ins | novel | c.17_18insGCCTGGGCGACAGAGCAAGACTC | p.Asp6GlufsTer25 | p.D6Efs*25 | protein_coding | TCGA-A8-A09B-01 | Breast | breast invasive carcinoma | Female | <65 | III/IV | Chemotherapy | 5-fluorouracil | SD | |||
| HPD | insertion | Frame_Shift_Ins | novel | c.796_797insCTCCCAATGTG | p.His266ProfsTer20 | p.H266Pfs*20 | protein_coding | TCGA-AR-A0TY-01 | Breast | breast invasive carcinoma | Female | <65 | I/II | Unspecific | Paclitaxel | PD | |||
| HPD | insertion | In_Frame_Ins | novel | c.794_795insACCTCGTGATCACCCATCTTG | p.Gln265_His266insProArgAspHisProSerTrp | p.Q265_H266insPRDHPSW | protein_coding | TCGA-AR-A0TY-01 | Breast | breast invasive carcinoma | Female | <65 | I/II | Unspecific | Paclitaxel | PD | |||
| HPD | SNV | Missense_Mutation | c.1114G>C | p.Glu372Gln | p.E372Q | protein_coding | deleterious(0) | probably_damaging(1) | TCGA-EK-A2PL-01 | Cervix | cervical & endocervical cancer | Female | <65 | III/IV | Unknown | Unknown | SD | ||
| HPD | SNV | Missense_Mutation | c.481N>C | p.Glu161Gln | p.E161Q | protein_coding | tolerated(0.35) | benign(0.023) | TCGA-VS-A958-01 | Cervix | cervical & endocervical cancer | Female | <65 | I/II | Chemotherapy | cisplatin | CR | ||
| HPD | SNV | Missense_Mutation | novel | c.412N>G | p.Thr138Ala | p.T138A | protein_coding | tolerated(0.09) | benign(0.017) | TCGA-AA-3949-01 | Colorectum | colon adenocarcinoma | Female | >=65 | III/IV | Unknown | Unknown | SD |
| Page: 1 2 3 4 5 |
Top |
Related drugs of malignant transformation related genes |
| Identification of chemicals and drugs interact with genes involved in malignant transfromation |
| (DGIdb 4.0) |
| Entrez ID | Symbol | Category | Interaction Types | Drug Claim Name | Drug Name | PMIDs |
| 3242 | HPD | ENZYME, DRUGGABLE GENOME | NITISINONE | NITISINONE | ||
| 3242 | HPD | ENZYME, DRUGGABLE GENOME | 6-HYDROXYDOPAMINE | 18495353 | ||
| 3242 | HPD | ENZYME, DRUGGABLE GENOME | inhibitor | CHEMBL1337 | NITISINONE | |
| 3242 | HPD | ENZYME, DRUGGABLE GENOME | Nitisinone | NITISINONE | ||
| 3242 | HPD | ENZYME, DRUGGABLE GENOME | NITISINONE | NITISINONE |
| Page: 1 |

Copyright 2023-Present -The University of Texas Health Science Center at Houston |