
|
|||||
|
 | |
| |
| |
| |
| |
| |
|
Gene: HPCAL1 |
Gene summary for HPCAL1 |
| Gene information | Species | Human | Gene symbol | HPCAL1 | Gene ID | 3241 |
| Gene name | hippocalcin like 1 | |
| Gene Alias | BDR1 | |
| Cytomap | 2p25.1 | |
| Gene Type | protein-coding | GO ID | GO:0005575 | UniProtAcc | O75544 |
Top |
Malignant transformation analysis |
| Identification of the aberrant gene expression in precancerous and cancerous lesions by comparing the gene expression of stem-like cells in diseased tissues with normal stem cells |
| Entrez ID | Symbol | Replicates | Species | Organ | Tissue | Adj P-value | Log2FC | Malignancy |
| 3241 | HPCAL1 | HTA11_2487_2000001011 | Human | Colorectum | SER | 1.96e-02 | 5.36e-01 | -0.1808 |
| 3241 | HPCAL1 | HTA11_1938_2000001011 | Human | Colorectum | AD | 2.29e-07 | 6.28e-01 | -0.0811 |
| 3241 | HPCAL1 | HTA11_78_2000001011 | Human | Colorectum | AD | 2.03e-06 | 6.77e-01 | -0.1088 |
| 3241 | HPCAL1 | HTA11_347_2000001011 | Human | Colorectum | AD | 2.23e-09 | 6.04e-01 | -0.1954 |
| 3241 | HPCAL1 | HTA11_411_2000001011 | Human | Colorectum | SER | 6.43e-05 | 1.21e+00 | -0.2602 |
| 3241 | HPCAL1 | HTA11_3361_2000001011 | Human | Colorectum | AD | 1.00e-10 | 1.08e+00 | -0.1207 |
| 3241 | HPCAL1 | HTA11_83_2000001011 | Human | Colorectum | SER | 6.81e-07 | 7.14e-01 | -0.1526 |
| 3241 | HPCAL1 | HTA11_696_2000001011 | Human | Colorectum | AD | 4.21e-26 | 1.33e+00 | -0.1464 |
| 3241 | HPCAL1 | HTA11_866_2000001011 | Human | Colorectum | AD | 7.16e-10 | 9.56e-01 | -0.1001 |
| 3241 | HPCAL1 | HTA11_1391_2000001011 | Human | Colorectum | AD | 2.74e-18 | 1.11e+00 | -0.059 |
| 3241 | HPCAL1 | HTA11_546_2000001011 | Human | Colorectum | AD | 1.02e-04 | 9.18e-01 | -0.0842 |
| 3241 | HPCAL1 | HTA11_866_3004761011 | Human | Colorectum | AD | 4.57e-04 | 3.82e-01 | 0.096 |
| 3241 | HPCAL1 | HTA11_99999965062_69753 | Human | Colorectum | MSI-H | 4.27e-12 | 1.60e+00 | 0.3487 |
| 3241 | HPCAL1 | HTA11_99999971662_82457 | Human | Colorectum | MSS | 4.58e-06 | 6.61e-01 | 0.3859 |
| 3241 | HPCAL1 | HTA11_99999974143_84620 | Human | Colorectum | MSS | 2.11e-05 | 4.75e-01 | 0.3005 |
| 3241 | HPCAL1 | A015-C-203 | Human | Colorectum | FAP | 1.27e-14 | -2.10e-01 | -0.1294 |
| 3241 | HPCAL1 | A002-C-201 | Human | Colorectum | FAP | 1.63e-04 | 5.20e-02 | 0.0324 |
| 3241 | HPCAL1 | A001-C-108 | Human | Colorectum | FAP | 1.28e-06 | -1.65e-01 | -0.0272 |
| 3241 | HPCAL1 | A002-C-205 | Human | Colorectum | FAP | 1.14e-09 | -3.61e-02 | -0.1236 |
| 3241 | HPCAL1 | A001-C-104 | Human | Colorectum | FAP | 1.11e-02 | -1.13e-01 | 0.0184 |
| Page: 1 2 3 4 5 6 7 8 |
| Tissue | Expression Dynamics | Abbreviation |
| Colorectum (GSE201348) |  | FAP: Familial adenomatous polyposis |
| CRC: Colorectal cancer | ||
| Colorectum (HTA11) | 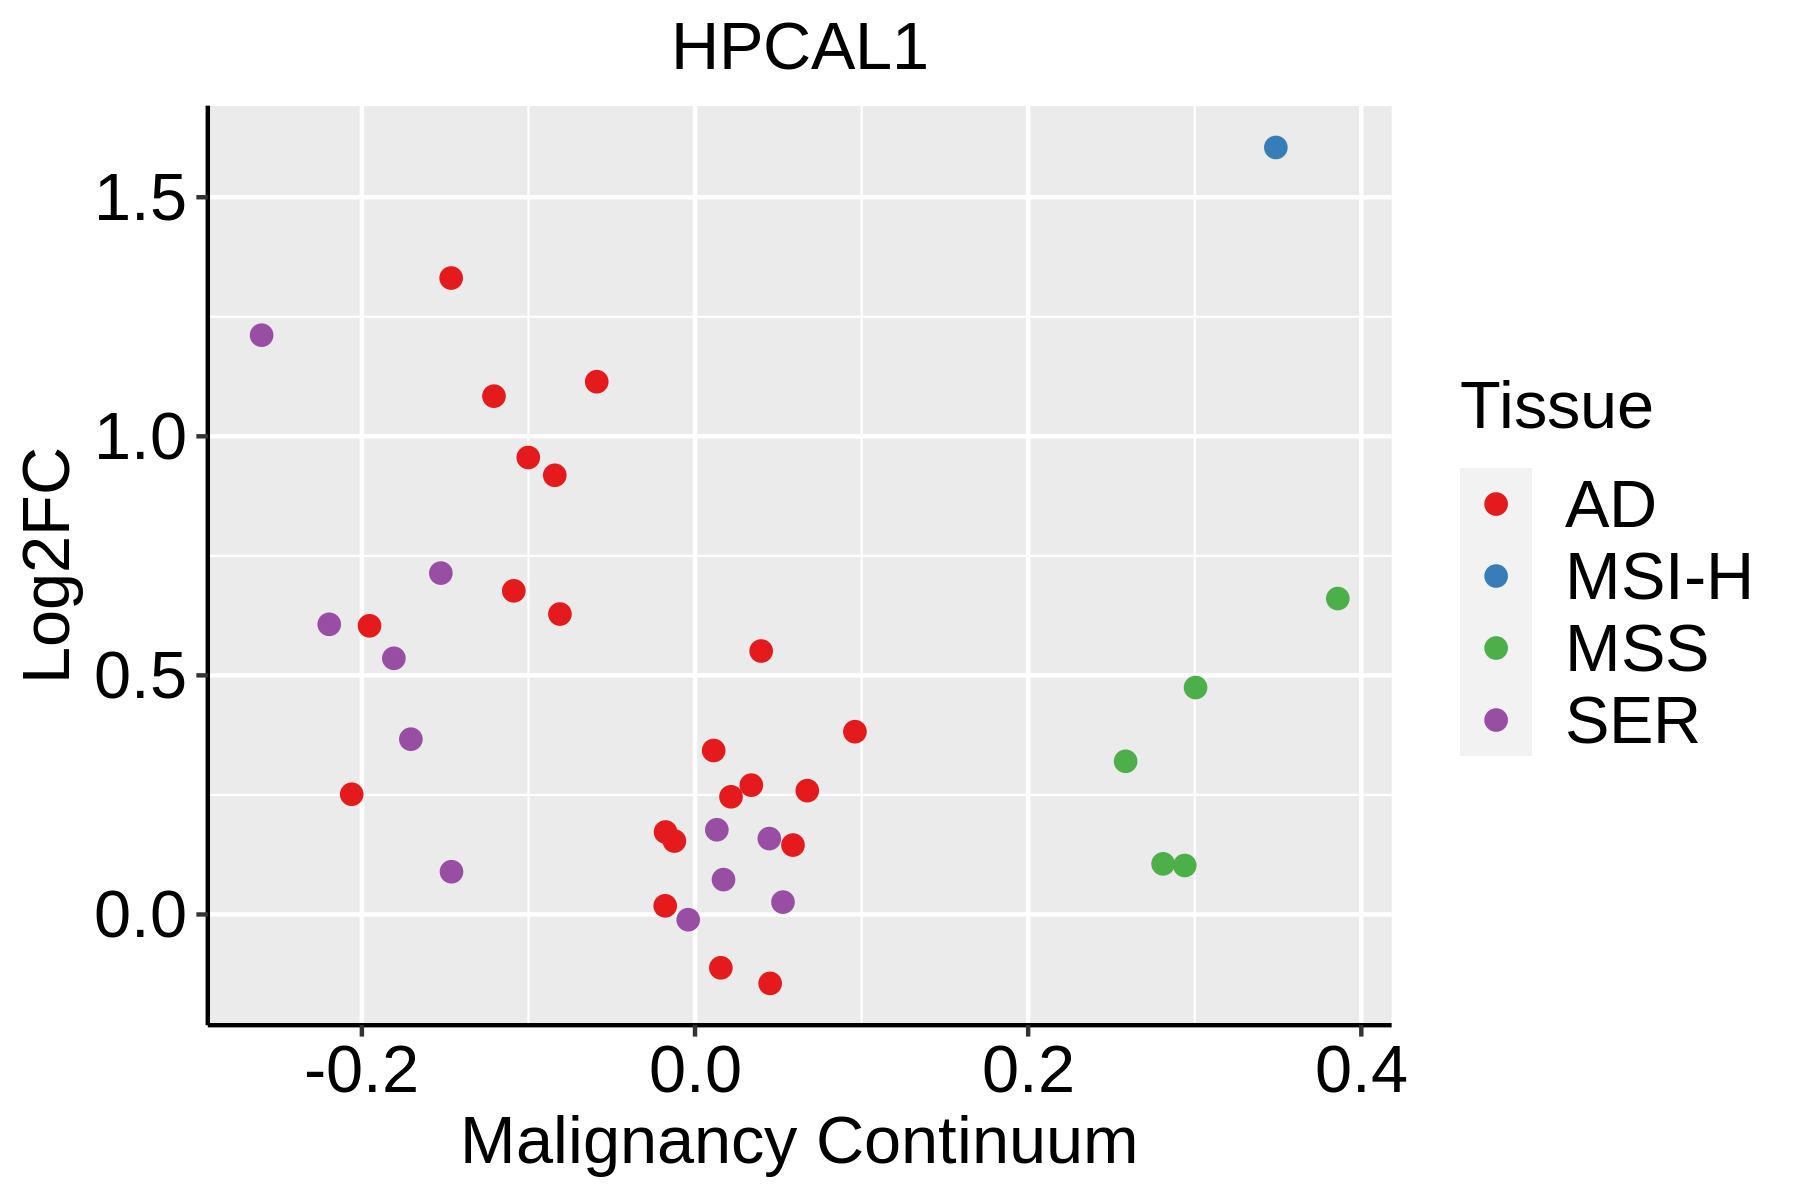 | AD: Adenomas |
| SER: Sessile serrated lesions | ||
| MSI-H: Microsatellite-high colorectal cancer | ||
| MSS: Microsatellite stable colorectal cancer | ||
| Esophagus | 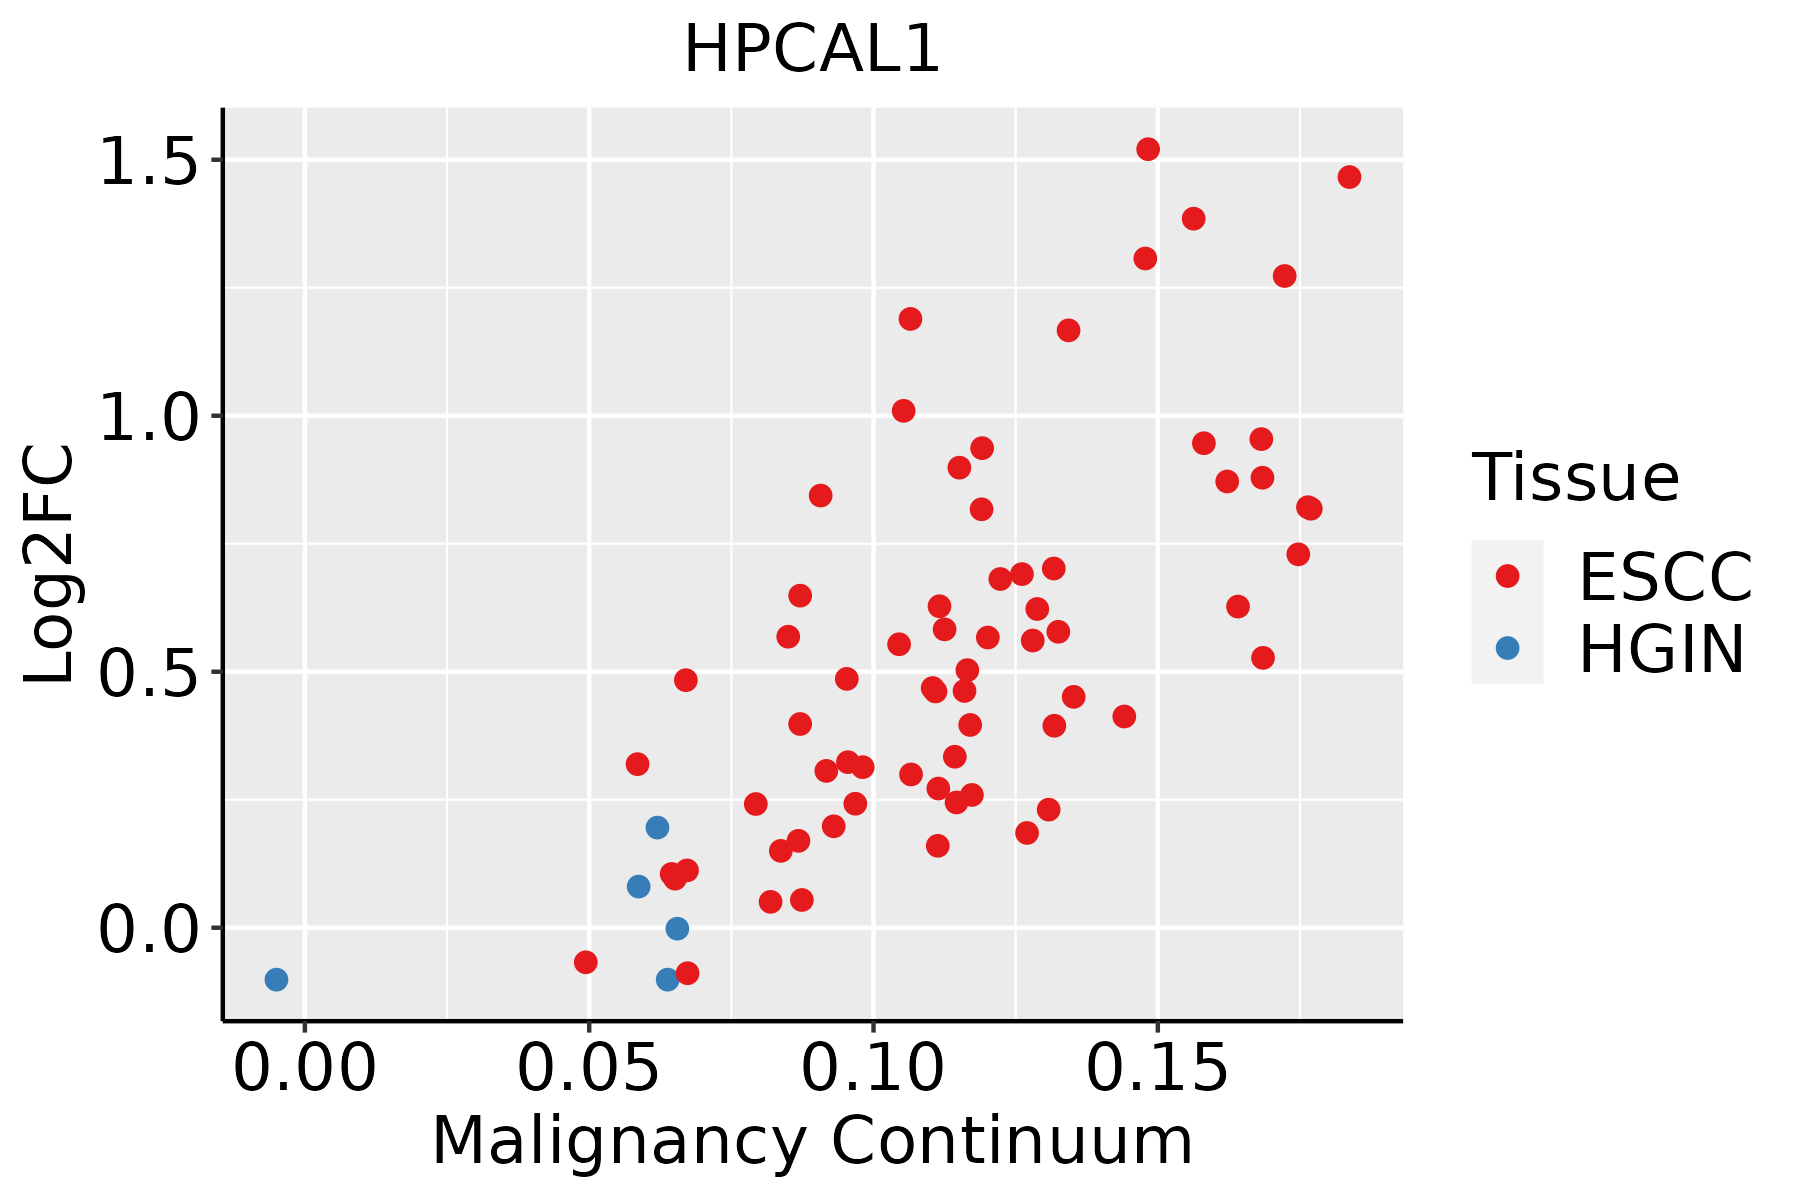 | ESCC: Esophageal squamous cell carcinoma |
| HGIN: High-grade intraepithelial neoplasias | ||
| LGIN: Low-grade intraepithelial neoplasias | ||
| Liver | 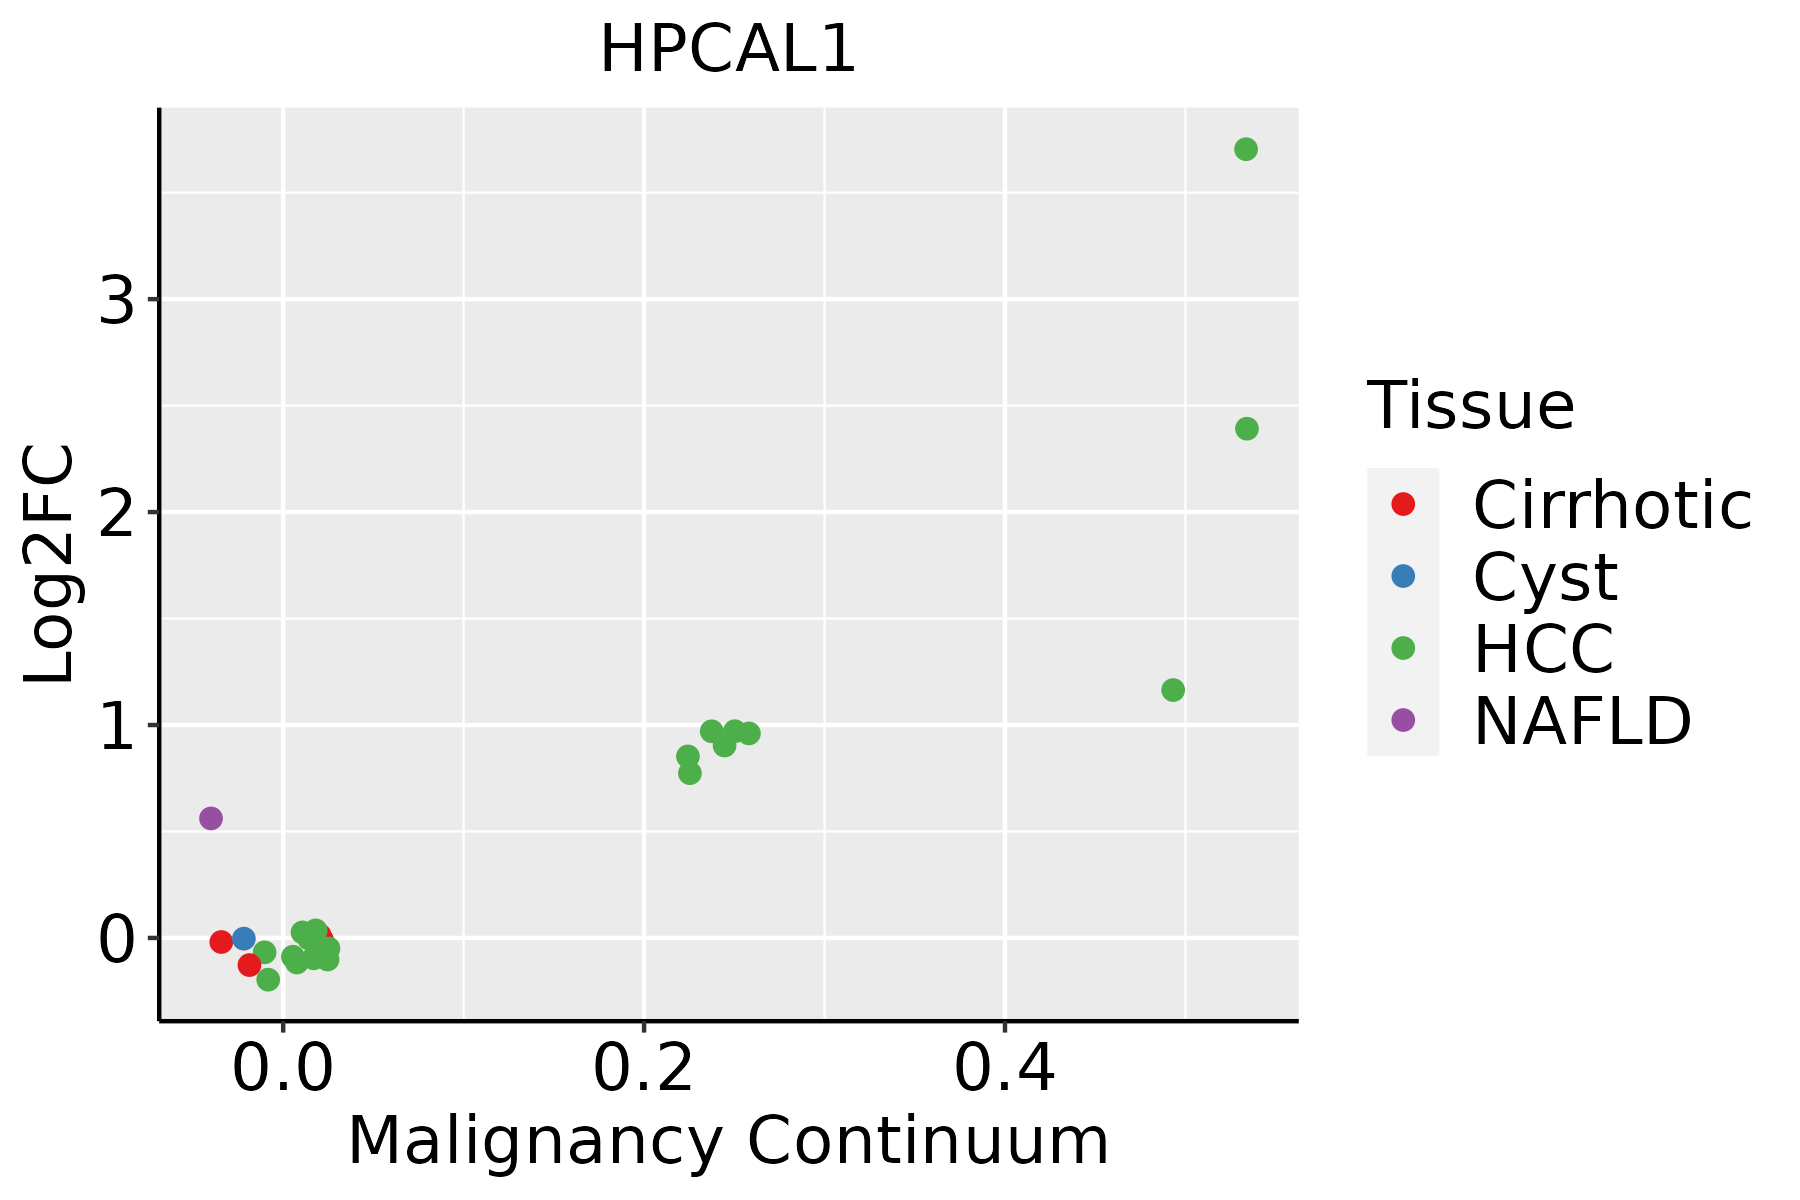 | HCC: Hepatocellular carcinoma |
| NAFLD: Non-alcoholic fatty liver disease | ||
| Oral Cavity | 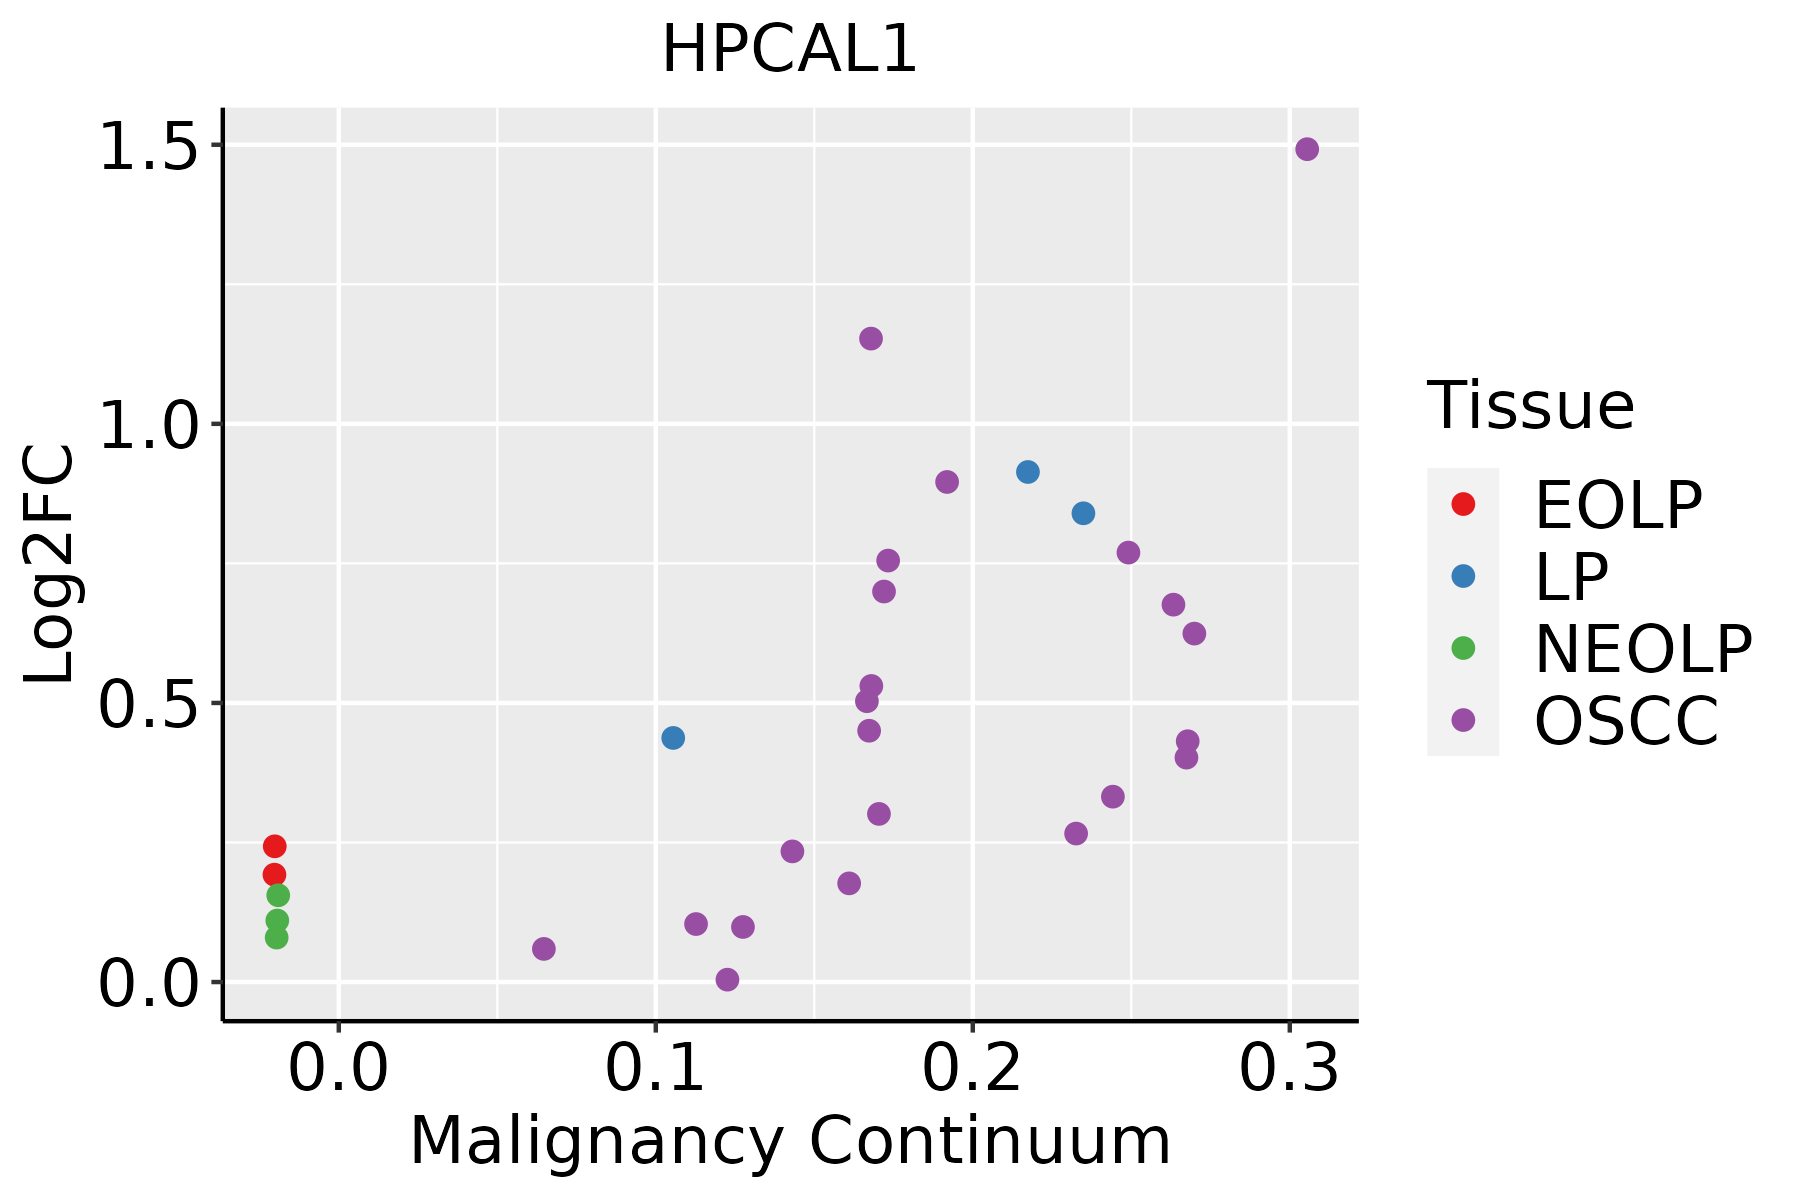 | EOLP: Erosive Oral lichen planus |
| LP: leukoplakia | ||
| NEOLP: Non-erosive oral lichen planus | ||
| OSCC: Oral squamous cell carcinoma | ||
| Skin |  | AK: Actinic keratosis |
| cSCC: Cutaneous squamous cell carcinoma | ||
| SCCIS:squamous cell carcinoma in situ | ||
| Thyroid | 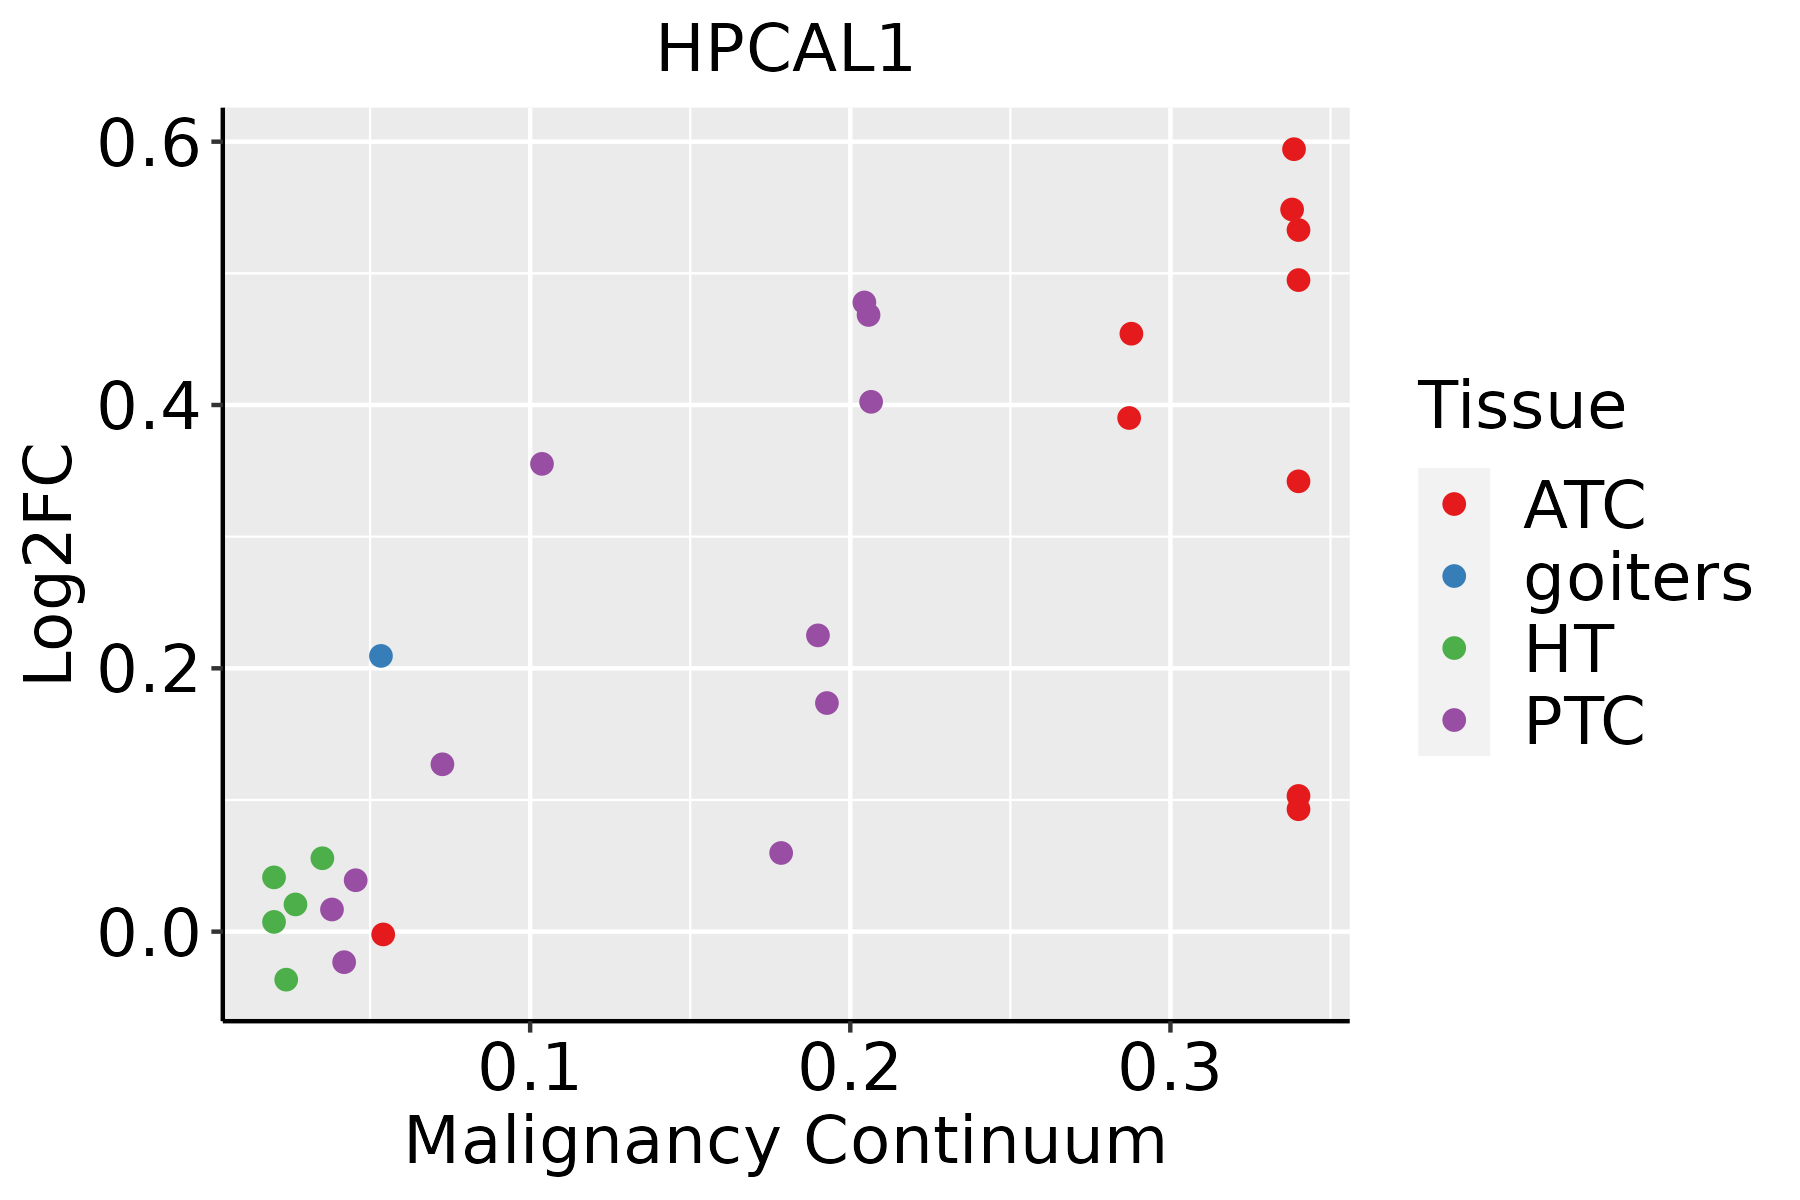 | ATC: Anaplastic thyroid cancer |
| HT: Hashimoto's thyroiditis | ||
| PTC: Papillary thyroid cancer |
| ∗log2FC in expression of this searched gene in stem-like cells from each diseased tissue sample relative to stem-like cells in normal samples in each tissue plotted against the malignancy continuum. Samples are colored based on if they are from different disease stage. |
Top |
Malignant transformation related pathway analysis |
| Find out the enriched GO biological processes and KEGG pathways involved in transition from healthy to precancer to cancer |
| Tissue | Disease Stage | Enriched GO biological Processes |
| Colorectum | AD |  |
| Colorectum | SER |  |
| Colorectum | MSS |  |
| Colorectum | MSI-H |  |
| Colorectum | FAP |  |
| ∗Top 15 enriched GO BP terms are showed in the bar plot of each disease state in each tissue. Each row represents a significant GO biological process which is colored according to the -log10(p.adjust). |
| Page: 1 2 3 4 5 6 7 8 9 |
| GO ID | Tissue | Disease Stage | Description | Gene Ratio | Bg Ratio | pvalue | p.adjust | Count |
| Page: 1 |
| Pathway ID | Tissue | Disease Stage | Description | Gene Ratio | Bg Ratio | pvalue | p.adjust | qvalue | Count |
| Page: 1 |
Top |
Cell-cell communication analysis |
| Identification of potential cell-cell interactions between two cell types and their ligand-receptor pairs for different disease states |
| Ligand | Receptor | LRpair | Pathway | Tissue | Disease Stage |
| Page: 1 |
Top |
Single-cell gene regulatory network inference analysis |
| Find out the significant the regulons (TFs) and the target genes of each regulon across cell types for different disease states |
| TF | Cell Type | Tissue | Disease Stage | Target Gene | RSS | Regulon Activity |
| ∗The dot plots of a searched regulon are shown for all cell subpopulations in each disease state of each tissue based on the regulon specific score inferred using pySCENIC and by calculating the average expression. |
| Page: 1 |
Top |
Somatic mutation of malignant transformation related genes |
| Annotation of somatic variants for genes involved in malignant transformation |
| Hugo Symbol | Variant Class | Variant Classification | dbSNP RS | HGVSc | HGVSp | HGVSp Short | SWISSPROT | BIOTYPE | SIFT | PolyPhen | Tumor Sample Barcode | Tissue | Histology | Sex | Age | Stage | Therapy Types | Drugs | Outcome |
| HPCAL1 | SNV | Missense_Mutation | c.424N>A | p.Glu142Lys | p.E142K | P37235 | protein_coding | deleterious(0.01) | benign(0.027) | TCGA-AC-A23H-01 | Breast | breast invasive carcinoma | Female | >=65 | I/II | Unknown | Unknown | PD | |
| HPCAL1 | SNV | Missense_Mutation | c.73N>T | p.His25Tyr | p.H25Y | P37235 | protein_coding | deleterious(0) | benign(0.001) | TCGA-BH-A0DP-01 | Breast | breast invasive carcinoma | Female | <65 | I/II | Hormone Therapy | arimidex | SD | |
| HPCAL1 | SNV | Missense_Mutation | novel | c.86N>G | p.Glu29Gly | p.E29G | P37235 | protein_coding | deleterious(0.04) | benign(0.003) | TCGA-GI-A2C9-01 | Breast | breast invasive carcinoma | Female | <65 | I/II | Unspecific | SD | |
| HPCAL1 | SNV | Missense_Mutation | c.502G>C | p.Glu168Gln | p.E168Q | P37235 | protein_coding | deleterious(0) | probably_damaging(0.99) | TCGA-C5-A0TN-01 | Cervix | cervical & endocervical cancer | Female | <65 | I/II | Chemotherapy | cisplatin | PD | |
| HPCAL1 | SNV | Missense_Mutation | novel | c.454N>G | p.Ile152Val | p.I152V | P37235 | protein_coding | deleterious(0.02) | benign(0.027) | TCGA-AA-3534-01 | Colorectum | colon adenocarcinoma | Female | >=65 | I/II | Unknown | Unknown | SD |
| HPCAL1 | SNV | Missense_Mutation | c.49N>T | p.Arg17Trp | p.R17W | P37235 | protein_coding | deleterious(0.01) | benign(0.035) | TCGA-AZ-4313-01 | Colorectum | colon adenocarcinoma | Female | <65 | I/II | Unknown | Unknown | SD | |
| HPCAL1 | SNV | Missense_Mutation | c.248N>A | p.Arg83Gln | p.R83Q | P37235 | protein_coding | deleterious(0.02) | probably_damaging(0.912) | TCGA-NH-A50U-01 | Colorectum | colon adenocarcinoma | Male | <65 | I/II | Ancillary | leucovorin | PD | |
| HPCAL1 | SNV | Missense_Mutation | c.278N>T | p.Ser93Leu | p.S93L | P37235 | protein_coding | deleterious(0) | possibly_damaging(0.709) | TCGA-F5-6810-01 | Colorectum | rectum adenocarcinoma | Unknown | Unknown | I/II | Unknown | Unknown | Unknown | |
| HPCAL1 | SNV | Missense_Mutation | novel | c.182C>T | p.Ala61Val | p.A61V | P37235 | protein_coding | deleterious(0.02) | possibly_damaging(0.642) | TCGA-AX-A2HD-01 | Endometrium | uterine corpus endometrioid carcinoma | Female | >=65 | III/IV | Unknown | Unknown | SD |
| HPCAL1 | SNV | Missense_Mutation | rs375884714 | c.157N>A | p.Ala53Thr | p.A53T | P37235 | protein_coding | tolerated(0.17) | benign(0.082) | TCGA-B5-A11E-01 | Endometrium | uterine corpus endometrioid carcinoma | Female | <65 | I/II | Unknown | Unknown | SD |
| Page: 1 2 3 |
Top |
Related drugs of malignant transformation related genes |
| Identification of chemicals and drugs interact with genes involved in malignant transfromation |
| (DGIdb 4.0) |
| Entrez ID | Symbol | Category | Interaction Types | Drug Claim Name | Drug Name | PMIDs |
| Page: 1 |

Copyright 2023-Present -The University of Texas Health Science Center at Houston |