
|
|||||
|
 | |
| |
| |
| |
| |
| |
|
Gene: HPCA |
Gene summary for HPCA |
| Gene information | Species | Human | Gene symbol | HPCA | Gene ID | 3208 |
| Gene name | hippocalcin | |
| Gene Alias | BDR2 | |
| Cytomap | 1p35.1 | |
| Gene Type | protein-coding | GO ID | GO:0001101 | UniProtAcc | P84074 |
Top |
Malignant transformation analysis |
| Identification of the aberrant gene expression in precancerous and cancerous lesions by comparing the gene expression of stem-like cells in diseased tissues with normal stem cells |
| Entrez ID | Symbol | Replicates | Species | Organ | Tissue | Adj P-value | Log2FC | Malignancy |
| 3208 | HPCA | P1T-E | Human | Esophagus | ESCC | 2.65e-12 | 6.66e-01 | 0.0875 |
| 3208 | HPCA | P36T-E | Human | Esophagus | ESCC | 1.53e-27 | 6.64e-01 | 0.1187 |
| 3208 | HPCA | P56T-E | Human | Esophagus | ESCC | 5.84e-10 | 9.69e-01 | 0.1613 |
| 3208 | HPCA | P89T-E | Human | Esophagus | ESCC | 1.01e-21 | 9.19e-01 | 0.1752 |
| 3208 | HPCA | P94T-E | Human | Esophagus | ESCC | 6.09e-07 | 7.46e-01 | 0.0879 |
| 3208 | HPCA | P126T-E | Human | Esophagus | ESCC | 5.69e-15 | 7.25e-01 | 0.1125 |
| Page: 1 |
| Tissue | Expression Dynamics | Abbreviation |
| Esophagus | 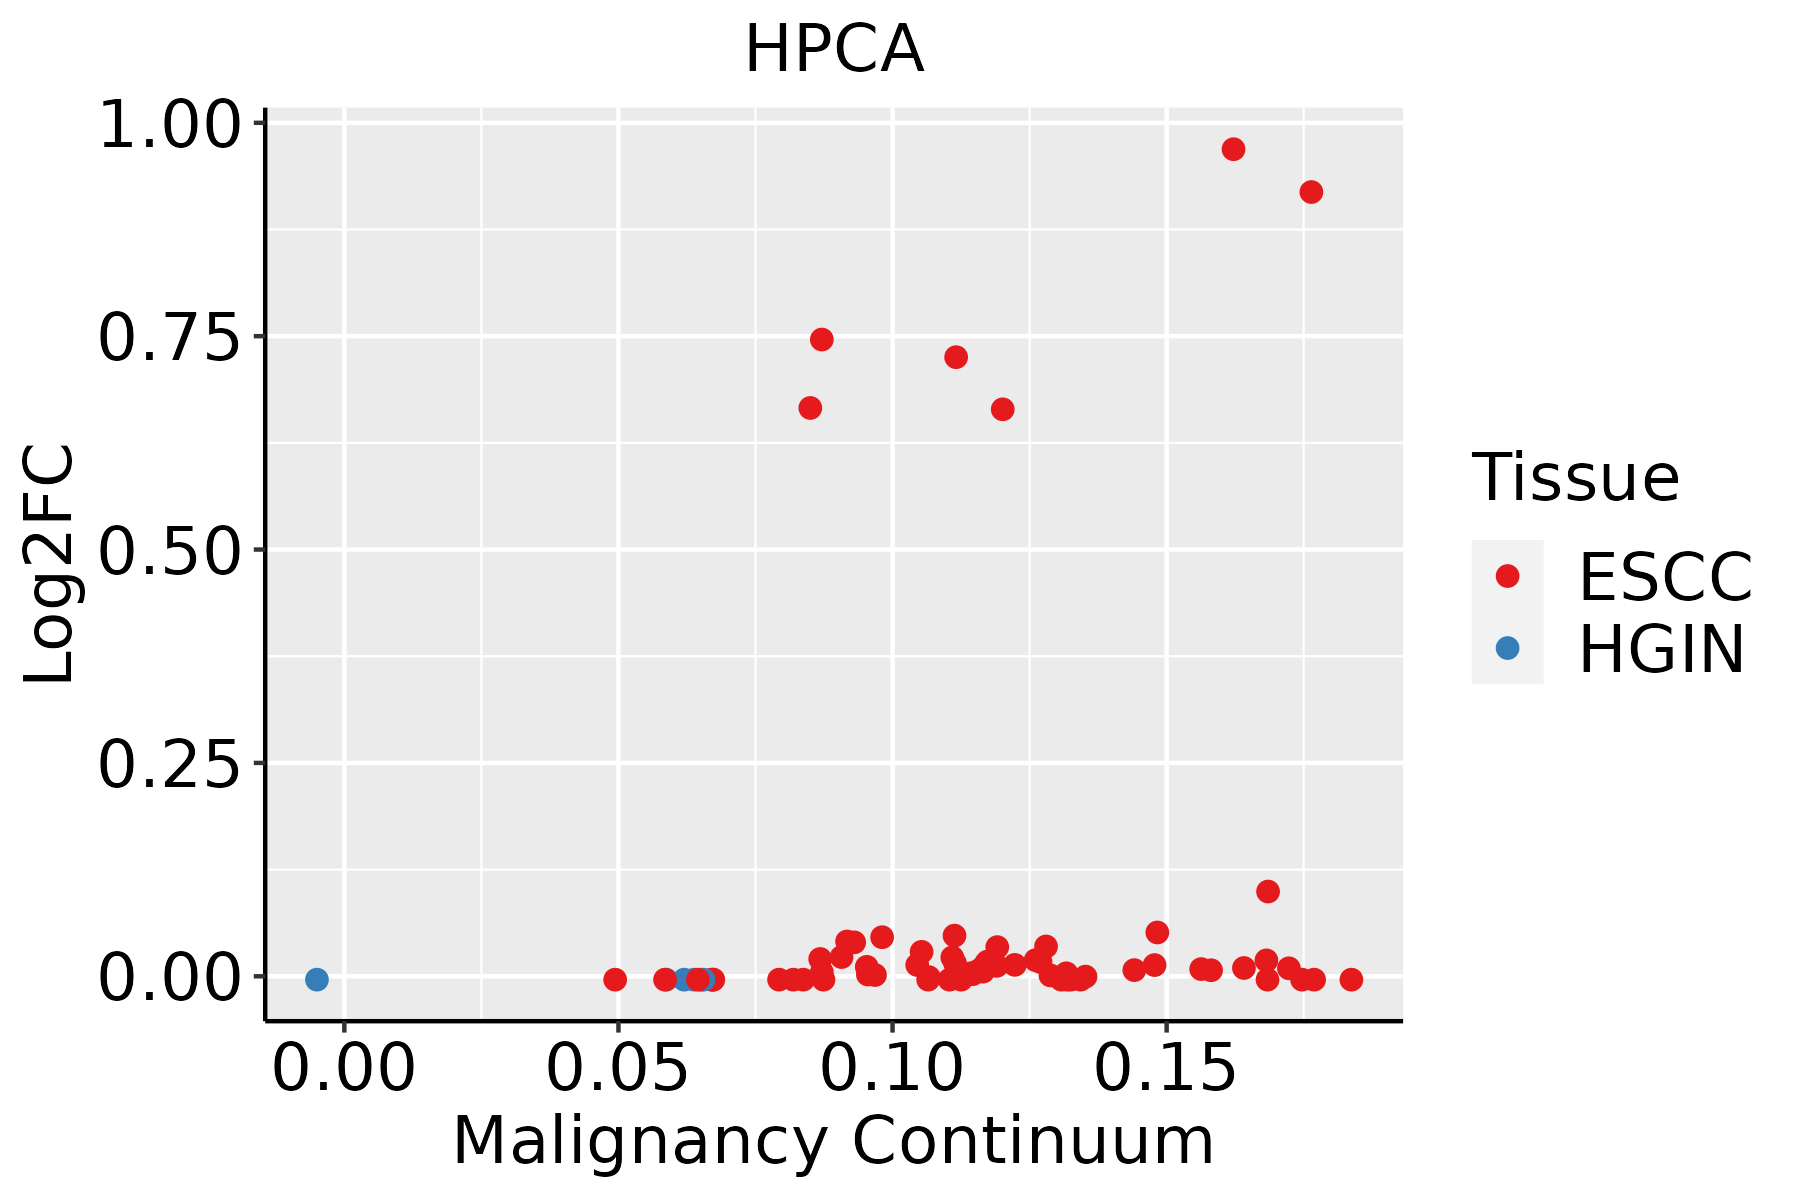 | ESCC: Esophageal squamous cell carcinoma |
| HGIN: High-grade intraepithelial neoplasias | ||
| LGIN: Low-grade intraepithelial neoplasias |
| ∗log2FC in expression of this searched gene in stem-like cells from each diseased tissue sample relative to stem-like cells in normal samples in each tissue plotted against the malignancy continuum. Samples are colored based on if they are from different disease stage. |
Top |
Malignant transformation related pathway analysis |
| Find out the enriched GO biological processes and KEGG pathways involved in transition from healthy to precancer to cancer |
| Tissue | Disease Stage | Enriched GO biological Processes |
| Colorectum | AD |  |
| Colorectum | SER |  |
| Colorectum | MSS |  |
| Colorectum | MSI-H |  |
| Colorectum | FAP |  |
| ∗Top 15 enriched GO BP terms are showed in the bar plot of each disease state in each tissue. Each row represents a significant GO biological process which is colored according to the -log10(p.adjust). |
| Page: 1 2 3 4 5 6 7 8 9 |
| GO ID | Tissue | Disease Stage | Description | Gene Ratio | Bg Ratio | pvalue | p.adjust | Count |
| GO:003238618 | Esophagus | ESCC | regulation of intracellular transport | 243/8552 | 337/18723 | 3.20e-23 | 7.25e-21 | 243 |
| GO:0006605111 | Esophagus | ESCC | protein targeting | 229/8552 | 314/18723 | 4.93e-23 | 1.01e-20 | 229 |
| GO:1903829111 | Esophagus | ESCC | positive regulation of cellular protein localization | 199/8552 | 276/18723 | 2.99e-19 | 3.45e-17 | 199 |
| GO:0033157110 | Esophagus | ESCC | regulation of intracellular protein transport | 169/8552 | 229/18723 | 3.31e-18 | 3.23e-16 | 169 |
| GO:0032388110 | Esophagus | ESCC | positive regulation of intracellular transport | 152/8552 | 202/18723 | 7.89e-18 | 7.36e-16 | 152 |
| GO:1904951111 | Esophagus | ESCC | positive regulation of establishment of protein localization | 216/8552 | 319/18723 | 1.01e-15 | 6.86e-14 | 216 |
| GO:0090150110 | Esophagus | ESCC | establishment of protein localization to membrane | 182/8552 | 260/18723 | 1.27e-15 | 8.19e-14 | 182 |
| GO:009031617 | Esophagus | ESCC | positive regulation of intracellular protein transport | 122/8552 | 160/18723 | 2.45e-15 | 1.49e-13 | 122 |
| GO:0051222111 | Esophagus | ESCC | positive regulation of protein transport | 204/8552 | 303/18723 | 1.56e-14 | 8.38e-13 | 204 |
| GO:0010563111 | Esophagus | ESCC | negative regulation of phosphorus metabolic process | 274/8552 | 442/18723 | 2.32e-12 | 9.41e-11 | 274 |
| GO:0045936111 | Esophagus | ESCC | negative regulation of phosphate metabolic process | 273/8552 | 441/18723 | 3.18e-12 | 1.25e-10 | 273 |
| GO:007121419 | Esophagus | ESCC | cellular response to abiotic stimulus | 206/8552 | 331/18723 | 7.52e-10 | 1.88e-08 | 206 |
| GO:010400419 | Esophagus | ESCC | cellular response to environmental stimulus | 206/8552 | 331/18723 | 7.52e-10 | 1.88e-08 | 206 |
| GO:190547519 | Esophagus | ESCC | regulation of protein localization to membrane | 117/8552 | 175/18723 | 1.14e-08 | 2.26e-07 | 117 |
| GO:0006753110 | Esophagus | ESCC | nucleoside phosphate metabolic process | 288/8552 | 497/18723 | 1.80e-08 | 3.50e-07 | 288 |
| GO:0009117111 | Esophagus | ESCC | nucleotide metabolic process | 282/8552 | 489/18723 | 4.70e-08 | 8.50e-07 | 282 |
| GO:003010018 | Esophagus | ESCC | regulation of endocytosis | 135/8552 | 211/18723 | 5.75e-08 | 1.02e-06 | 135 |
| GO:003150314 | Esophagus | ESCC | protein-containing complex localization | 139/8552 | 220/18723 | 1.14e-07 | 1.85e-06 | 139 |
| GO:190547719 | Esophagus | ESCC | positive regulation of protein localization to membrane | 73/8552 | 106/18723 | 1.13e-06 | 1.40e-05 | 73 |
| GO:0072521111 | Esophagus | ESCC | purine-containing compound metabolic process | 238/8552 | 416/18723 | 1.20e-06 | 1.49e-05 | 238 |
| Page: 1 2 |
| Pathway ID | Tissue | Disease Stage | Description | Gene Ratio | Bg Ratio | pvalue | p.adjust | qvalue | Count |
| Page: 1 |
Top |
Cell-cell communication analysis |
| Identification of potential cell-cell interactions between two cell types and their ligand-receptor pairs for different disease states |
| Ligand | Receptor | LRpair | Pathway | Tissue | Disease Stage |
| Page: 1 |
Top |
Single-cell gene regulatory network inference analysis |
| Find out the significant the regulons (TFs) and the target genes of each regulon across cell types for different disease states |
| TF | Cell Type | Tissue | Disease Stage | Target Gene | RSS | Regulon Activity |
| ∗The dot plots of a searched regulon are shown for all cell subpopulations in each disease state of each tissue based on the regulon specific score inferred using pySCENIC and by calculating the average expression. |
| Page: 1 |
Top |
Somatic mutation of malignant transformation related genes |
| Annotation of somatic variants for genes involved in malignant transformation |
| Hugo Symbol | Variant Class | Variant Classification | dbSNP RS | HGVSc | HGVSp | HGVSp Short | SWISSPROT | BIOTYPE | SIFT | PolyPhen | Tumor Sample Barcode | Tissue | Histology | Sex | Age | Stage | Therapy Types | Drugs | Outcome |
| HPCA | deletion | Frame_Shift_Del | novel | c.139delG | p.Glu47SerfsTer34 | p.E47Sfs*34 | P84074 | protein_coding | TCGA-D8-A27V-01 | Breast | breast invasive carcinoma | Female | <65 | I/II | Hormone Therapy | tamoxiphen | SD | ||
| HPCA | SNV | Missense_Mutation | novel | c.67T>C | p.Ser23Pro | p.S23P | P84074 | protein_coding | deleterious(0.03) | benign(0.103) | TCGA-VS-A9V4-01 | Cervix | cervical & endocervical cancer | Female | <65 | I/II | Chemotherapy | cisplatin | PD |
| HPCA | SNV | Missense_Mutation | c.66C>A | p.Phe22Leu | p.F22L | P84074 | protein_coding | deleterious(0.01) | probably_damaging(0.961) | TCGA-AA-3510-01 | Colorectum | colon adenocarcinoma | Male | >=65 | I/II | Unknown | Unknown | SD | |
| HPCA | SNV | Missense_Mutation | rs138767632 | c.373N>A | p.Val125Met | p.V125M | P84074 | protein_coding | deleterious(0) | possibly_damaging(0.806) | TCGA-AA-3675-01 | Colorectum | colon adenocarcinoma | Male | >=65 | I/II | Unknown | Unknown | SD |
| HPCA | SNV | Missense_Mutation | rs774794783 | c.26N>A | p.Arg9Gln | p.R9Q | P84074 | protein_coding | tolerated(0.15) | benign(0.043) | TCGA-AA-A01R-01 | Colorectum | colon adenocarcinoma | Male | <65 | III/IV | Chemotherapy | 5-fluorouracil | PD |
| HPCA | SNV | Missense_Mutation | rs774794783 | c.26G>A | p.Arg9Gln | p.R9Q | P84074 | protein_coding | tolerated(0.15) | benign(0.043) | TCGA-CM-5861-01 | Colorectum | colon adenocarcinoma | Female | <65 | I/II | Unknown | Unknown | PD |
| HPCA | SNV | Missense_Mutation | c.352N>T | p.Arg118Trp | p.R118W | P84074 | protein_coding | deleterious(0) | possibly_damaging(0.897) | TCGA-F4-6570-01 | Colorectum | colon adenocarcinoma | Female | >=65 | I/II | Unknown | Unknown | SD | |
| HPCA | SNV | Missense_Mutation | novel | c.182N>T | p.Ala61Val | p.A61V | P84074 | protein_coding | deleterious(0.02) | probably_damaging(0.934) | TCGA-A5-A2K5-01 | Endometrium | uterine corpus endometrioid carcinoma | Female | >=65 | I/II | Unknown | Unknown | SD |
| HPCA | SNV | Missense_Mutation | rs750301601 | c.259N>G | p.Ile87Val | p.I87V | P84074 | protein_coding | tolerated(0.16) | benign(0.003) | TCGA-AP-A05O-01 | Endometrium | uterine corpus endometrioid carcinoma | Female | >=65 | I/II | Chemotherapy | carboplatin | PD |
| HPCA | SNV | Missense_Mutation | rs750301601 | c.259N>G | p.Ile87Val | p.I87V | P84074 | protein_coding | tolerated(0.16) | benign(0.003) | TCGA-AX-A06D-01 | Endometrium | uterine corpus endometrioid carcinoma | Female | >=65 | III/IV | Chemotherapy | carboplatin | PD |
| Page: 1 2 |
Top |
Related drugs of malignant transformation related genes |
| Identification of chemicals and drugs interact with genes involved in malignant transfromation |
| (DGIdb 4.0) |
| Entrez ID | Symbol | Category | Interaction Types | Drug Claim Name | Drug Name | PMIDs |
| Page: 1 |

Copyright 2023-Present -The University of Texas Health Science Center at Houston |