
|
|||||
|
 | |
| |
| |
| |
| |
| |
|
Gene: HOXD10 |
Gene summary for HOXD10 |
| Gene information | Species | Human | Gene symbol | HOXD10 | Gene ID | 3236 |
| Gene name | homeobox D10 | |
| Gene Alias | HOX4 | |
| Cytomap | 2q31.1 | |
| Gene Type | protein-coding | GO ID | GO:0000003 | UniProtAcc | P28358 |
Top |
Malignant transformation analysis |
| Identification of the aberrant gene expression in precancerous and cancerous lesions by comparing the gene expression of stem-like cells in diseased tissues with normal stem cells |
| Entrez ID | Symbol | Replicates | Species | Organ | Tissue | Adj P-value | Log2FC | Malignancy |
| 3236 | HOXD10 | CCI_1 | Human | Cervix | CC | 6.20e-08 | 5.58e-01 | 0.528 |
| 3236 | HOXD10 | CCI_2 | Human | Cervix | CC | 4.19e-04 | 4.24e-01 | 0.5249 |
| 3236 | HOXD10 | CCI_3 | Human | Cervix | CC | 3.75e-15 | 6.89e-01 | 0.516 |
| 3236 | HOXD10 | sample3 | Human | Cervix | CC | 4.72e-06 | 1.77e-01 | 0.1387 |
| 3236 | HOXD10 | T3 | Human | Cervix | CC | 1.21e-08 | 1.92e-01 | 0.1389 |
| 3236 | HOXD10 | HTA11_347_2000001011 | Human | Colorectum | AD | 6.32e-04 | 1.88e-01 | -0.1954 |
| 3236 | HOXD10 | HTA11_411_2000001011 | Human | Colorectum | SER | 1.73e-10 | 9.88e-01 | -0.2602 |
| 3236 | HOXD10 | HTA11_5212_2000001011 | Human | Colorectum | AD | 3.11e-08 | 4.28e-01 | -0.2061 |
| 3236 | HOXD10 | HTA11_866_3004761011 | Human | Colorectum | AD | 1.51e-02 | 1.18e-01 | 0.096 |
| 3236 | HOXD10 | HTA11_6818_2000001021 | Human | Colorectum | AD | 1.01e-03 | 1.94e-01 | 0.0588 |
| 3236 | HOXD10 | A015-C-005 | Human | Colorectum | FAP | 5.90e-04 | 3.05e-01 | -0.0336 |
| 3236 | HOXD10 | CRC-1-8810 | Human | Colorectum | CRC | 3.18e-02 | 3.00e-01 | 0.6257 |
| 3236 | HOXD10 | P1T-E | Human | Esophagus | ESCC | 2.97e-02 | 1.63e-01 | 0.0875 |
| 3236 | HOXD10 | P4T-E | Human | Esophagus | ESCC | 8.00e-03 | 1.06e-01 | 0.1323 |
| 3236 | HOXD10 | P5T-E | Human | Esophagus | ESCC | 3.50e-02 | 7.79e-02 | 0.1327 |
| 3236 | HOXD10 | P8T-E | Human | Esophagus | ESCC | 7.90e-03 | 8.33e-02 | 0.0889 |
| 3236 | HOXD10 | P12T-E | Human | Esophagus | ESCC | 3.75e-03 | 1.04e-01 | 0.1122 |
| 3236 | HOXD10 | P27T-E | Human | Esophagus | ESCC | 7.90e-03 | 5.94e-02 | 0.1055 |
| 3236 | HOXD10 | P32T-E | Human | Esophagus | ESCC | 8.40e-04 | 1.17e-01 | 0.1666 |
| 3236 | HOXD10 | P37T-E | Human | Esophagus | ESCC | 1.87e-02 | 9.02e-02 | 0.1371 |
| Page: 1 2 |
| Tissue | Expression Dynamics | Abbreviation |
| Cervix | 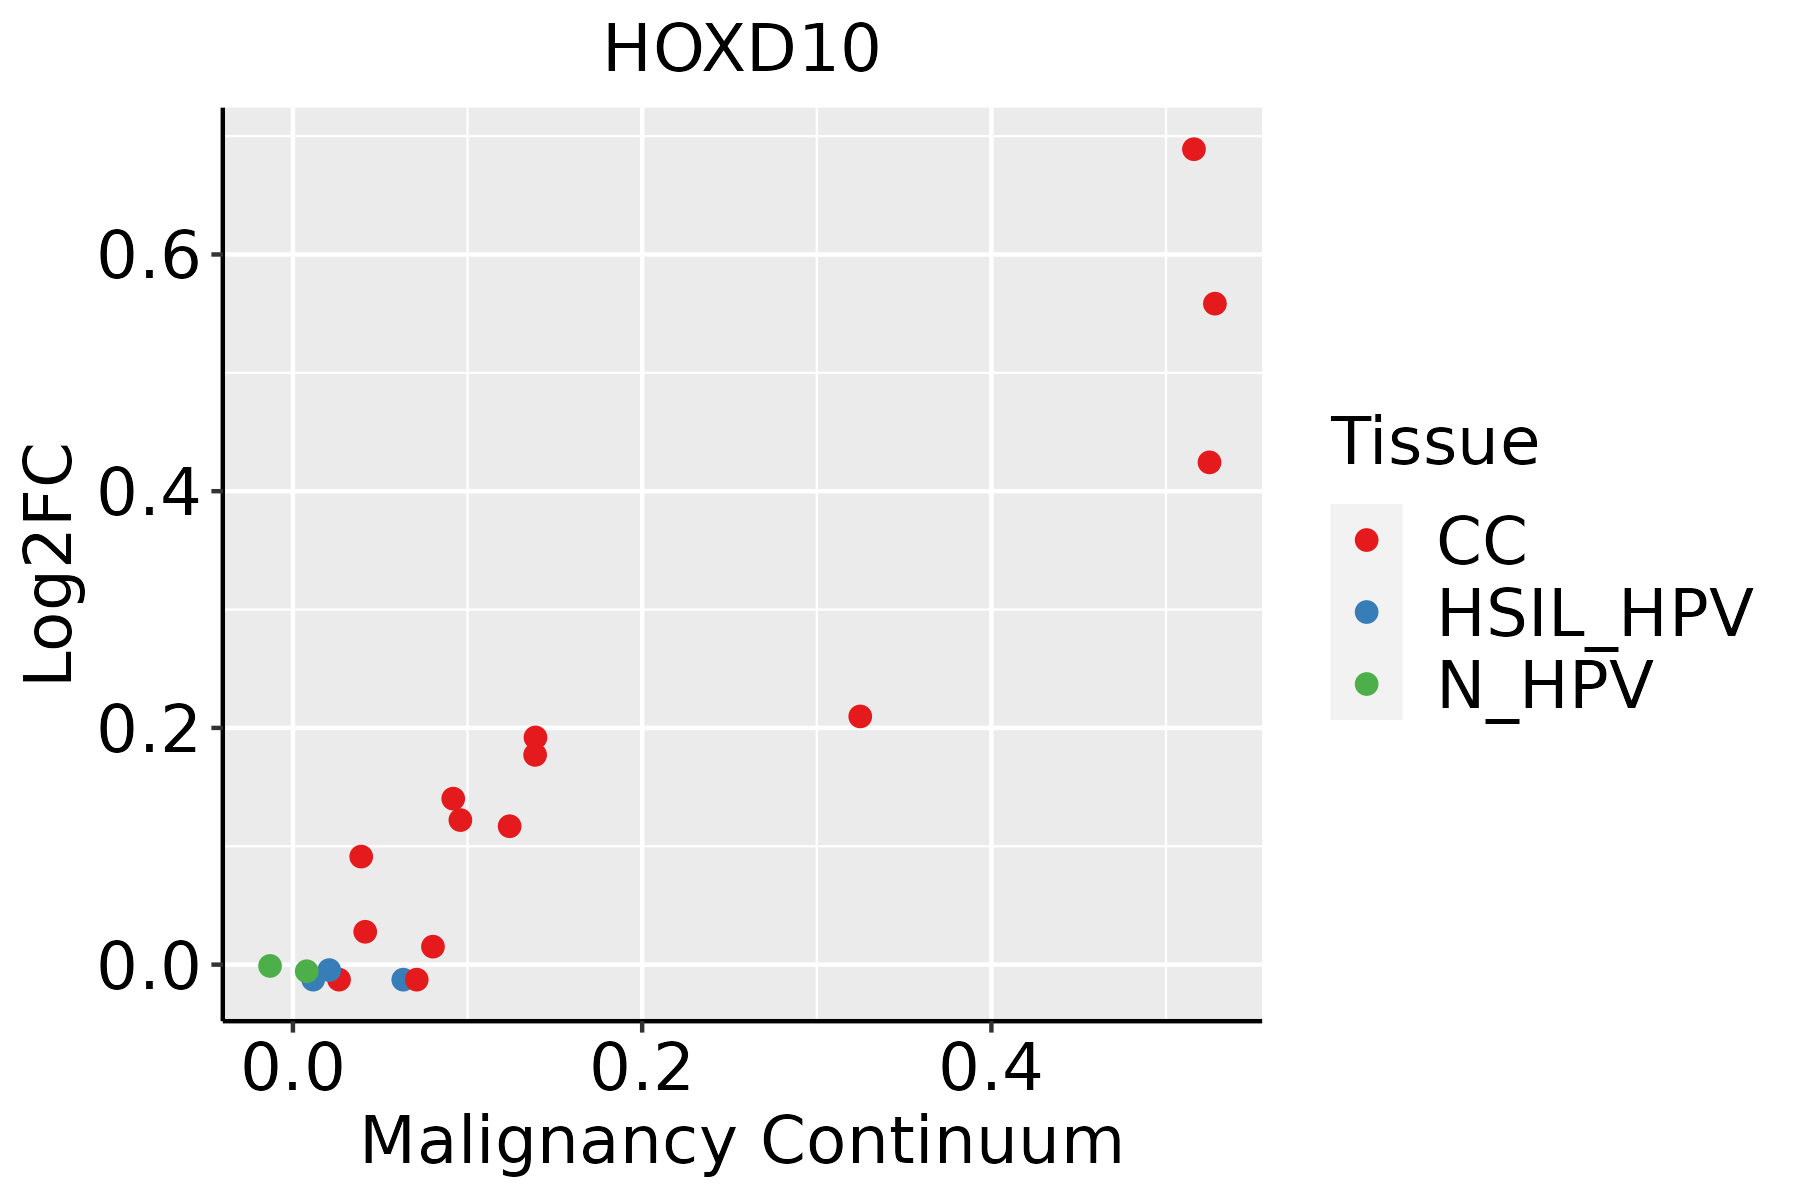 | CC: Cervix cancer |
| HSIL_HPV: HPV-infected high-grade squamous intraepithelial lesions | ||
| N_HPV: HPV-infected normal cervix | ||
| Colorectum (GSE201348) |  | FAP: Familial adenomatous polyposis |
| CRC: Colorectal cancer | ||
| Colorectum (HTA11) | 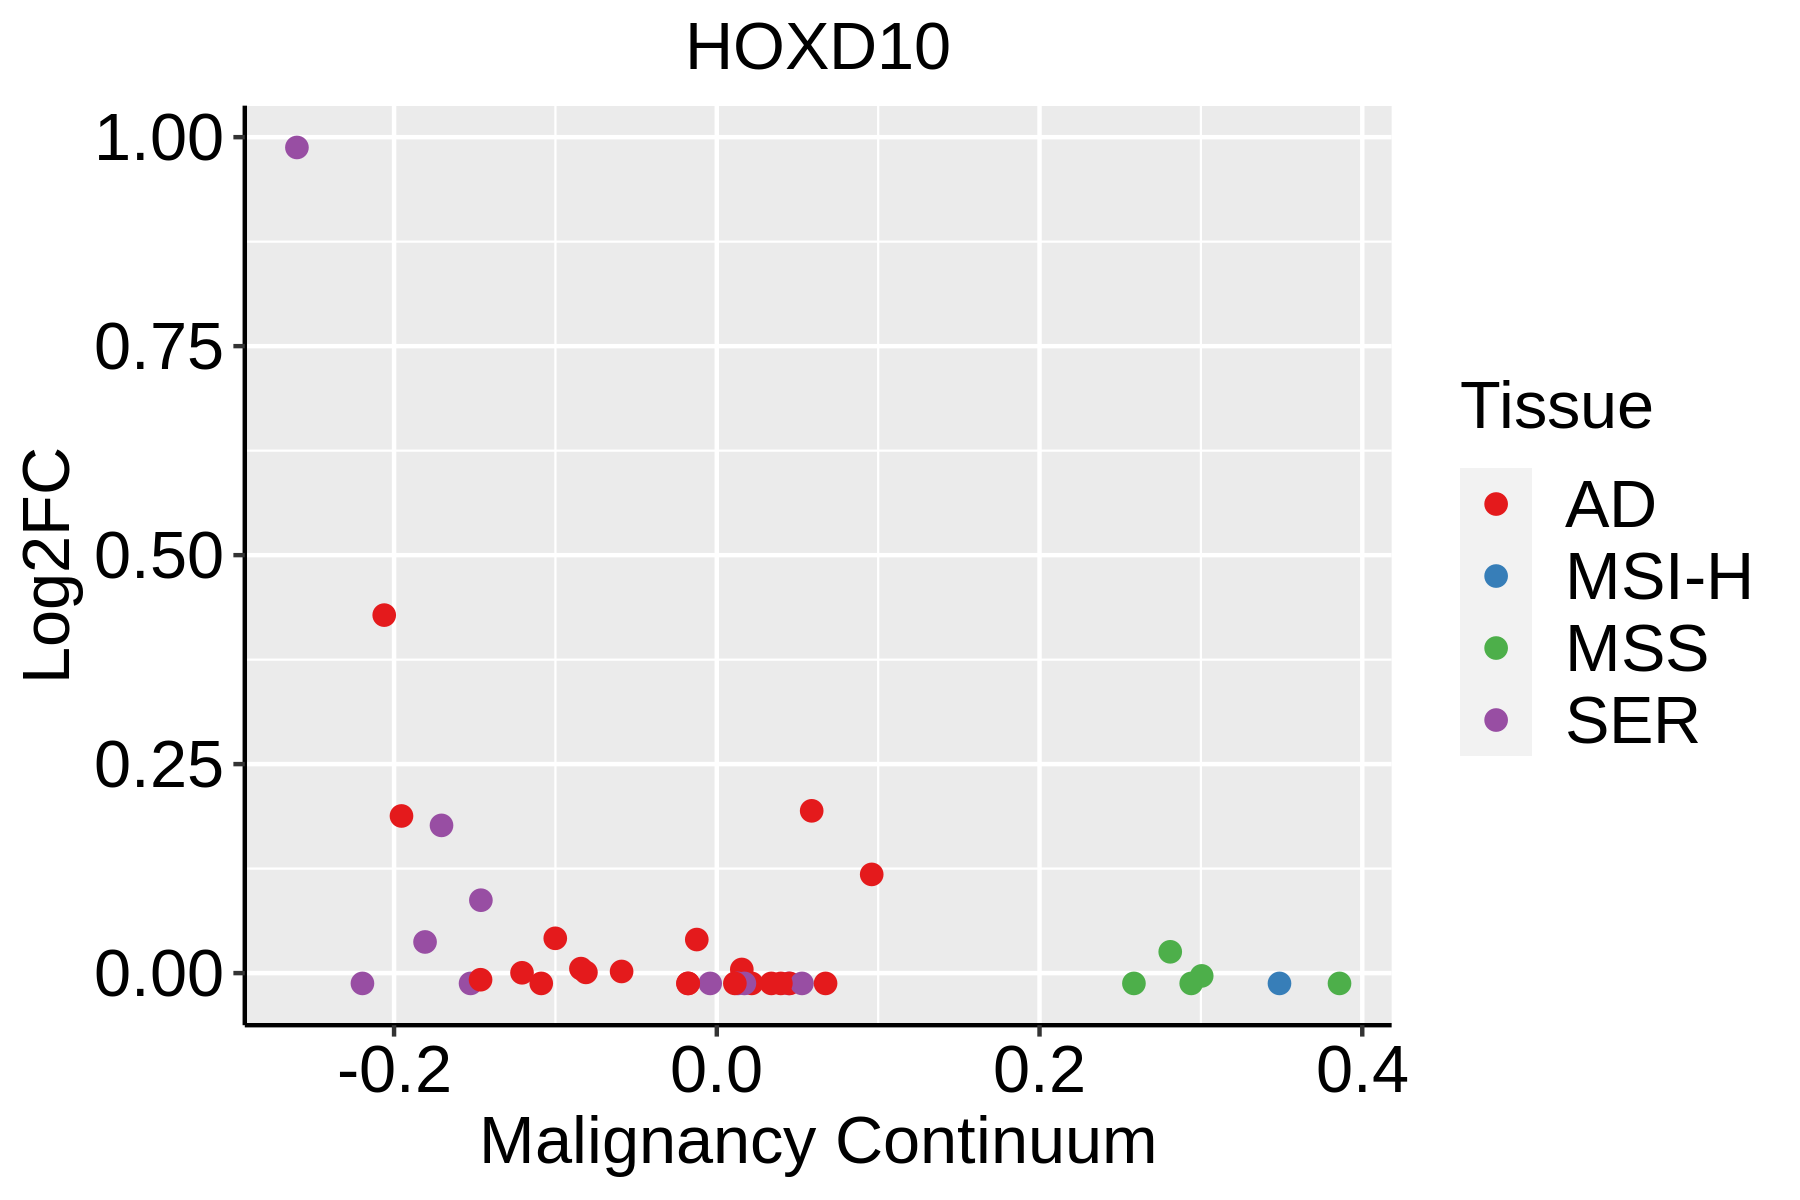 | AD: Adenomas |
| SER: Sessile serrated lesions | ||
| MSI-H: Microsatellite-high colorectal cancer | ||
| MSS: Microsatellite stable colorectal cancer | ||
| Esophagus | 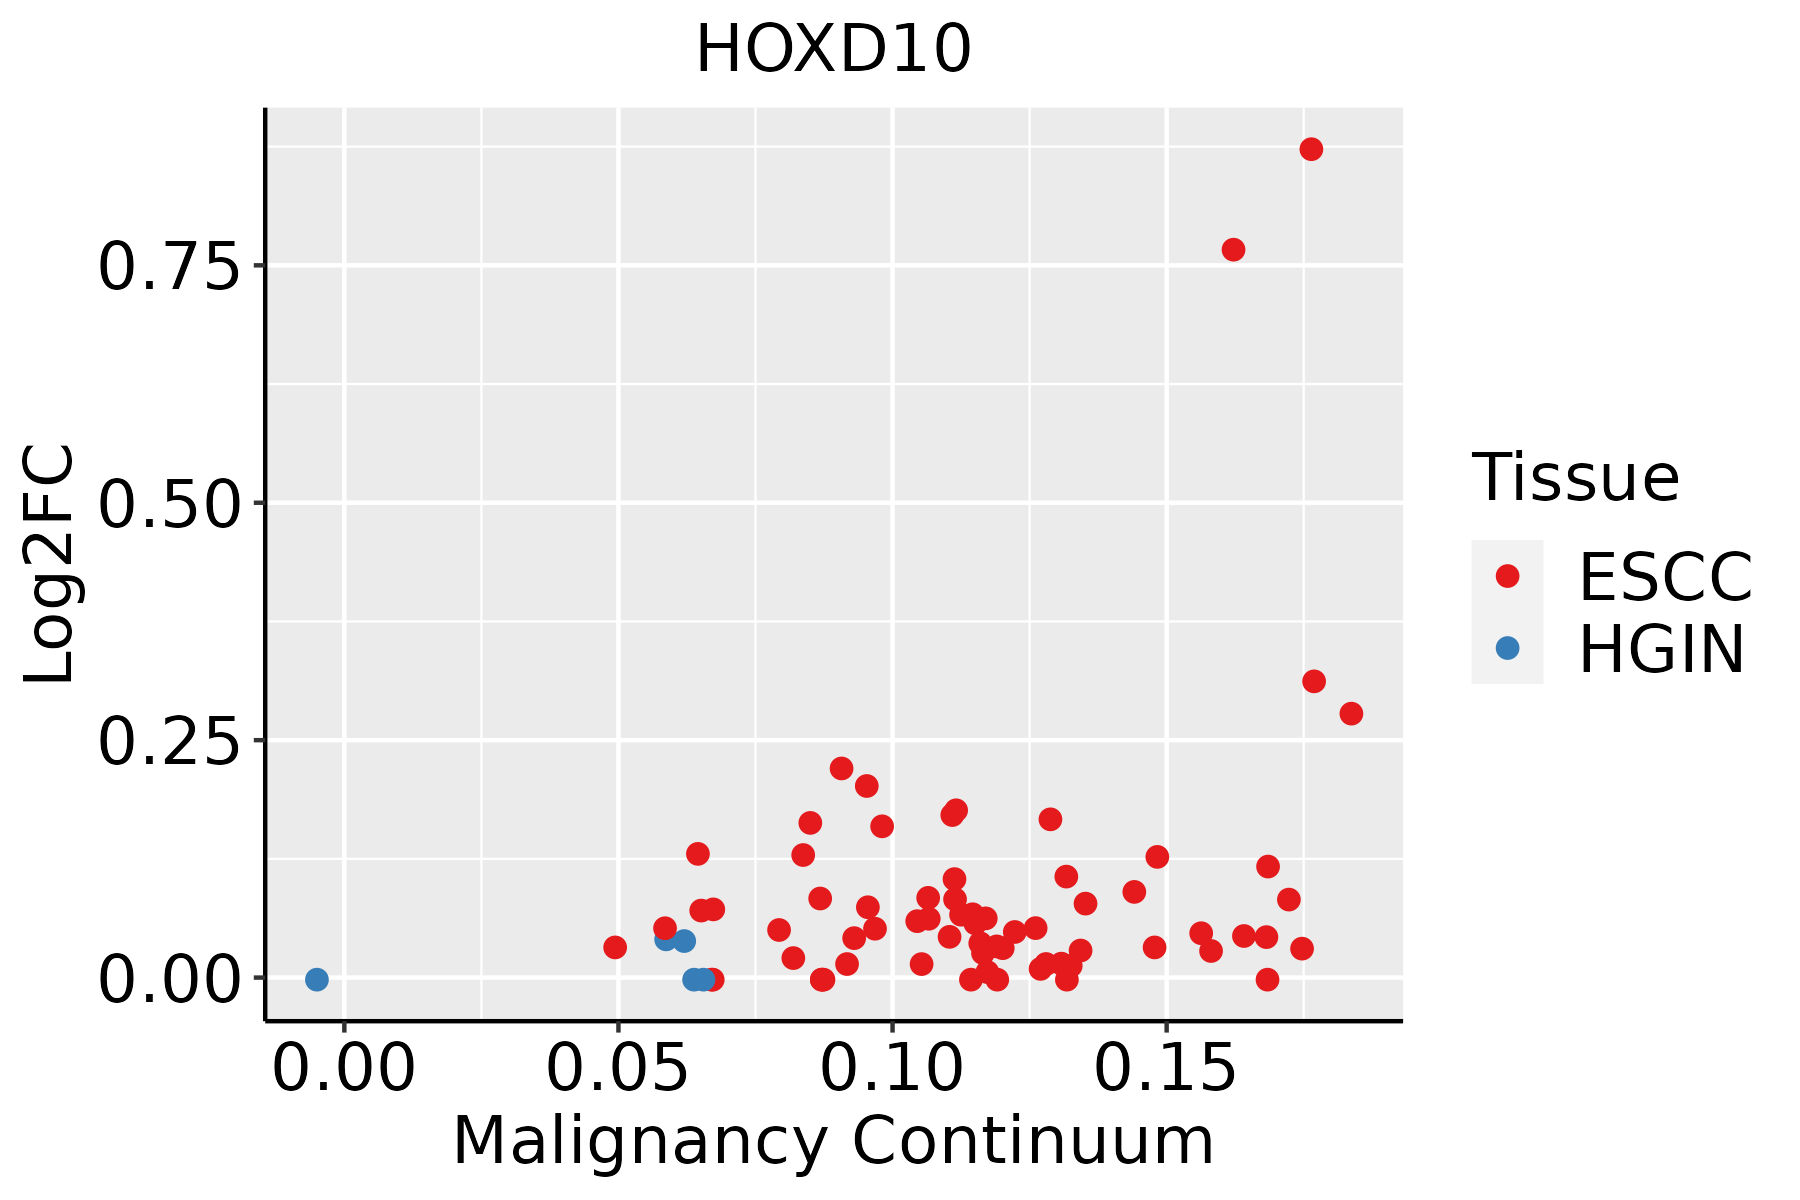 | ESCC: Esophageal squamous cell carcinoma |
| HGIN: High-grade intraepithelial neoplasias | ||
| LGIN: Low-grade intraepithelial neoplasias |
| ∗log2FC in expression of this searched gene in stem-like cells from each diseased tissue sample relative to stem-like cells in normal samples in each tissue plotted against the malignancy continuum. Samples are colored based on if they are from different disease stage. |
Top |
Malignant transformation related pathway analysis |
| Find out the enriched GO biological processes and KEGG pathways involved in transition from healthy to precancer to cancer |
| Tissue | Disease Stage | Enriched GO biological Processes |
| Colorectum | AD |  |
| Colorectum | SER |  |
| Colorectum | MSS |  |
| Colorectum | MSI-H |  |
| Colorectum | FAP |  |
| ∗Top 15 enriched GO BP terms are showed in the bar plot of each disease state in each tissue. Each row represents a significant GO biological process which is colored according to the -log10(p.adjust). |
| Page: 1 2 3 4 5 6 7 8 9 |
| GO ID | Tissue | Disease Stage | Description | Gene Ratio | Bg Ratio | pvalue | p.adjust | Count |
| GO:00605375 | Cervix | CC | muscle tissue development | 76/2311 | 403/18723 | 9.76e-05 | 1.27e-03 | 76 |
| GO:00147064 | Cervix | CC | striated muscle tissue development | 72/2311 | 384/18723 | 1.76e-04 | 2.07e-03 | 72 |
| GO:00487365 | Cervix | CC | appendage development | 35/2311 | 172/18723 | 1.88e-03 | 1.39e-02 | 35 |
| GO:00601735 | Cervix | CC | limb development | 35/2311 | 172/18723 | 1.88e-03 | 1.39e-02 | 35 |
| GO:00075173 | Cervix | CC | muscle organ development | 58/2311 | 327/18723 | 2.73e-03 | 1.85e-02 | 58 |
| GO:00075192 | Cervix | CC | skeletal muscle tissue development | 30/2311 | 155/18723 | 7.97e-03 | 4.18e-02 | 30 |
| GO:0048736 | Colorectum | AD | appendage development | 51/3918 | 172/18723 | 4.20e-03 | 2.89e-02 | 51 |
| GO:0060173 | Colorectum | AD | limb development | 51/3918 | 172/18723 | 4.20e-03 | 2.89e-02 | 51 |
| GO:0048568 | Colorectum | AD | embryonic organ development | 112/3918 | 427/18723 | 4.60e-03 | 3.14e-02 | 112 |
| GO:00487361 | Colorectum | SER | appendage development | 42/2897 | 172/18723 | 1.43e-03 | 1.55e-02 | 42 |
| GO:00601731 | Colorectum | SER | limb development | 42/2897 | 172/18723 | 1.43e-03 | 1.55e-02 | 42 |
| GO:0035107 | Colorectum | SER | appendage morphogenesis | 33/2897 | 138/18723 | 6.10e-03 | 4.42e-02 | 33 |
| GO:0035108 | Colorectum | SER | limb morphogenesis | 33/2897 | 138/18723 | 6.10e-03 | 4.42e-02 | 33 |
| GO:00351071 | Colorectum | FAP | appendage morphogenesis | 35/2622 | 138/18723 | 2.74e-04 | 3.66e-03 | 35 |
| GO:00351081 | Colorectum | FAP | limb morphogenesis | 35/2622 | 138/18723 | 2.74e-04 | 3.66e-03 | 35 |
| GO:00487363 | Colorectum | FAP | appendage development | 40/2622 | 172/18723 | 7.15e-04 | 7.66e-03 | 40 |
| GO:00601733 | Colorectum | FAP | limb development | 40/2622 | 172/18723 | 7.15e-04 | 7.66e-03 | 40 |
| GO:00485682 | Colorectum | FAP | embryonic organ development | 79/2622 | 427/18723 | 5.32e-03 | 3.49e-02 | 79 |
| GO:0009952 | Colorectum | FAP | anterior/posterior pattern specification | 41/2622 | 201/18723 | 7.82e-03 | 4.63e-02 | 41 |
| GO:00351072 | Colorectum | CRC | appendage morphogenesis | 32/2078 | 138/18723 | 3.77e-05 | 9.26e-04 | 32 |
| Page: 1 2 |
| Pathway ID | Tissue | Disease Stage | Description | Gene Ratio | Bg Ratio | pvalue | p.adjust | qvalue | Count |
| hsa0520516 | Cervix | CC | Proteoglycans in cancer | 60/1267 | 205/8465 | 9.13e-08 | 1.18e-06 | 7.00e-07 | 60 |
| hsa0520517 | Cervix | CC | Proteoglycans in cancer | 60/1267 | 205/8465 | 9.13e-08 | 1.18e-06 | 7.00e-07 | 60 |
| hsa05205 | Colorectum | AD | Proteoglycans in cancer | 70/2092 | 205/8465 | 1.37e-03 | 8.46e-03 | 5.39e-03 | 70 |
| hsa052051 | Colorectum | AD | Proteoglycans in cancer | 70/2092 | 205/8465 | 1.37e-03 | 8.46e-03 | 5.39e-03 | 70 |
| hsa052052 | Colorectum | SER | Proteoglycans in cancer | 58/1580 | 205/8465 | 4.37e-04 | 3.82e-03 | 2.77e-03 | 58 |
| hsa052053 | Colorectum | SER | Proteoglycans in cancer | 58/1580 | 205/8465 | 4.37e-04 | 3.82e-03 | 2.77e-03 | 58 |
| hsa052058 | Colorectum | CRC | Proteoglycans in cancer | 47/1091 | 205/8465 | 4.43e-05 | 8.70e-04 | 5.90e-04 | 47 |
| hsa052059 | Colorectum | CRC | Proteoglycans in cancer | 47/1091 | 205/8465 | 4.43e-05 | 8.70e-04 | 5.90e-04 | 47 |
| hsa0520529 | Esophagus | ESCC | Proteoglycans in cancer | 138/4205 | 205/8465 | 1.79e-07 | 1.40e-06 | 7.15e-07 | 138 |
| hsa0520537 | Esophagus | ESCC | Proteoglycans in cancer | 138/4205 | 205/8465 | 1.79e-07 | 1.40e-06 | 7.15e-07 | 138 |
| Page: 1 |
Top |
Cell-cell communication analysis |
| Identification of potential cell-cell interactions between two cell types and their ligand-receptor pairs for different disease states |
| Ligand | Receptor | LRpair | Pathway | Tissue | Disease Stage |
| Page: 1 |
Top |
Single-cell gene regulatory network inference analysis |
| Find out the significant the regulons (TFs) and the target genes of each regulon across cell types for different disease states |
| TF | Cell Type | Tissue | Disease Stage | Target Gene | RSS | Regulon Activity |
| HOXD10 | MVA | Cervix | HSIL_HPV | HOXD9,HERC6,NME1, etc. | 5.02e-02 |  |
| HOXD10 | ABS | Colorectum | AD | B3GNT7,HOXB13,HOXD11, etc. | 2.65e-01 |  |
| HOXD10 | EE | Colorectum | ADJ | WNT5B,AC116049.2,LEF1, etc. | 6.93e-02 |  |
| HOXD10 | GLAN | Endometrium | ADJ | HOXD11,IL15,HOXD9, etc. | 5.69e-01 |  |
| HOXD10 | GLAN | Endometrium | AEH | HOXD11,IL15,HOXD9, etc. | 3.06e-01 |  |
| HOXD10 | PVA | Esophagus | ADJ | ANGPT2,DNAJC12,HOXD9, etc. | 3.72e-01 |  |
| HOXD10 | LYMEND | Esophagus | ADJ | ANGPT2,DNAJC12,HOXD9, etc. | 9.52e-02 | |
| HOXD10 | MVA | Esophagus | ADJ | ANGPT2,DNAJC12,HOXD9, etc. | 1.40e-01 | |
| HOXD10 | MVA | Esophagus | ESCC | ANGPT2,DNAJC12,HOXD9, etc. | 3.26e-01 |  |
| HOXD10 | SPI | Oral cavity | LP | HOXD11,SFTPD,HOXD9, etc. | 3.44e-01 |  |
| ∗The dot plots of a searched regulon are shown for all cell subpopulations in each disease state of each tissue based on the regulon specific score inferred using pySCENIC and by calculating the average expression. |
| Page: 1 |
Top |
Somatic mutation of malignant transformation related genes |
| Annotation of somatic variants for genes involved in malignant transformation |
| Hugo Symbol | Variant Class | Variant Classification | dbSNP RS | HGVSc | HGVSp | HGVSp Short | SWISSPROT | BIOTYPE | SIFT | PolyPhen | Tumor Sample Barcode | Tissue | Histology | Sex | Age | Stage | Therapy Types | Drugs | Outcome |
| HOXD10 | SNV | Missense_Mutation | rs868004054 | c.679N>A | p.Glu227Lys | p.E227K | P28358 | protein_coding | tolerated(0.11) | benign(0.003) | TCGA-AC-A5XS-01 | Breast | breast invasive carcinoma | Female | >=65 | I/II | Hormone Therapy | femara | SD |
| HOXD10 | SNV | Missense_Mutation | novel | c.627N>C | p.Glu209Asp | p.E209D | P28358 | protein_coding | tolerated(0.5) | benign(0) | TCGA-C5-A3HD-01 | Cervix | cervical & endocervical cancer | Female | <65 | I/II | Chemotherapy | cisplatin | SD |
| HOXD10 | SNV | Missense_Mutation | rs148563899 | c.619N>T | p.Gly207Cys | p.G207C | P28358 | protein_coding | tolerated(0.06) | benign(0.311) | TCGA-FU-A23L-01 | Cervix | cervical & endocervical cancer | Female | <65 | I/II | Chemotherapy | cisplatin | CR |
| HOXD10 | SNV | Missense_Mutation | rs765114168 | c.61G>A | p.Ala21Thr | p.A21T | P28358 | protein_coding | tolerated(0.13) | benign(0.235) | TCGA-AA-3663-01 | Colorectum | colon adenocarcinoma | Male | <65 | I/II | Unknown | Unknown | SD |
| HOXD10 | SNV | Missense_Mutation | c.374C>T | p.Ser125Leu | p.S125L | P28358 | protein_coding | deleterious(0.02) | benign(0.047) | TCGA-AA-3941-01 | Colorectum | colon adenocarcinoma | Female | >=65 | I/II | Unknown | Unknown | SD | |
| HOXD10 | SNV | Missense_Mutation | c.547N>T | p.Arg183Cys | p.R183C | P28358 | protein_coding | deleterious(0.01) | benign(0.038) | TCGA-G4-6299-01 | Colorectum | colon adenocarcinoma | Male | >=65 | III/IV | Ancillary | leucovorin | SD | |
| HOXD10 | SNV | Missense_Mutation | rs761758159 | c.1013N>T | p.Thr338Met | p.T338M | P28358 | protein_coding | deleterious(0.01) | probably_damaging(0.917) | TCGA-AF-2693-01 | Colorectum | rectum adenocarcinoma | Male | >=65 | I/II | Unknown | Unknown | SD |
| HOXD10 | SNV | Missense_Mutation | rs770037719 | c.511N>A | p.Glu171Lys | p.E171K | P28358 | protein_coding | tolerated(0.46) | benign(0.206) | TCGA-AG-A002-01 | Colorectum | rectum adenocarcinoma | Male | <65 | I/II | Unknown | Unknown | SD |
| HOXD10 | SNV | Missense_Mutation | rs374700658 | c.266N>A | p.Arg89Gln | p.R89Q | P28358 | protein_coding | deleterious(0) | possibly_damaging(0.557) | TCGA-F5-6814-01 | Colorectum | rectum adenocarcinoma | Male | <65 | I/II | Unknown | Unknown | SD |
| HOXD10 | SNV | Missense_Mutation | novel | c.569N>C | p.Leu190Pro | p.L190P | P28358 | protein_coding | tolerated(0.29) | benign(0.085) | TCGA-AJ-A3EK-01 | Endometrium | uterine corpus endometrioid carcinoma | Female | <65 | I/II | Chemotherapy | carboplatin | CR |
| Page: 1 2 3 4 5 6 |
Top |
Related drugs of malignant transformation related genes |
| Identification of chemicals and drugs interact with genes involved in malignant transfromation |
| (DGIdb 4.0) |
| Entrez ID | Symbol | Category | Interaction Types | Drug Claim Name | Drug Name | PMIDs |
| Page: 1 |

Copyright 2023-Present -The University of Texas Health Science Center at Houston |