
|
|||||
|
 | |
| |
| |
| |
| |
| |
|
Gene: HOXC10 |
Gene summary for HOXC10 |
| Gene information | Species | Human | Gene symbol | HOXC10 | Gene ID | 3226 |
| Gene name | homeobox C10 | |
| Gene Alias | HOX3I | |
| Cytomap | 12q13.13 | |
| Gene Type | protein-coding | GO ID | GO:0001659 | UniProtAcc | Q53XI4 |
Top |
Malignant transformation analysis |
| Identification of the aberrant gene expression in precancerous and cancerous lesions by comparing the gene expression of stem-like cells in diseased tissues with normal stem cells |
| Entrez ID | Symbol | Replicates | Species | Organ | Tissue | Adj P-value | Log2FC | Malignancy |
| 3226 | HOXC10 | LZE4T | Human | Esophagus | ESCC | 3.49e-18 | 4.16e-01 | 0.0811 |
| 3226 | HOXC10 | LZE5T | Human | Esophagus | ESCC | 2.69e-08 | 4.24e-01 | 0.0514 |
| 3226 | HOXC10 | LZE7T | Human | Esophagus | ESCC | 9.40e-05 | 3.51e-01 | 0.0667 |
| 3226 | HOXC10 | LZE22T | Human | Esophagus | ESCC | 9.78e-09 | 4.98e-01 | 0.068 |
| 3226 | HOXC10 | LZE24T | Human | Esophagus | ESCC | 8.10e-25 | 6.08e-01 | 0.0596 |
| 3226 | HOXC10 | LZE6T | Human | Esophagus | ESCC | 2.18e-06 | 3.80e-01 | 0.0845 |
| 3226 | HOXC10 | P2T-E | Human | Esophagus | ESCC | 8.03e-51 | 8.14e-01 | 0.1177 |
| 3226 | HOXC10 | P4T-E | Human | Esophagus | ESCC | 6.93e-25 | 4.86e-01 | 0.1323 |
| 3226 | HOXC10 | P5T-E | Human | Esophagus | ESCC | 2.08e-05 | 1.33e-01 | 0.1327 |
| 3226 | HOXC10 | P8T-E | Human | Esophagus | ESCC | 7.72e-32 | 5.74e-01 | 0.0889 |
| 3226 | HOXC10 | P9T-E | Human | Esophagus | ESCC | 8.94e-11 | 2.68e-01 | 0.1131 |
| 3226 | HOXC10 | P10T-E | Human | Esophagus | ESCC | 3.37e-37 | 6.41e-01 | 0.116 |
| 3226 | HOXC10 | P11T-E | Human | Esophagus | ESCC | 1.56e-14 | 5.22e-01 | 0.1426 |
| 3226 | HOXC10 | P12T-E | Human | Esophagus | ESCC | 6.53e-45 | 8.26e-01 | 0.1122 |
| 3226 | HOXC10 | P15T-E | Human | Esophagus | ESCC | 7.79e-23 | 3.75e-01 | 0.1149 |
| 3226 | HOXC10 | P16T-E | Human | Esophagus | ESCC | 5.42e-41 | 6.94e-01 | 0.1153 |
| 3226 | HOXC10 | P17T-E | Human | Esophagus | ESCC | 1.79e-04 | 1.41e-01 | 0.1278 |
| 3226 | HOXC10 | P20T-E | Human | Esophagus | ESCC | 1.82e-33 | 6.55e-01 | 0.1124 |
| 3226 | HOXC10 | P21T-E | Human | Esophagus | ESCC | 2.46e-20 | 4.51e-01 | 0.1617 |
| 3226 | HOXC10 | P22T-E | Human | Esophagus | ESCC | 3.19e-32 | 5.61e-01 | 0.1236 |
| Page: 1 2 3 |
| Tissue | Expression Dynamics | Abbreviation |
| Esophagus | 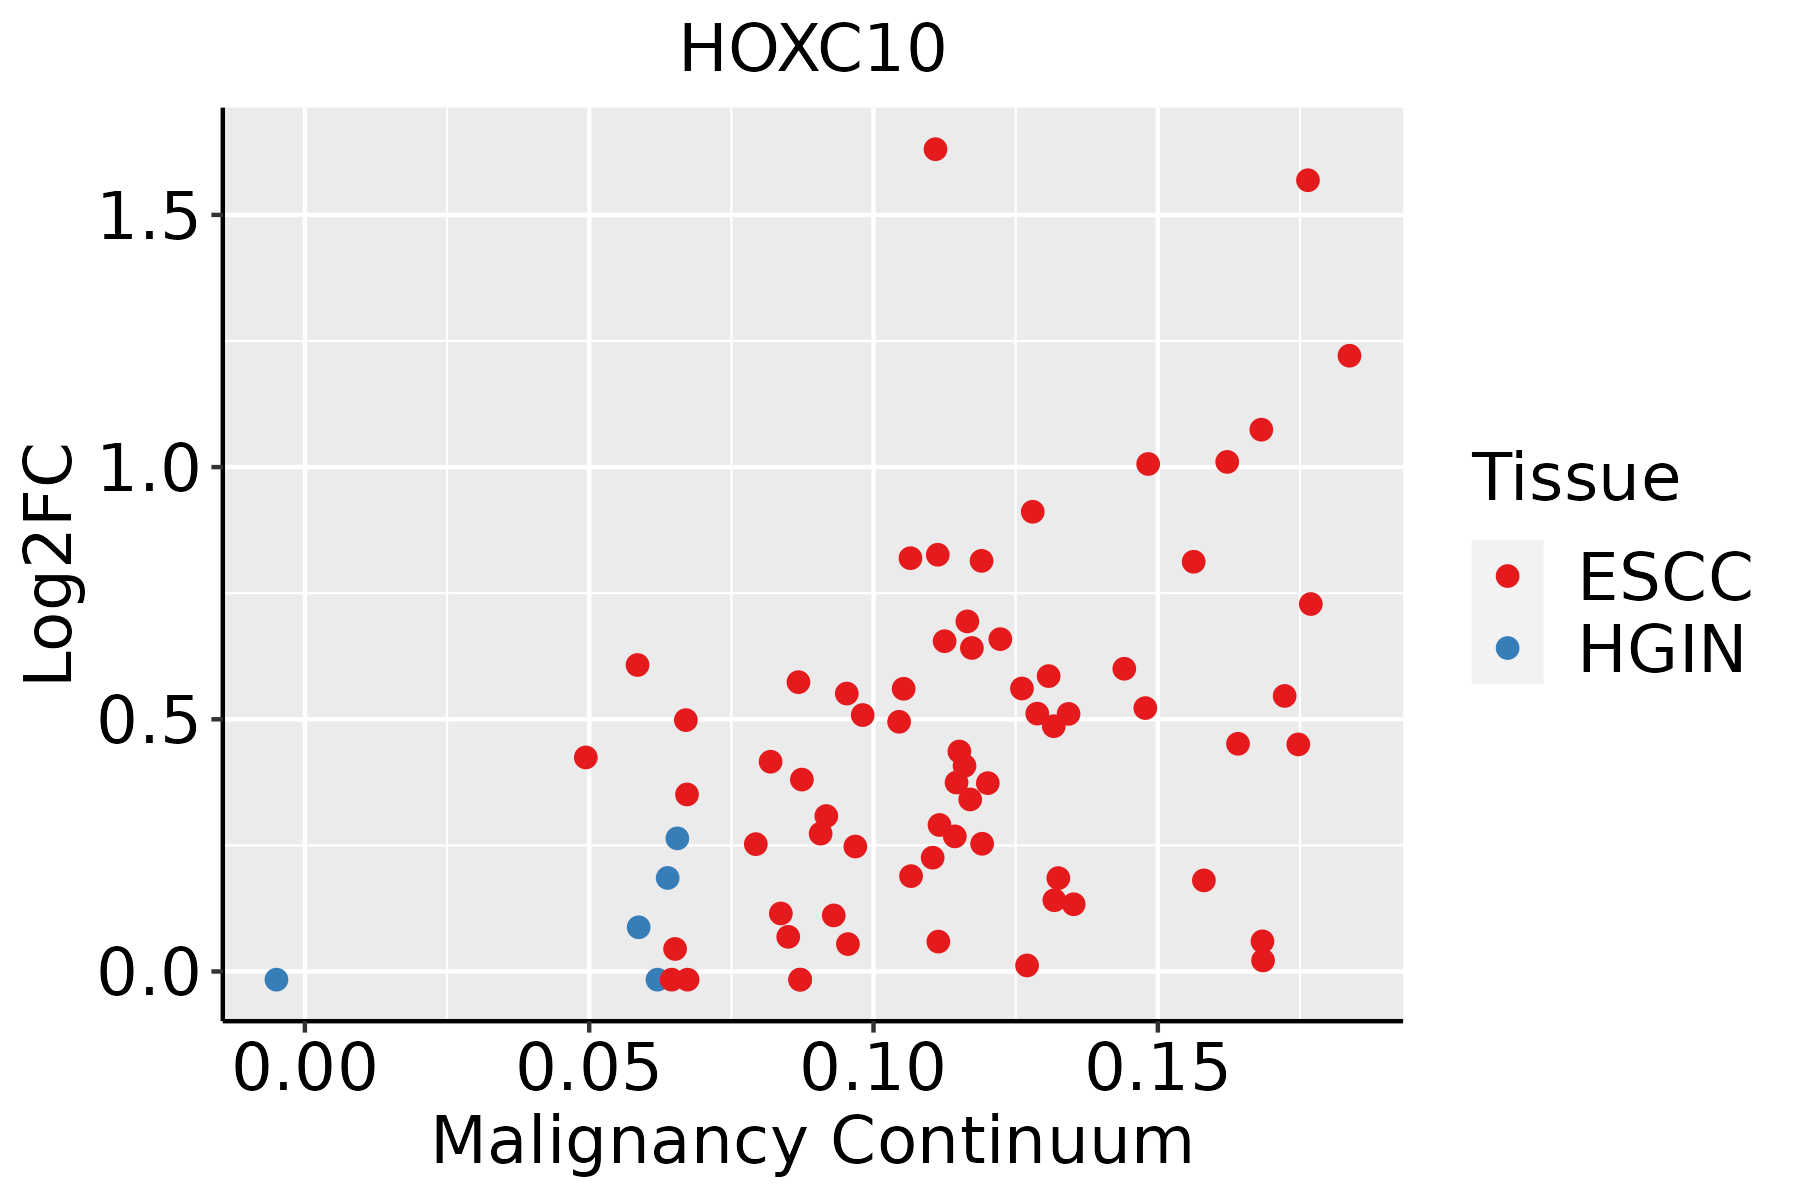 | ESCC: Esophageal squamous cell carcinoma |
| HGIN: High-grade intraepithelial neoplasias | ||
| LGIN: Low-grade intraepithelial neoplasias |
| ∗log2FC in expression of this searched gene in stem-like cells from each diseased tissue sample relative to stem-like cells in normal samples in each tissue plotted against the malignancy continuum. Samples are colored based on if they are from different disease stage. |
Top |
Malignant transformation related pathway analysis |
| Find out the enriched GO biological processes and KEGG pathways involved in transition from healthy to precancer to cancer |
| Tissue | Disease Stage | Enriched GO biological Processes |
| Colorectum | AD |  |
| Colorectum | SER |  |
| Colorectum | MSS |  |
| Colorectum | MSI-H |  |
| Colorectum | FAP |  |
| ∗Top 15 enriched GO BP terms are showed in the bar plot of each disease state in each tissue. Each row represents a significant GO biological process which is colored according to the -log10(p.adjust). |
| Page: 1 2 3 4 5 6 7 8 9 |
| GO ID | Tissue | Disease Stage | Description | Gene Ratio | Bg Ratio | pvalue | p.adjust | Count |
| GO:01061066 | Esophagus | ESCC | cold-induced thermogenesis | 80/8552 | 144/18723 | 1.07e-02 | 3.65e-02 | 80 |
| GO:01201616 | Esophagus | ESCC | regulation of cold-induced thermogenesis | 80/8552 | 144/18723 | 1.07e-02 | 3.65e-02 | 80 |
| Page: 1 |
| Pathway ID | Tissue | Disease Stage | Description | Gene Ratio | Bg Ratio | pvalue | p.adjust | qvalue | Count |
| Page: 1 |
Top |
Cell-cell communication analysis |
| Identification of potential cell-cell interactions between two cell types and their ligand-receptor pairs for different disease states |
| Ligand | Receptor | LRpair | Pathway | Tissue | Disease Stage |
| Page: 1 |
Top |
Single-cell gene regulatory network inference analysis |
| Find out the significant the regulons (TFs) and the target genes of each regulon across cell types for different disease states |
| TF | Cell Type | Tissue | Disease Stage | Target Gene | RSS | Regulon Activity |
| HOXC10 | KER | Cervix | ADJ | ZIC2,SYT15,FRGCA, etc. | 0.00e+00 |  |
| HOXC10 | BAS | Cervix | ADJ | ZIC2,SYT15,FRGCA, etc. | 0.00e+00 | |
| HOXC10 | COL | Cervix | ADJ | ZIC2,SYT15,FRGCA, etc. | 0.00e+00 | |
| ∗The dot plots of a searched regulon are shown for all cell subpopulations in each disease state of each tissue based on the regulon specific score inferred using pySCENIC and by calculating the average expression. |
| Page: 1 |
Top |
Somatic mutation of malignant transformation related genes |
| Annotation of somatic variants for genes involved in malignant transformation |
| Hugo Symbol | Variant Class | Variant Classification | dbSNP RS | HGVSc | HGVSp | HGVSp Short | SWISSPROT | BIOTYPE | SIFT | PolyPhen | Tumor Sample Barcode | Tissue | Histology | Sex | Age | Stage | Therapy Types | Drugs | Outcome |
| HOXC10 | SNV | Missense_Mutation | c.754N>A | p.Glu252Lys | p.E252K | Q9NYD6 | protein_coding | tolerated(0.16) | benign(0.017) | TCGA-A8-A09Z-01 | Breast | breast invasive carcinoma | Female | >=65 | I/II | Unknown | Unknown | SD | |
| HOXC10 | SNV | Missense_Mutation | c.978N>A | p.Met326Ile | p.M326I | Q9NYD6 | protein_coding | deleterious(0.01) | benign(0.068) | TCGA-AC-A23H-01 | Breast | breast invasive carcinoma | Female | >=65 | I/II | Unknown | Unknown | PD | |
| HOXC10 | SNV | Missense_Mutation | novel | c.284N>T | p.Pro95Leu | p.P95L | Q9NYD6 | protein_coding | tolerated(0.08) | benign(0.039) | TCGA-2W-A8YY-01 | Cervix | cervical & endocervical cancer | Female | <65 | I/II | Chemotherapy | cisplatin | CR |
| HOXC10 | SNV | Missense_Mutation | c.654G>T | p.Gln218His | p.Q218H | Q9NYD6 | protein_coding | tolerated(0.12) | benign(0.003) | TCGA-Q1-A73P-01 | Cervix | cervical & endocervical cancer | Female | <65 | I/II | Unknown | Unknown | SD | |
| HOXC10 | SNV | Missense_Mutation | novel | c.424N>A | p.Glu142Lys | p.E142K | Q9NYD6 | protein_coding | deleterious(0.02) | benign(0.166) | TCGA-VS-A9UC-01 | Cervix | cervical & endocervical cancer | Female | <65 | I/II | Chemotherapy | cisplatin | SD |
| HOXC10 | SNV | Missense_Mutation | novel | c.618N>A | p.Ser206Arg | p.S206R | Q9NYD6 | protein_coding | tolerated(0.51) | benign(0.017) | TCGA-A6-2672-01 | Colorectum | colon adenocarcinoma | Female | >=65 | III/IV | Unknown | Unknown | SD |
| HOXC10 | SNV | Missense_Mutation | c.71N>A | p.Arg24His | p.R24H | Q9NYD6 | protein_coding | tolerated(0.09) | benign(0.099) | TCGA-AZ-4615-01 | Colorectum | colon adenocarcinoma | Male | >=65 | III/IV | Chemotherapy | xeloda | PD | |
| HOXC10 | SNV | Missense_Mutation | c.662C>T | p.Ala221Val | p.A221V | Q9NYD6 | protein_coding | tolerated(0.28) | benign(0.006) | TCGA-AZ-6598-01 | Colorectum | colon adenocarcinoma | Female | >=65 | I/II | Unknown | Unknown | SD | |
| HOXC10 | SNV | Missense_Mutation | rs757985930 | c.151N>T | p.Pro51Ser | p.P51S | Q9NYD6 | protein_coding | tolerated(0.08) | probably_damaging(0.968) | TCGA-CM-4743-01 | Colorectum | colon adenocarcinoma | Male | >=65 | I/II | Chemotherapy | capecitabine | SD |
| HOXC10 | SNV | Missense_Mutation | c.359N>T | p.Ala120Val | p.A120V | Q9NYD6 | protein_coding | tolerated(0.13) | benign(0.114) | TCGA-CM-4743-01 | Colorectum | colon adenocarcinoma | Male | >=65 | I/II | Chemotherapy | capecitabine | SD |
| Page: 1 2 3 4 5 6 |
Top |
Related drugs of malignant transformation related genes |
| Identification of chemicals and drugs interact with genes involved in malignant transfromation |
| (DGIdb 4.0) |
| Entrez ID | Symbol | Category | Interaction Types | Drug Claim Name | Drug Name | PMIDs |
| Page: 1 |

Copyright 2023-Present -The University of Texas Health Science Center at Houston |