
|
|||||
|
 | |
| |
| |
| |
| |
| |
|
Gene: HOXB9 |
Gene summary for HOXB9 |
| Gene information | Species | Human | Gene symbol | HOXB9 | Gene ID | 3219 |
| Gene name | homeobox B9 | |
| Gene Alias | HOX-2.5 | |
| Cytomap | 17q21.32 | |
| Gene Type | protein-coding | GO ID | GO:0001501 | UniProtAcc | B3KPJ1 |
Top |
Malignant transformation analysis |
| Identification of the aberrant gene expression in precancerous and cancerous lesions by comparing the gene expression of stem-like cells in diseased tissues with normal stem cells |
| Entrez ID | Symbol | Replicates | Species | Organ | Tissue | Adj P-value | Log2FC | Malignancy |
| 3219 | HOXB9 | HTA11_3410_2000001011 | Human | Colorectum | AD | 6.62e-52 | 7.90e-01 | 0.0155 |
| 3219 | HOXB9 | HTA11_2487_2000001011 | Human | Colorectum | SER | 1.30e-29 | 6.60e-01 | -0.1808 |
| 3219 | HOXB9 | HTA11_2951_2000001011 | Human | Colorectum | AD | 1.84e-10 | 6.30e-01 | 0.0216 |
| 3219 | HOXB9 | HTA11_1938_2000001011 | Human | Colorectum | AD | 9.68e-63 | 1.68e+00 | -0.0811 |
| 3219 | HOXB9 | HTA11_78_2000001011 | Human | Colorectum | AD | 2.61e-59 | 1.34e+00 | -0.1088 |
| 3219 | HOXB9 | HTA11_347_2000001011 | Human | Colorectum | AD | 1.88e-77 | 1.39e+00 | -0.1954 |
| 3219 | HOXB9 | HTA11_411_2000001011 | Human | Colorectum | SER | 1.35e-12 | 6.90e-01 | -0.2602 |
| 3219 | HOXB9 | HTA11_2112_2000001011 | Human | Colorectum | SER | 8.76e-08 | 7.96e-01 | -0.2196 |
| 3219 | HOXB9 | HTA11_3361_2000001011 | Human | Colorectum | AD | 6.73e-31 | 9.81e-01 | -0.1207 |
| 3219 | HOXB9 | HTA11_83_2000001011 | Human | Colorectum | SER | 3.22e-35 | 1.06e+00 | -0.1526 |
| 3219 | HOXB9 | HTA11_696_2000001011 | Human | Colorectum | AD | 4.40e-57 | 1.03e+00 | -0.1464 |
| 3219 | HOXB9 | HTA11_866_2000001011 | Human | Colorectum | AD | 1.11e-46 | 8.30e-01 | -0.1001 |
| 3219 | HOXB9 | HTA11_1391_2000001011 | Human | Colorectum | AD | 3.00e-59 | 1.56e+00 | -0.059 |
| 3219 | HOXB9 | HTA11_2992_2000001011 | Human | Colorectum | SER | 1.51e-04 | 3.10e-01 | -0.1706 |
| 3219 | HOXB9 | HTA11_5212_2000001011 | Human | Colorectum | AD | 2.61e-16 | 6.36e-01 | -0.2061 |
| 3219 | HOXB9 | HTA11_5216_2000001011 | Human | Colorectum | SER | 3.05e-27 | 1.07e+00 | -0.1462 |
| 3219 | HOXB9 | HTA11_546_2000001011 | Human | Colorectum | AD | 2.07e-24 | 9.27e-01 | -0.0842 |
| 3219 | HOXB9 | HTA11_9341_2000001011 | Human | Colorectum | SER | 3.12e-22 | 1.13e+00 | -0.00410000000000005 |
| 3219 | HOXB9 | HTA11_7862_2000001011 | Human | Colorectum | AD | 6.13e-34 | 1.02e+00 | -0.0179 |
| 3219 | HOXB9 | HTA11_866_3004761011 | Human | Colorectum | AD | 2.62e-50 | 1.07e+00 | 0.096 |
| Page: 1 2 |
| Tissue | Expression Dynamics | Abbreviation |
| Colorectum (GSE201348) | 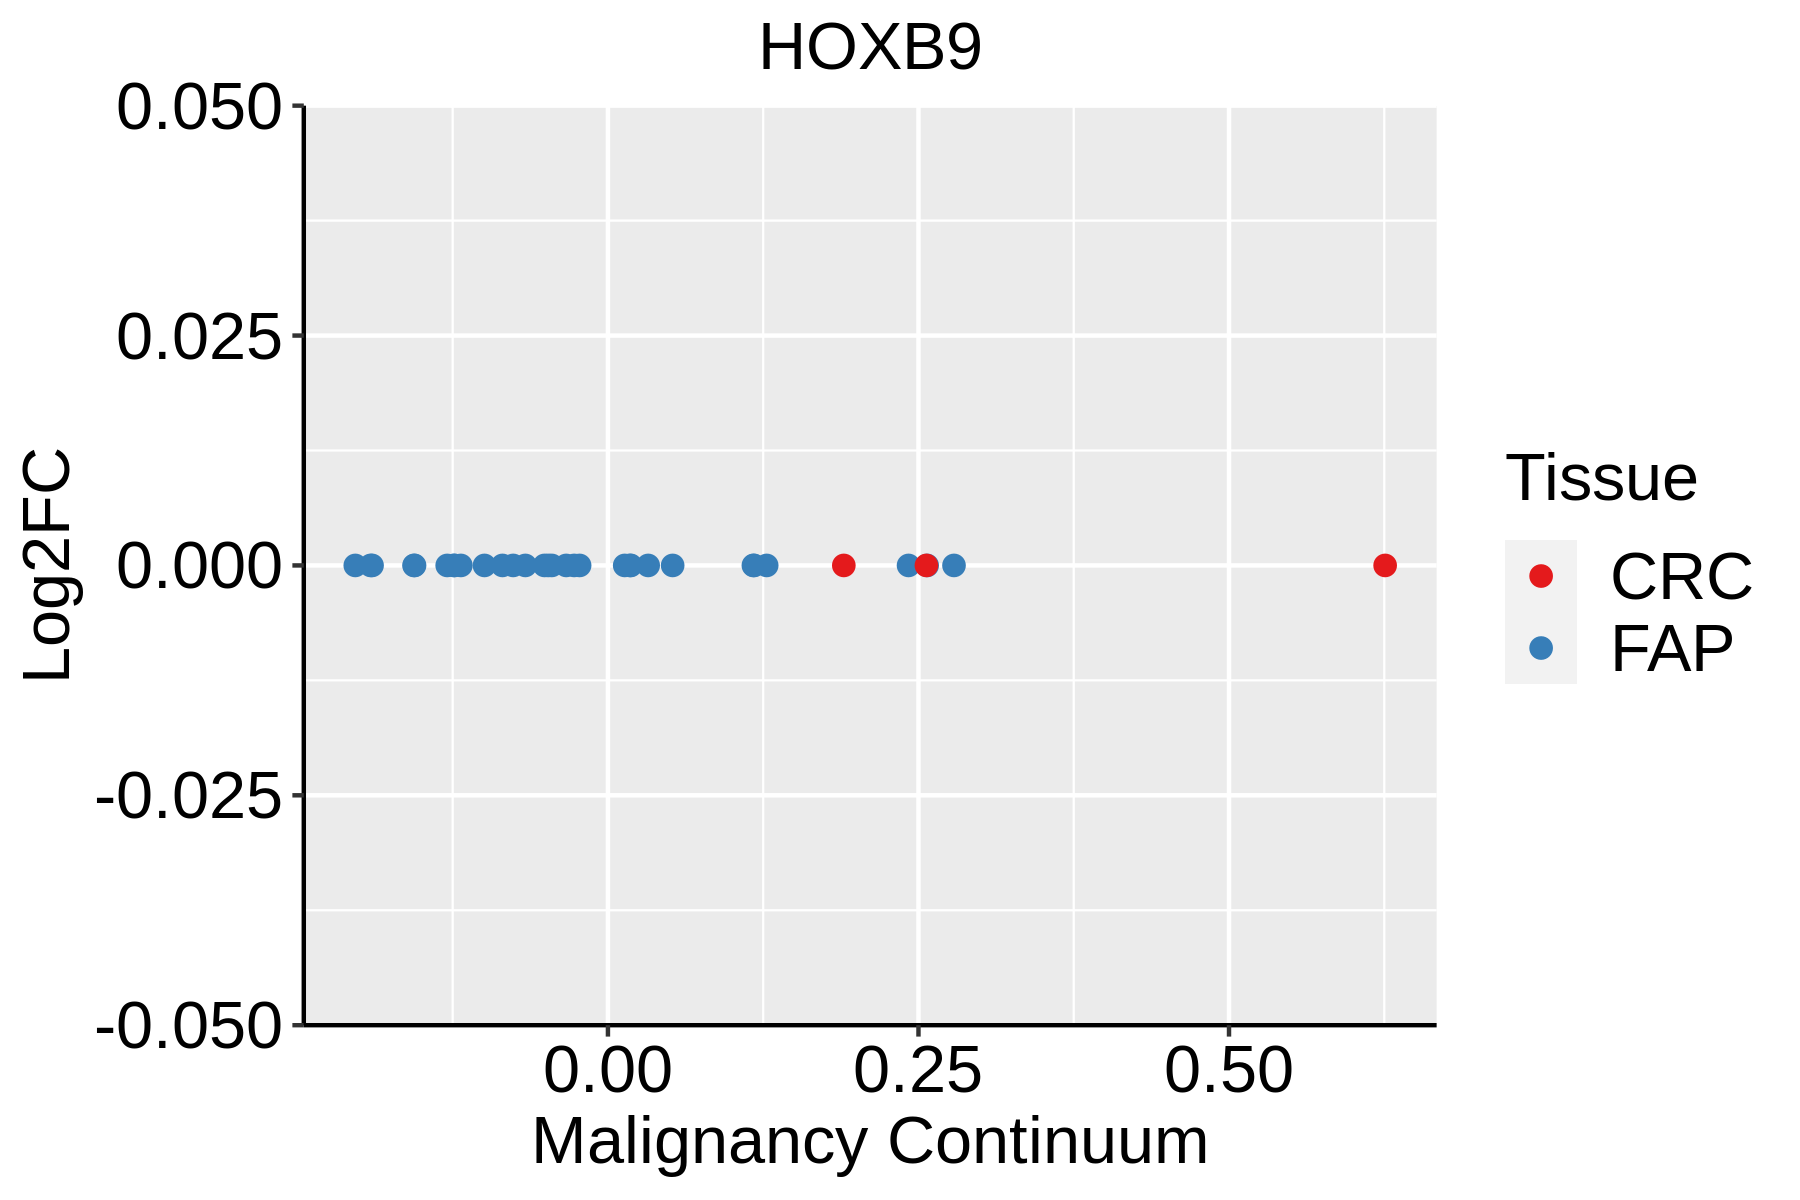 | FAP: Familial adenomatous polyposis |
| CRC: Colorectal cancer | ||
| Colorectum (HTA11) |  | AD: Adenomas |
| SER: Sessile serrated lesions | ||
| MSI-H: Microsatellite-high colorectal cancer | ||
| MSS: Microsatellite stable colorectal cancer |
| ∗log2FC in expression of this searched gene in stem-like cells from each diseased tissue sample relative to stem-like cells in normal samples in each tissue plotted against the malignancy continuum. Samples are colored based on if they are from different disease stage. |
Top |
Malignant transformation related pathway analysis |
| Find out the enriched GO biological processes and KEGG pathways involved in transition from healthy to precancer to cancer |
| Tissue | Disease Stage | Enriched GO biological Processes |
| Colorectum | AD |  |
| Colorectum | SER |  |
| Colorectum | MSS |  |
| Colorectum | MSI-H |  |
| Colorectum | FAP |  |
| ∗Top 15 enriched GO BP terms are showed in the bar plot of each disease state in each tissue. Each row represents a significant GO biological process which is colored according to the -log10(p.adjust). |
| Page: 1 2 3 4 5 6 7 8 9 |
| GO ID | Tissue | Disease Stage | Description | Gene Ratio | Bg Ratio | pvalue | p.adjust | Count |
| GO:0048732 | Colorectum | AD | gland development | 149/3918 | 436/18723 | 6.07e-11 | 6.33e-09 | 149 |
| GO:0030879 | Colorectum | AD | mammary gland development | 53/3918 | 137/18723 | 1.46e-06 | 4.58e-05 | 53 |
| GO:0048568 | Colorectum | AD | embryonic organ development | 112/3918 | 427/18723 | 4.60e-03 | 3.14e-02 | 112 |
| GO:00487321 | Colorectum | SER | gland development | 112/2897 | 436/18723 | 1.75e-08 | 1.28e-06 | 112 |
| GO:00308791 | Colorectum | SER | mammary gland development | 37/2897 | 137/18723 | 3.61e-04 | 5.61e-03 | 37 |
| GO:00487322 | Colorectum | MSS | gland development | 143/3467 | 436/18723 | 3.85e-13 | 8.01e-11 | 143 |
| GO:00308792 | Colorectum | MSS | mammary gland development | 51/3467 | 137/18723 | 1.88e-07 | 8.26e-06 | 51 |
| GO:00485681 | Colorectum | MSS | embryonic organ development | 100/3467 | 427/18723 | 6.00e-03 | 4.03e-02 | 100 |
| GO:00487323 | Colorectum | MSI-H | gland development | 53/1319 | 436/18723 | 7.08e-05 | 2.35e-03 | 53 |
| Page: 1 |
| Pathway ID | Tissue | Disease Stage | Description | Gene Ratio | Bg Ratio | pvalue | p.adjust | qvalue | Count |
| Page: 1 |
Top |
Cell-cell communication analysis |
| Identification of potential cell-cell interactions between two cell types and their ligand-receptor pairs for different disease states |
| Ligand | Receptor | LRpair | Pathway | Tissue | Disease Stage |
| Page: 1 |
Top |
Single-cell gene regulatory network inference analysis |
| Find out the significant the regulons (TFs) and the target genes of each regulon across cell types for different disease states |
| TF | Cell Type | Tissue | Disease Stage | Target Gene | RSS | Regulon Activity |
| HOXB9 | ASC | Colorectum | AD | RP11-357H14.17,HOXB-AS4,HOXB6, etc. | 2.69e-01 |  |
| HOXB9 | STM | Colorectum | MSS | RP11-357H14.17,HOXB-AS4,HOXB6, etc. | 2.62e-01 |  |
| ∗The dot plots of a searched regulon are shown for all cell subpopulations in each disease state of each tissue based on the regulon specific score inferred using pySCENIC and by calculating the average expression. |
| Page: 1 |
Top |
Somatic mutation of malignant transformation related genes |
| Annotation of somatic variants for genes involved in malignant transformation |
| Hugo Symbol | Variant Class | Variant Classification | dbSNP RS | HGVSc | HGVSp | HGVSp Short | SWISSPROT | BIOTYPE | SIFT | PolyPhen | Tumor Sample Barcode | Tissue | Histology | Sex | Age | Stage | Therapy Types | Drugs | Outcome |
| HOXB9 | SNV | Missense_Mutation | novel | c.601N>A | p.Glu201Lys | p.E201K | P17482 | protein_coding | deleterious(0) | probably_damaging(0.997) | TCGA-5L-AAT1-01 | Breast | breast invasive carcinoma | Female | <65 | III/IV | Hormone Therapy | letrozol | SD |
| HOXB9 | SNV | Missense_Mutation | c.457N>G | p.Pro153Ala | p.P153A | P17482 | protein_coding | tolerated(0.17) | benign(0.003) | TCGA-AC-A23H-01 | Breast | breast invasive carcinoma | Female | >=65 | I/II | Unknown | Unknown | PD | |
| HOXB9 | deletion | Frame_Shift_Del | c.415delG | p.Glu139LysfsTer62 | p.E139Kfs*62 | P17482 | protein_coding | TCGA-E2-A1IN-01 | Breast | breast invasive carcinoma | Female | <65 | I/II | Hormone Therapy | arimidex | SD | |||
| HOXB9 | SNV | Missense_Mutation | novel | c.146N>T | p.Ser49Leu | p.S49L | P17482 | protein_coding | deleterious(0.01) | probably_damaging(0.997) | TCGA-EA-A3HU-01 | Cervix | cervical & endocervical cancer | Female | <65 | I/II | Unknown | Unknown | SD |
| HOXB9 | SNV | Missense_Mutation | c.477N>C | p.Lys159Asn | p.K159N | P17482 | protein_coding | tolerated(0.5) | benign(0.003) | TCGA-AA-3510-01 | Colorectum | colon adenocarcinoma | Male | >=65 | I/II | Unknown | Unknown | SD | |
| HOXB9 | SNV | Missense_Mutation | rs747302611 | c.706C>T | p.Arg236Trp | p.R236W | P17482 | protein_coding | deleterious(0) | probably_damaging(0.999) | TCGA-AA-3663-01 | Colorectum | colon adenocarcinoma | Male | <65 | I/II | Unknown | Unknown | SD |
| HOXB9 | SNV | Missense_Mutation | novel | c.380A>G | p.Glu127Gly | p.E127G | P17482 | protein_coding | tolerated(0.17) | benign(0.067) | TCGA-CM-5349-01 | Colorectum | colon adenocarcinoma | Female | >=65 | I/II | Unknown | Unknown | SD |
| HOXB9 | SNV | Missense_Mutation | rs200221711 | c.413N>C | p.Leu138Ser | p.L138S | P17482 | protein_coding | tolerated(0.44) | benign(0.26) | TCGA-AG-A02N-01 | Colorectum | rectum adenocarcinoma | Male | >=65 | I/II | Chemotherapy | folinic | CR |
| HOXB9 | SNV | Missense_Mutation | novel | c.479N>G | p.Ile160Ser | p.I160S | P17482 | protein_coding | tolerated(0.51) | benign(0.018) | TCGA-A5-A2K5-01 | Endometrium | uterine corpus endometrioid carcinoma | Female | >=65 | I/II | Unknown | Unknown | SD |
| HOXB9 | SNV | Missense_Mutation | rs200177550 | c.529G>A | p.Ala177Thr | p.A177T | P17482 | protein_coding | deleterious(0) | probably_damaging(0.995) | TCGA-AP-A0LM-01 | Endometrium | uterine corpus endometrioid carcinoma | Female | <65 | III/IV | Chemotherapy | cisplatin | SD |
| Page: 1 2 3 |
Top |
Related drugs of malignant transformation related genes |
| Identification of chemicals and drugs interact with genes involved in malignant transfromation |
| (DGIdb 4.0) |
| Entrez ID | Symbol | Category | Interaction Types | Drug Claim Name | Drug Name | PMIDs |
| Page: 1 |

Copyright 2023-Present -The University of Texas Health Science Center at Houston |