
|
|||||
|
 | |
| |
| |
| |
| |
| |
|
Gene: HOXB7 |
Gene summary for HOXB7 |
| Gene information | Species | Human | Gene symbol | HOXB7 | Gene ID | 3217 |
| Gene name | homeobox B7 | |
| Gene Alias | HHO.C1 | |
| Cytomap | 17q21.32 | |
| Gene Type | protein-coding | GO ID | GO:0001501 | UniProtAcc | P09629 |
Top |
Malignant transformation analysis |
| Identification of the aberrant gene expression in precancerous and cancerous lesions by comparing the gene expression of stem-like cells in diseased tissues with normal stem cells |
| Entrez ID | Symbol | Replicates | Species | Organ | Tissue | Adj P-value | Log2FC | Malignancy |
| 3217 | HOXB7 | HTA11_347_2000001011 | Human | Colorectum | AD | 4.96e-03 | 3.08e-01 | -0.1954 |
| 3217 | HOXB7 | HTA11_1391_2000001011 | Human | Colorectum | AD | 1.33e-03 | 4.39e-01 | -0.059 |
| 3217 | HOXB7 | HTA11_99999970781_79442 | Human | Colorectum | MSS | 6.76e-10 | 5.09e-01 | 0.294 |
| 3217 | HOXB7 | HTA11_99999965104_69814 | Human | Colorectum | MSS | 2.44e-07 | 6.89e-01 | 0.281 |
| 3217 | HOXB7 | A015-C-203 | Human | Colorectum | FAP | 3.44e-05 | -1.22e-01 | -0.1294 |
| 3217 | HOXB7 | A001-C-119 | Human | Colorectum | FAP | 2.11e-02 | -2.03e-01 | -0.1557 |
| 3217 | HOXB7 | A002-C-205 | Human | Colorectum | FAP | 5.45e-05 | -6.04e-02 | -0.1236 |
| 3217 | HOXB7 | A001-C-104 | Human | Colorectum | FAP | 4.06e-02 | 2.53e-01 | 0.0184 |
| 3217 | HOXB7 | A015-C-006 | Human | Colorectum | FAP | 1.01e-03 | -9.48e-02 | -0.0994 |
| 3217 | HOXB7 | A002-C-114 | Human | Colorectum | FAP | 1.56e-04 | -9.45e-02 | -0.1561 |
| 3217 | HOXB7 | A015-C-104 | Human | Colorectum | FAP | 1.57e-03 | -1.57e-01 | -0.1899 |
| 3217 | HOXB7 | A002-C-016 | Human | Colorectum | FAP | 5.71e-03 | 2.06e-03 | 0.0521 |
| 3217 | HOXB7 | A002-C-116 | Human | Colorectum | FAP | 1.15e-04 | -7.68e-02 | -0.0452 |
| 3217 | HOXB7 | A018-E-020 | Human | Colorectum | FAP | 5.42e-05 | -1.65e-01 | -0.2034 |
| 3217 | HOXB7 | F034 | Human | Colorectum | FAP | 4.90e-03 | 1.25e-01 | -0.0665 |
| 3217 | HOXB7 | LZE4T | Human | Esophagus | ESCC | 6.60e-04 | 2.15e-01 | 0.0811 |
| 3217 | HOXB7 | LZE5T | Human | Esophagus | ESCC | 2.71e-03 | 3.45e-01 | 0.0514 |
| 3217 | HOXB7 | LZE7T | Human | Esophagus | ESCC | 1.28e-08 | 5.32e-01 | 0.0667 |
| 3217 | HOXB7 | LZE8T | Human | Esophagus | ESCC | 1.21e-06 | 2.26e-01 | 0.067 |
| 3217 | HOXB7 | LZE22T | Human | Esophagus | ESCC | 7.84e-05 | 3.18e-01 | 0.068 |
| Page: 1 2 3 4 5 |
| Tissue | Expression Dynamics | Abbreviation |
| Colorectum (GSE201348) |  | FAP: Familial adenomatous polyposis |
| CRC: Colorectal cancer | ||
| Colorectum (HTA11) |  | AD: Adenomas |
| SER: Sessile serrated lesions | ||
| MSI-H: Microsatellite-high colorectal cancer | ||
| MSS: Microsatellite stable colorectal cancer | ||
| Esophagus |  | ESCC: Esophageal squamous cell carcinoma |
| HGIN: High-grade intraepithelial neoplasias | ||
| LGIN: Low-grade intraepithelial neoplasias | ||
| Oral Cavity | 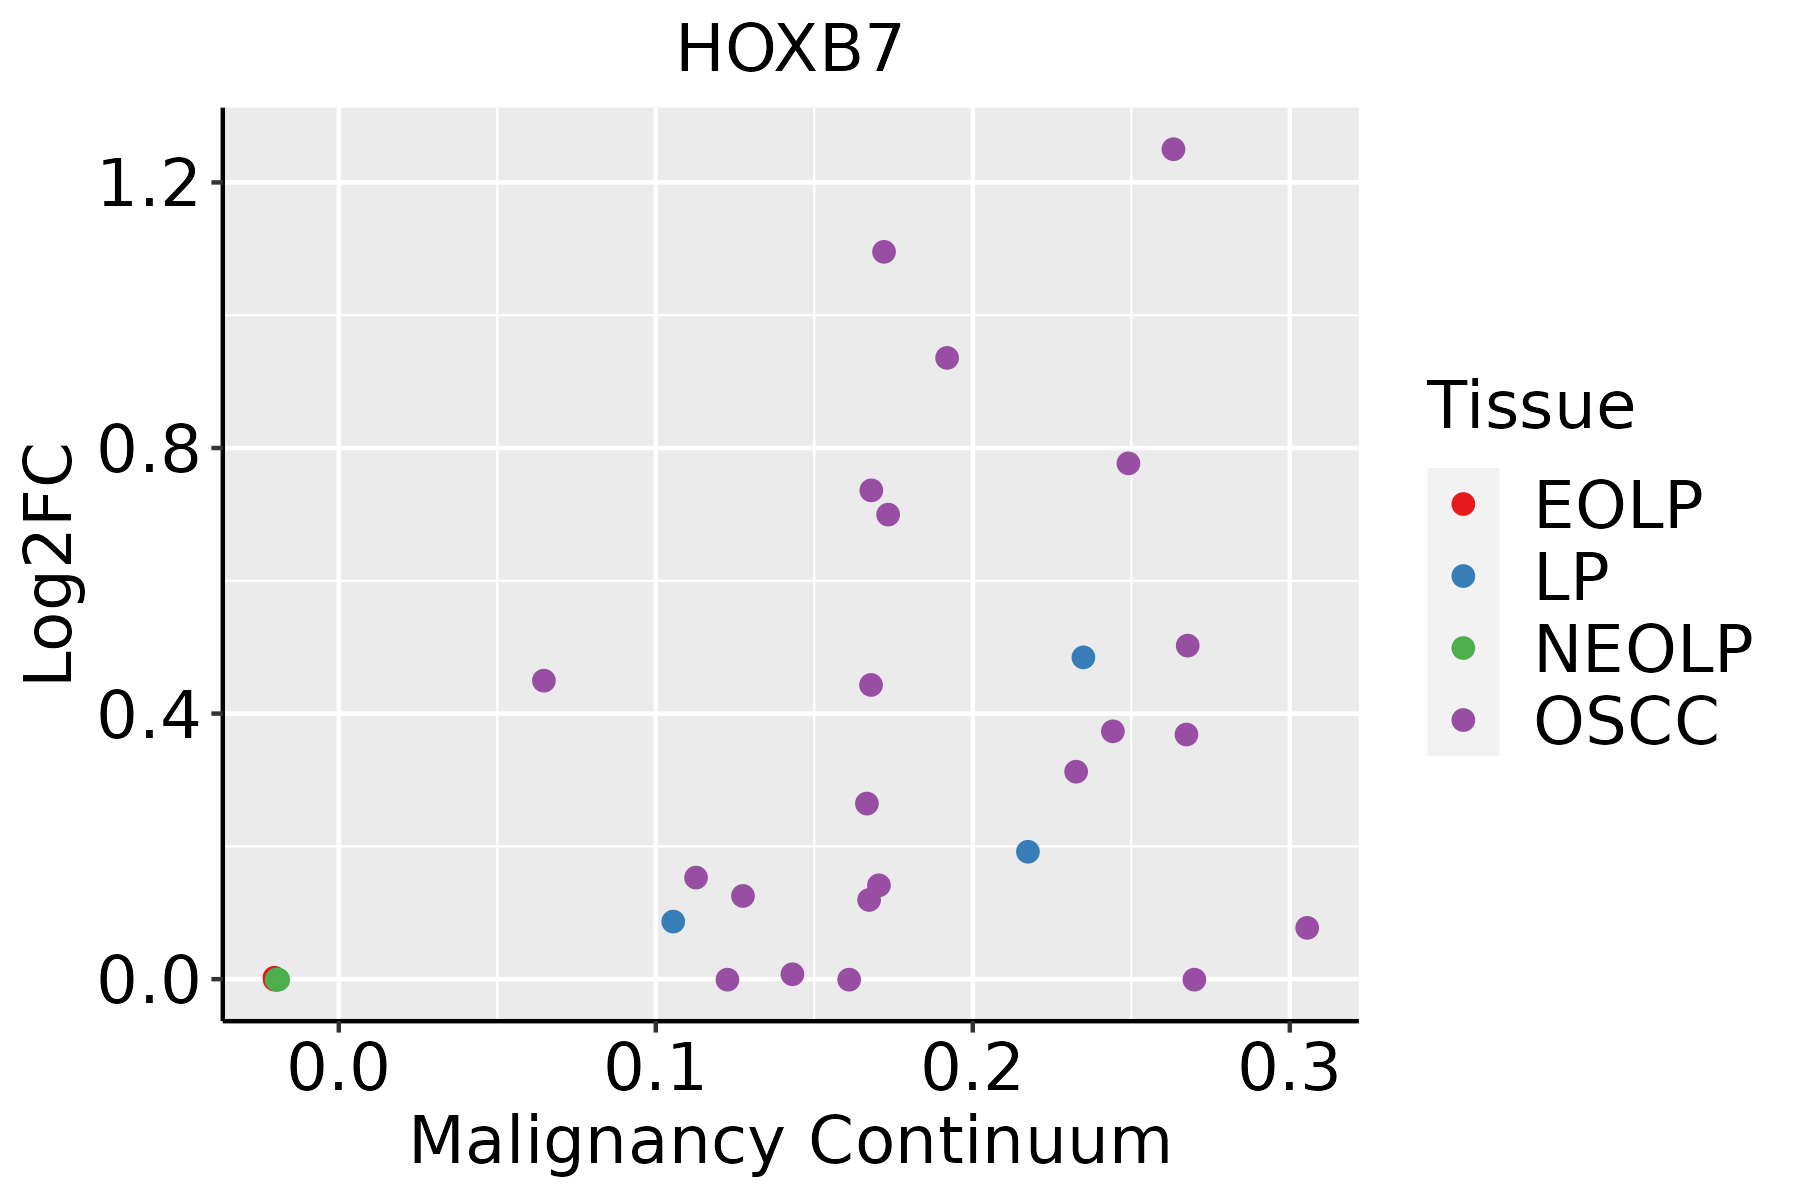 | EOLP: Erosive Oral lichen planus |
| LP: leukoplakia | ||
| NEOLP: Non-erosive oral lichen planus | ||
| OSCC: Oral squamous cell carcinoma | ||
| Skin | 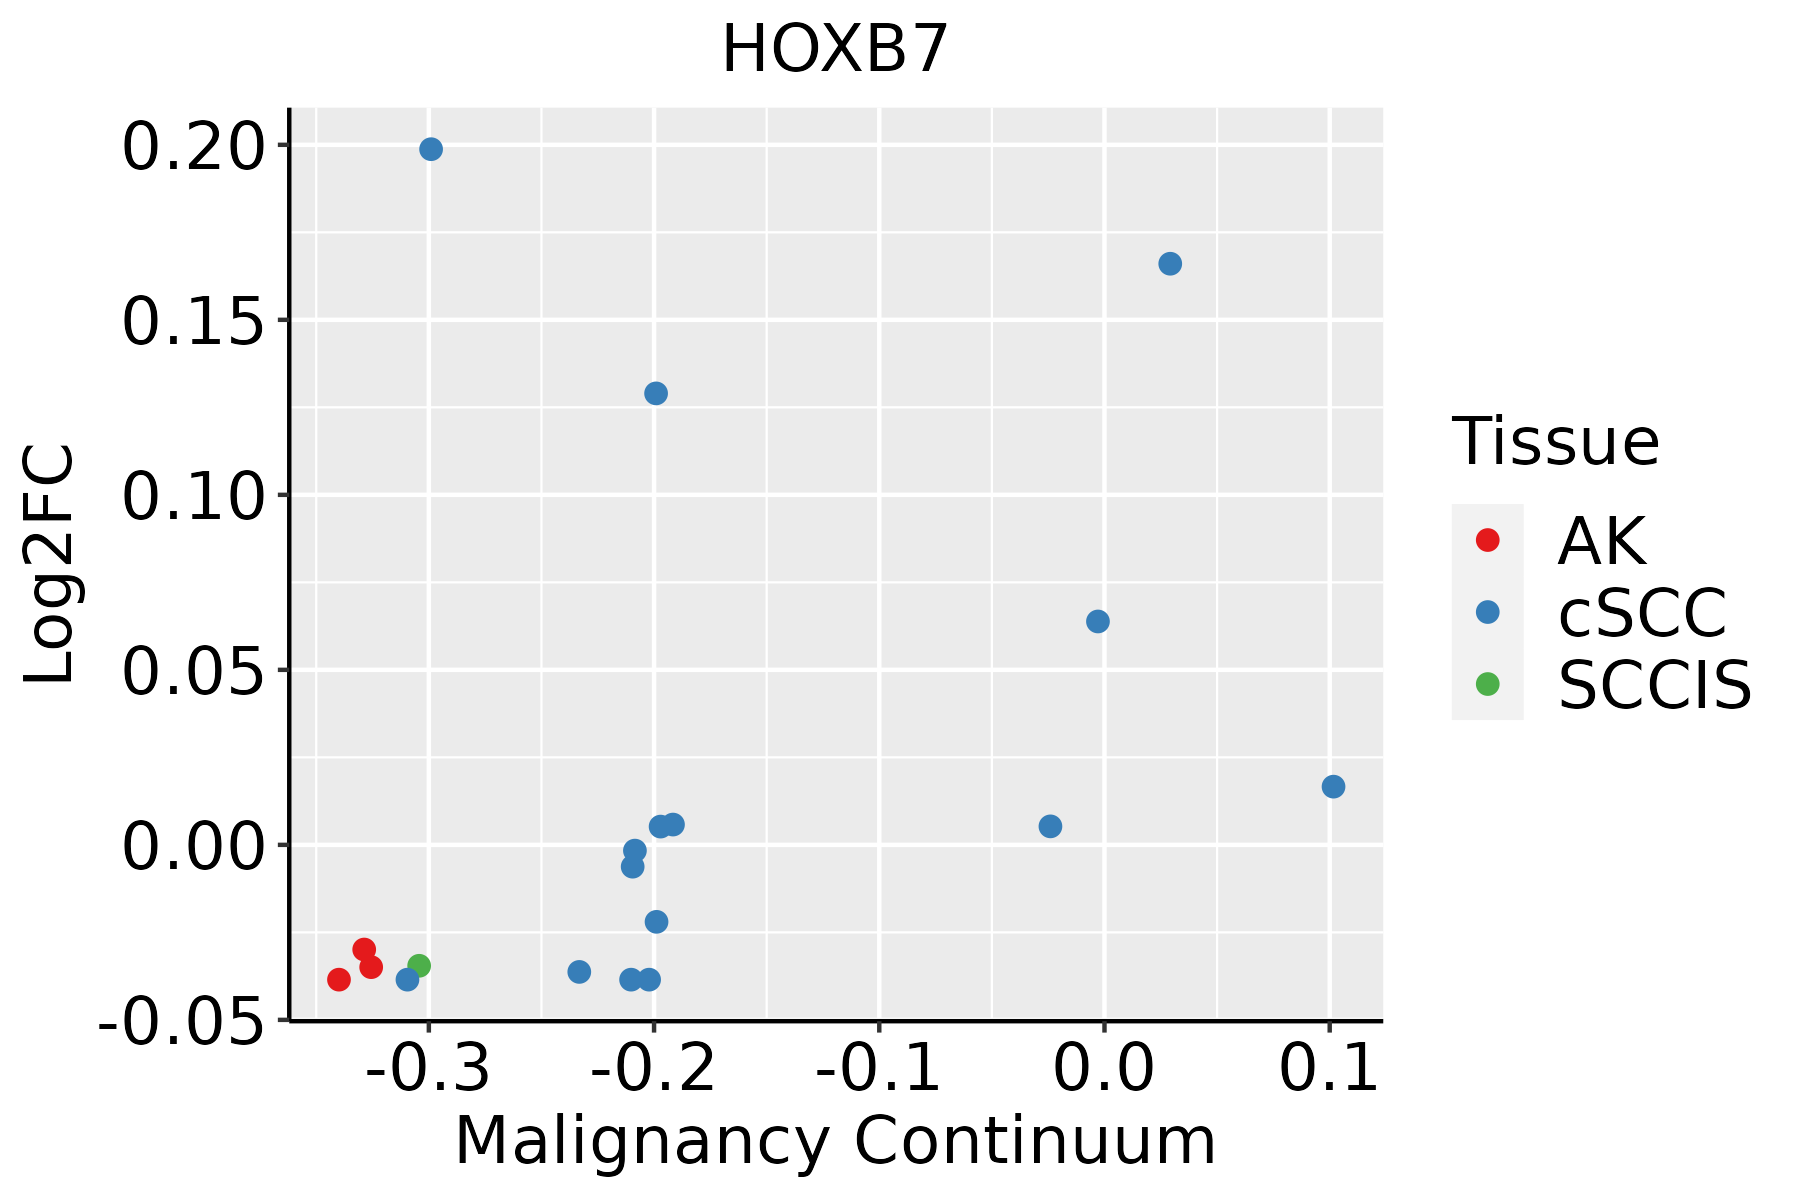 | AK: Actinic keratosis |
| cSCC: Cutaneous squamous cell carcinoma | ||
| SCCIS:squamous cell carcinoma in situ |
| ∗log2FC in expression of this searched gene in stem-like cells from each diseased tissue sample relative to stem-like cells in normal samples in each tissue plotted against the malignancy continuum. Samples are colored based on if they are from different disease stage. |
Top |
Malignant transformation related pathway analysis |
| Find out the enriched GO biological processes and KEGG pathways involved in transition from healthy to precancer to cancer |
| Tissue | Disease Stage | Enriched GO biological Processes |
| Colorectum | AD |  |
| Colorectum | SER |  |
| Colorectum | MSS |  |
| Colorectum | MSI-H |  |
| Colorectum | FAP |  |
| ∗Top 15 enriched GO BP terms are showed in the bar plot of each disease state in each tissue. Each row represents a significant GO biological process which is colored according to the -log10(p.adjust). |
| Page: 1 2 3 4 5 6 7 8 9 |
| GO ID | Tissue | Disease Stage | Description | Gene Ratio | Bg Ratio | pvalue | p.adjust | Count |
| GO:0030099 | Colorectum | AD | myeloid cell differentiation | 119/3918 | 381/18723 | 1.24e-06 | 4.01e-05 | 119 |
| GO:0060562 | Colorectum | AD | epithelial tube morphogenesis | 93/3918 | 325/18723 | 5.65e-04 | 6.00e-03 | 93 |
| GO:0072073 | Colorectum | AD | kidney epithelium development | 42/3918 | 136/18723 | 4.02e-03 | 2.80e-02 | 42 |
| GO:0048568 | Colorectum | AD | embryonic organ development | 112/3918 | 427/18723 | 4.60e-03 | 3.14e-02 | 112 |
| GO:0001763 | Colorectum | AD | morphogenesis of a branching structure | 56/3918 | 196/18723 | 6.60e-03 | 4.09e-02 | 56 |
| GO:00300992 | Colorectum | MSS | myeloid cell differentiation | 110/3467 | 381/18723 | 4.48e-07 | 1.75e-05 | 110 |
| GO:00605621 | Colorectum | MSS | epithelial tube morphogenesis | 88/3467 | 325/18723 | 8.45e-05 | 1.37e-03 | 88 |
| GO:00017631 | Colorectum | MSS | morphogenesis of a branching structure | 55/3467 | 196/18723 | 6.70e-04 | 7.25e-03 | 55 |
| GO:0061138 | Colorectum | MSS | morphogenesis of a branching epithelium | 51/3467 | 182/18723 | 1.06e-03 | 1.05e-02 | 51 |
| GO:00720731 | Colorectum | MSS | kidney epithelium development | 38/3467 | 136/18723 | 4.53e-03 | 3.19e-02 | 38 |
| GO:00485681 | Colorectum | MSS | embryonic organ development | 100/3467 | 427/18723 | 6.00e-03 | 4.03e-02 | 100 |
| GO:0001655 | Colorectum | MSS | urogenital system development | 81/3467 | 338/18723 | 6.88e-03 | 4.43e-02 | 81 |
| GO:00300994 | Colorectum | FAP | myeloid cell differentiation | 81/2622 | 381/18723 | 6.33e-05 | 1.22e-03 | 81 |
| GO:00605622 | Colorectum | FAP | epithelial tube morphogenesis | 71/2622 | 325/18723 | 7.23e-05 | 1.33e-03 | 71 |
| GO:00720732 | Colorectum | FAP | kidney epithelium development | 35/2622 | 136/18723 | 2.03e-04 | 2.92e-03 | 35 |
| GO:00016551 | Colorectum | FAP | urogenital system development | 70/2622 | 338/18723 | 4.26e-04 | 5.11e-03 | 70 |
| GO:0072001 | Colorectum | FAP | renal system development | 63/2622 | 302/18723 | 6.59e-04 | 7.19e-03 | 63 |
| GO:0001822 | Colorectum | FAP | kidney development | 61/2622 | 293/18723 | 8.38e-04 | 8.72e-03 | 61 |
| GO:00017632 | Colorectum | FAP | morphogenesis of a branching structure | 44/2622 | 196/18723 | 8.79e-04 | 9.01e-03 | 44 |
| GO:0072009 | Colorectum | FAP | nephron epithelium development | 27/2622 | 109/18723 | 1.89e-03 | 1.60e-02 | 27 |
| Page: 1 2 |
| Pathway ID | Tissue | Disease Stage | Description | Gene Ratio | Bg Ratio | pvalue | p.adjust | qvalue | Count |
| Page: 1 |
Top |
Cell-cell communication analysis |
| Identification of potential cell-cell interactions between two cell types and their ligand-receptor pairs for different disease states |
| Ligand | Receptor | LRpair | Pathway | Tissue | Disease Stage |
| Page: 1 |
Top |
Single-cell gene regulatory network inference analysis |
| Find out the significant the regulons (TFs) and the target genes of each regulon across cell types for different disease states |
| TF | Cell Type | Tissue | Disease Stage | Target Gene | RSS | Regulon Activity |
| HOXB7 | COL | Cervix | N_HPV | UNC5B-AS1,HOXB2,TMEM61, etc. | 3.94e-01 |  |
| HOXB7 | CILIA | Endometrium | AEH | HOXB2,ASRGL1,NDUFA13, etc. | 1.97e-01 |  |
| HOXB7 | CILIA | Endometrium | Healthy | HOMER2,MUC1,SAT1, etc. | 3.83e-02 |  |
| HOXB7 | APCAF | Pancreas | ADJ | TMEM140,CLDN5,MPP2, etc. | 7.46e-03 |  |
| HOXB7 | CYC | Skin | ADJ | SPON2,IGFBP6,OSR2, etc. | -4.44e-16 |  |
| HOXB7 | PIL | Skin | AK | SPON2,IGFBP6,OSR2, etc. | 0.00e+00 |  |
| HOXB7 | KER | Skin | AK | SPON2,IGFBP6,OSR2, etc. | 0.00e+00 | |
| HOXB7 | PIL | Skin | cSCC | SPON2,IGFBP6,OSR2, etc. | 9.17e-03 |  |
| HOXB7 | CYC | Skin | cSCC | SPON2,IGFBP6,OSR2, etc. | 0.00e+00 | |
| HOXB7 | ECC | Skin | cSCC | SPON2,IGFBP6,OSR2, etc. | 0.00e+00 | |
| ∗The dot plots of a searched regulon are shown for all cell subpopulations in each disease state of each tissue based on the regulon specific score inferred using pySCENIC and by calculating the average expression. |
| Page: 1 2 3 |
Top |
Somatic mutation of malignant transformation related genes |
| Annotation of somatic variants for genes involved in malignant transformation |
| Hugo Symbol | Variant Class | Variant Classification | dbSNP RS | HGVSc | HGVSp | HGVSp Short | SWISSPROT | BIOTYPE | SIFT | PolyPhen | Tumor Sample Barcode | Tissue | Histology | Sex | Age | Stage | Therapy Types | Drugs | Outcome |
| HOXB7 | SNV | Missense_Mutation | c.619N>C | p.Asp207His | p.D207H | P09629 | protein_coding | deleterious(0) | possibly_damaging(0.862) | TCGA-AC-A23H-01 | Breast | breast invasive carcinoma | Female | >=65 | I/II | Unknown | Unknown | PD | |
| HOXB7 | SNV | Missense_Mutation | novel | c.107N>T | p.Ser36Phe | p.S36F | P09629 | protein_coding | deleterious(0.01) | possibly_damaging(0.575) | TCGA-2W-A8YY-01 | Cervix | cervical & endocervical cancer | Female | <65 | I/II | Chemotherapy | cisplatin | CR |
| HOXB7 | SNV | Missense_Mutation | novel | c.392N>A | p.Arg131Gln | p.R131Q | P09629 | protein_coding | tolerated(0.07) | possibly_damaging(0.836) | TCGA-JW-AAVH-01 | Cervix | cervical & endocervical cancer | Female | <65 | I/II | Unknown | Unknown | SD |
| HOXB7 | SNV | Missense_Mutation | rs770931876 | c.478C>T | p.Arg160Cys | p.R160C | P09629 | protein_coding | deleterious(0) | probably_damaging(0.982) | TCGA-AA-3975-01 | Colorectum | colon adenocarcinoma | Male | >=65 | I/II | Unknown | Unknown | SD |
| HOXB7 | deletion | Frame_Shift_Del | rs769072505 | c.191delN | p.Gly64AlafsTer99 | p.G64Afs*99 | P09629 | protein_coding | TCGA-AD-6889-01 | Colorectum | colon adenocarcinoma | Male | >=65 | I/II | Chemotherapy | xeloda | PD | ||
| HOXB7 | SNV | Missense_Mutation | novel | c.490N>T | p.Arg164Trp | p.R164W | P09629 | protein_coding | deleterious(0) | probably_damaging(0.993) | TCGA-A5-A0G2-01 | Endometrium | uterine corpus endometrioid carcinoma | Female | <65 | III/IV | Unknown | Unknown | SD |
| HOXB7 | SNV | Missense_Mutation | c.620N>G | p.Asp207Gly | p.D207G | P09629 | protein_coding | deleterious(0.01) | benign(0.025) | TCGA-AP-A056-01 | Endometrium | uterine corpus endometrioid carcinoma | Female | <65 | I/II | Unknown | Unknown | SD | |
| HOXB7 | SNV | Missense_Mutation | c.92N>A | p.Ser31Tyr | p.S31Y | P09629 | protein_coding | deleterious(0) | possibly_damaging(0.907) | TCGA-AP-A1E0-01 | Endometrium | uterine corpus endometrioid carcinoma | Female | <65 | III/IV | Chemotherapy | paclitaxel | SD | |
| HOXB7 | SNV | Missense_Mutation | c.496C>T | p.Arg166Trp | p.R166W | P09629 | protein_coding | deleterious(0) | probably_damaging(0.999) | TCGA-AX-A06F-01 | Endometrium | uterine corpus endometrioid carcinoma | Female | <65 | III/IV | Chemotherapy | carboplatin | SD | |
| HOXB7 | SNV | Missense_Mutation | novel | c.535N>G | p.Arg179Gly | p.R179G | P09629 | protein_coding | deleterious(0) | probably_damaging(1) | TCGA-AX-A3FT-01 | Endometrium | uterine corpus endometrioid carcinoma | Female | <65 | I/II | Unknown | Unknown | SD |
| Page: 1 2 3 |
Top |
Related drugs of malignant transformation related genes |
| Identification of chemicals and drugs interact with genes involved in malignant transfromation |
| (DGIdb 4.0) |
| Entrez ID | Symbol | Category | Interaction Types | Drug Claim Name | Drug Name | PMIDs |
| Page: 1 |

Copyright 2023-Present -The University of Texas Health Science Center at Houston |