
|
|||||
|
 | |
| |
| |
| |
| |
| |
|
Gene: HOXB13 |
Gene summary for HOXB13 |
| Gene information | Species | Human | Gene symbol | HOXB13 | Gene ID | 10481 |
| Gene name | homeobox B13 | |
| Gene Alias | HPC9 | |
| Cytomap | 17q21.32 | |
| Gene Type | protein-coding | GO ID | GO:0000003 | UniProtAcc | Q4KR72 |
Top |
Malignant transformation analysis |
| Identification of the aberrant gene expression in precancerous and cancerous lesions by comparing the gene expression of stem-like cells in diseased tissues with normal stem cells |
| Entrez ID | Symbol | Replicates | Species | Organ | Tissue | Adj P-value | Log2FC | Malignancy |
| 10481 | HOXB13 | HTA11_347_2000001011 | Human | Colorectum | AD | 9.82e-23 | 4.73e-01 | -0.1954 |
| 10481 | HOXB13 | HTA11_411_2000001011 | Human | Colorectum | SER | 2.69e-12 | 8.90e-01 | -0.2602 |
| 10481 | HOXB13 | HTA11_2112_2000001011 | Human | Colorectum | SER | 1.21e-12 | 8.63e-01 | -0.2196 |
| 10481 | HOXB13 | HTA11_696_2000001011 | Human | Colorectum | AD | 2.35e-26 | 5.62e-01 | -0.1464 |
| 10481 | HOXB13 | HTA11_2992_2000001011 | Human | Colorectum | SER | 3.94e-17 | 9.47e-01 | -0.1706 |
| 10481 | HOXB13 | HTA11_5212_2000001011 | Human | Colorectum | AD | 1.19e-14 | 7.54e-01 | -0.2061 |
| 10481 | HOXB13 | HTA11_7862_2000001011 | Human | Colorectum | AD | 5.10e-10 | 3.50e-01 | -0.0179 |
| 10481 | HOXB13 | HTA11_866_3004761011 | Human | Colorectum | AD | 3.62e-06 | 1.04e-01 | 0.096 |
| 10481 | HOXB13 | HTA11_99999965104_69814 | Human | Colorectum | MSS | 2.43e-03 | 1.19e-01 | 0.281 |
| 10481 | HOXB13 | Dong_P1 | Human | Prostate | Tumor | 2.54e-25 | 2.56e-01 | 0.035 |
| 10481 | HOXB13 | Dong_P3 | Human | Prostate | Tumor | 7.11e-25 | 3.21e-01 | 0.0278 |
| 10481 | HOXB13 | Dong_P4 | Human | Prostate | Tumor | 8.61e-10 | 3.56e-01 | 0.0292 |
| 10481 | HOXB13 | GSM5353215_PA_AUG_PB_1B_S2 | Human | Prostate | Tumor | 3.05e-02 | 5.11e-01 | 0.1557 |
| 10481 | HOXB13 | GSM5353221_PA_PB2A_Pool_1_3_S25_L001 | Human | Prostate | Tumor | 6.25e-13 | 6.85e-01 | 0.1633 |
| 10481 | HOXB13 | GSM5353222_PA_PB2B_Pool_1_3_S52_L002 | Human | Prostate | Tumor | 5.09e-11 | 5.78e-01 | 0.1608 |
| 10481 | HOXB13 | GSM5353223_PA_PB2B_Pool_2_S26_L001 | Human | Prostate | Tumor | 1.90e-08 | 5.96e-01 | 0.1604 |
| 10481 | HOXB13 | GSM5353224_PA_PR5186_Pool_1_2_3_S27_L001 | Human | Prostate | Tumor | 2.26e-02 | 3.90e-01 | 0.1621 |
| 10481 | HOXB13 | GSM5353232_PA_PR5249_T1_S3_L001 | Human | Prostate | Tumor | 1.55e-02 | 6.01e-01 | 0.1439 |
| 10481 | HOXB13 | GSM5353236_PA_PR5251_T1_S7_L001 | Human | Prostate | Tumor | 6.22e-08 | 7.57e-01 | 0.1608 |
| 10481 | HOXB13 | GSM5353237_PA_PR5251_T2_S8_L001 | Human | Prostate | Tumor | 3.66e-02 | 5.83e-01 | 0.1622 |
| Page: 1 2 |
| Tissue | Expression Dynamics | Abbreviation |
| Colorectum (GSE201348) |  | FAP: Familial adenomatous polyposis |
| CRC: Colorectal cancer | ||
| Colorectum (HTA11) | 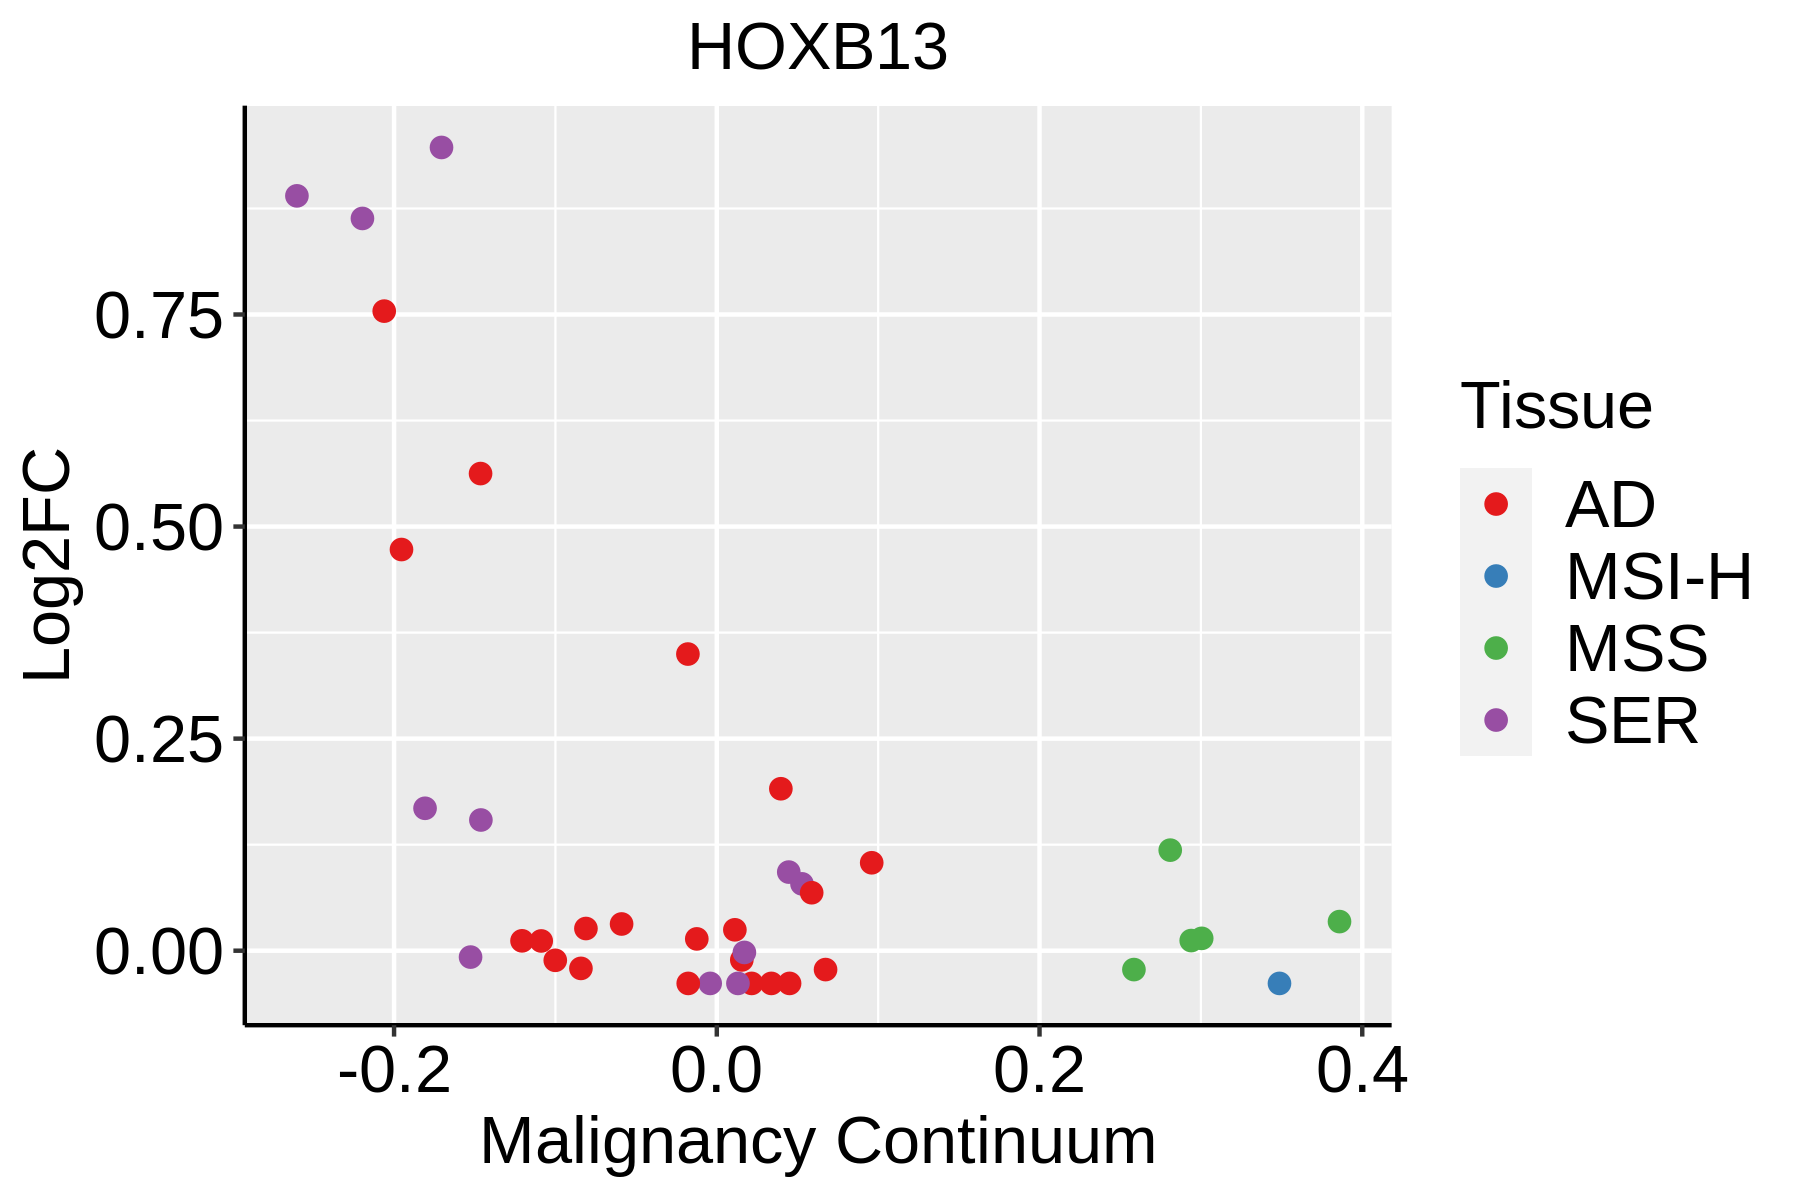 | AD: Adenomas |
| SER: Sessile serrated lesions | ||
| MSI-H: Microsatellite-high colorectal cancer | ||
| MSS: Microsatellite stable colorectal cancer | ||
| Prostate |  | BPH: Benign Prostatic Hyperplasia |
| ∗log2FC in expression of this searched gene in stem-like cells from each diseased tissue sample relative to stem-like cells in normal samples in each tissue plotted against the malignancy continuum. Samples are colored based on if they are from different disease stage. |
Top |
Malignant transformation related pathway analysis |
| Find out the enriched GO biological processes and KEGG pathways involved in transition from healthy to precancer to cancer |
| Tissue | Disease Stage | Enriched GO biological Processes |
| Colorectum | AD |  |
| Colorectum | SER |  |
| Colorectum | MSS |  |
| Colorectum | MSI-H |  |
| Colorectum | FAP |  |
| ∗Top 15 enriched GO BP terms are showed in the bar plot of each disease state in each tissue. Each row represents a significant GO biological process which is colored according to the -log10(p.adjust). |
| Page: 1 2 3 4 5 6 7 8 9 |
| GO ID | Tissue | Disease Stage | Description | Gene Ratio | Bg Ratio | pvalue | p.adjust | Count |
| GO:0002064 | Colorectum | AD | epithelial cell development | 89/3918 | 220/18723 | 2.98e-11 | 3.52e-09 | 89 |
| GO:0048732 | Colorectum | AD | gland development | 149/3918 | 436/18723 | 6.07e-11 | 6.33e-09 | 149 |
| GO:0022612 | Colorectum | AD | gland morphogenesis | 42/3918 | 118/18723 | 1.62e-04 | 2.23e-03 | 42 |
| GO:0061458 | Colorectum | AD | reproductive system development | 116/3918 | 427/18723 | 1.11e-03 | 1.01e-02 | 116 |
| GO:1901654 | Colorectum | AD | response to ketone | 59/3918 | 194/18723 | 1.14e-03 | 1.04e-02 | 59 |
| GO:0048608 | Colorectum | AD | reproductive structure development | 114/3918 | 424/18723 | 1.78e-03 | 1.47e-02 | 114 |
| GO:0008544 | Colorectum | AD | epidermis development | 87/3918 | 324/18723 | 5.99e-03 | 3.76e-02 | 87 |
| GO:0001763 | Colorectum | AD | morphogenesis of a branching structure | 56/3918 | 196/18723 | 6.60e-03 | 4.09e-02 | 56 |
| GO:00487321 | Colorectum | SER | gland development | 112/2897 | 436/18723 | 1.75e-08 | 1.28e-06 | 112 |
| GO:00020641 | Colorectum | SER | epithelial cell development | 64/2897 | 220/18723 | 1.96e-07 | 1.10e-05 | 64 |
| GO:00614581 | Colorectum | SER | reproductive system development | 87/2897 | 427/18723 | 3.69e-03 | 3.07e-02 | 87 |
| GO:19016541 | Colorectum | SER | response to ketone | 44/2897 | 194/18723 | 5.01e-03 | 3.88e-02 | 44 |
| GO:00486081 | Colorectum | SER | reproductive structure development | 85/2897 | 424/18723 | 6.33e-03 | 4.56e-02 | 85 |
| GO:00226121 | Colorectum | SER | gland morphogenesis | 29/2897 | 118/18723 | 6.54e-03 | 4.68e-02 | 29 |
| GO:00487322 | Colorectum | MSS | gland development | 143/3467 | 436/18723 | 3.85e-13 | 8.01e-11 | 143 |
| GO:00020642 | Colorectum | MSS | epithelial cell development | 81/3467 | 220/18723 | 1.02e-10 | 1.06e-08 | 81 |
| GO:00614582 | Colorectum | MSS | reproductive system development | 115/3467 | 427/18723 | 9.86e-06 | 2.39e-04 | 115 |
| GO:00486082 | Colorectum | MSS | reproductive structure development | 113/3467 | 424/18723 | 1.94e-05 | 4.18e-04 | 113 |
| GO:00226122 | Colorectum | MSS | gland morphogenesis | 41/3467 | 118/18723 | 2.02e-05 | 4.30e-04 | 41 |
| GO:19016542 | Colorectum | MSS | response to ketone | 58/3467 | 194/18723 | 7.70e-05 | 1.28e-03 | 58 |
| Page: 1 2 |
| Pathway ID | Tissue | Disease Stage | Description | Gene Ratio | Bg Ratio | pvalue | p.adjust | qvalue | Count |
| Page: 1 |
Top |
Cell-cell communication analysis |
| Identification of potential cell-cell interactions between two cell types and their ligand-receptor pairs for different disease states |
| Ligand | Receptor | LRpair | Pathway | Tissue | Disease Stage |
| Page: 1 |
Top |
Single-cell gene regulatory network inference analysis |
| Find out the significant the regulons (TFs) and the target genes of each regulon across cell types for different disease states |
| TF | Cell Type | Tissue | Disease Stage | Target Gene | RSS | Regulon Activity |
| HOXB13 | pDC | Prostate | ADJ | NKX3-1,SPDEF,NIPAL3, etc. | 3.54e-01 |  |
| HOXB13 | PLA | Prostate | ADJ | NKX3-1,SPDEF,NIPAL3, etc. | 9.29e-03 | |
| HOXB13 | pDC | Prostate | Tumor | NKX3-1,SPDEF,NIPAL3, etc. | 2.46e-01 |  |
| HOXB13 | FIB | Prostate | Tumor | SPON2,ZG16B,TSTD1, etc. | 5.20e-01 | |
| ∗The dot plots of a searched regulon are shown for all cell subpopulations in each disease state of each tissue based on the regulon specific score inferred using pySCENIC and by calculating the average expression. |
| Page: 1 |
Top |
Somatic mutation of malignant transformation related genes |
| Annotation of somatic variants for genes involved in malignant transformation |
| Hugo Symbol | Variant Class | Variant Classification | dbSNP RS | HGVSc | HGVSp | HGVSp Short | SWISSPROT | BIOTYPE | SIFT | PolyPhen | Tumor Sample Barcode | Tissue | Histology | Sex | Age | Stage | Therapy Types | Drugs | Outcome |
| HOXB13 | SNV | Missense_Mutation | c.665C>T | p.Pro222Leu | p.P222L | Q92826 | protein_coding | deleterious(0) | probably_damaging(0.999) | TCGA-C8-A3M7-01 | Breast | breast invasive carcinoma | Female | <65 | III/IV | Unknown | Unknown | PD | |
| HOXB13 | SNV | Missense_Mutation | novel | c.565N>G | p.Asn189Asp | p.N189D | Q92826 | protein_coding | tolerated(0.29) | benign(0.157) | TCGA-D8-A1XQ-01 | Breast | breast invasive carcinoma | Female | >=65 | I/II | Unknown | Unknown | SD |
| HOXB13 | insertion | Nonsense_Mutation | novel | c.659_660insAGGGGGACTTCATGGACCCTCGCCTGAGGCCTCTGTGACTTGAGT | p.Arg220_Ile221insGlyGlyLeuHisGlyProSerProGluAlaSerValThrTerVal | p.R220_I221insGGLHGPSPEASVT*V | Q92826 | protein_coding | TCGA-A8-A08H-01 | Breast | breast invasive carcinoma | Female | >=65 | I/II | Unknown | Unknown | SD | ||
| HOXB13 | SNV | Missense_Mutation | novel | c.7N>T | p.Pro3Ser | p.P3S | Q92826 | protein_coding | tolerated_low_confidence(0.09) | benign(0.001) | TCGA-C5-A8XJ-01 | Cervix | cervical & endocervical cancer | Female | >=65 | I/II | Chemotherapy | cisplatin | SD |
| HOXB13 | SNV | Missense_Mutation | novel | c.802C>T | p.Arg268Trp | p.R268W | Q92826 | protein_coding | deleterious(0) | probably_damaging(1) | TCGA-AA-3947-01 | Colorectum | colon adenocarcinoma | Female | <65 | I/II | Unknown | Unknown | SD |
| HOXB13 | SNV | Missense_Mutation | c.85N>A | p.Ala29Thr | p.A29T | Q92826 | protein_coding | tolerated(0.06) | benign(0.005) | TCGA-G4-6628-01 | Colorectum | colon adenocarcinoma | Male | >=65 | I/II | Unknown | Unknown | SD | |
| HOXB13 | SNV | Missense_Mutation | c.605N>T | p.Ser202Phe | p.S202F | Q92826 | protein_coding | deleterious(0.05) | benign(0.084) | TCGA-AG-3592-01 | Colorectum | rectum adenocarcinoma | Male | >=65 | I/II | Unknown | Unknown | SD | |
| HOXB13 | SNV | Missense_Mutation | c.34N>A | p.Ala12Thr | p.A12T | Q92826 | protein_coding | tolerated(0.35) | benign(0) | TCGA-EI-6881-01 | Colorectum | rectum adenocarcinoma | Male | <65 | III/IV | Chemotherapy | 5 | SD | |
| HOXB13 | SNV | Missense_Mutation | novel | c.407N>A | p.Thr136Asn | p.T136N | Q92826 | protein_coding | deleterious(0) | benign(0) | TCGA-A5-A0G2-01 | Endometrium | uterine corpus endometrioid carcinoma | Female | <65 | III/IV | Unknown | Unknown | SD |
| HOXB13 | SNV | Missense_Mutation | c.761G>A | p.Ser254Asn | p.S254N | Q92826 | protein_coding | tolerated(1) | benign(0.014) | TCGA-A5-A0VQ-01 | Endometrium | uterine corpus endometrioid carcinoma | Female | <65 | I/II | Chemotherapy | carboplatin | SD |
| Page: 1 2 3 4 5 |
Top |
Related drugs of malignant transformation related genes |
| Identification of chemicals and drugs interact with genes involved in malignant transfromation |
| (DGIdb 4.0) |
| Entrez ID | Symbol | Category | Interaction Types | Drug Claim Name | Drug Name | PMIDs |
| Page: 1 |

Copyright 2023-Present -The University of Texas Health Science Center at Houston |