
|
|||||
|
 | |
| |
| |
| |
| |
| |
|
Gene: HOXA9 |
Gene summary for HOXA9 |
| Gene information | Species | Human | Gene symbol | HOXA9 | Gene ID | 3205 |
| Gene name | homeobox A9 | |
| Gene Alias | ABD-B | |
| Cytomap | 7p15.2 | |
| Gene Type | protein-coding | GO ID | GO:0000003 | UniProtAcc | P31269 |
Top |
Malignant transformation analysis |
| Identification of the aberrant gene expression in precancerous and cancerous lesions by comparing the gene expression of stem-like cells in diseased tissues with normal stem cells |
| Entrez ID | Symbol | Replicates | Species | Organ | Tissue | Adj P-value | Log2FC | Malignancy |
| 3205 | HOXA9 | HTA11_866_3004761011 | Human | Colorectum | AD | 3.16e-05 | 3.37e-01 | 0.096 |
| 3205 | HOXA9 | HTA11_99999970781_79442 | Human | Colorectum | MSS | 1.46e-06 | 4.37e-01 | 0.294 |
| 3205 | HOXA9 | HTA11_99999965104_69814 | Human | Colorectum | MSS | 1.90e-03 | 3.34e-01 | 0.281 |
| 3205 | HOXA9 | HTA11_99999971662_82457 | Human | Colorectum | MSS | 2.18e-08 | 5.02e-01 | 0.3859 |
| 3205 | HOXA9 | A002-C-205 | Human | Colorectum | FAP | 7.27e-03 | -1.52e-01 | -0.1236 |
| 3205 | HOXA9 | A015-C-006 | Human | Colorectum | FAP | 1.72e-02 | -1.67e-01 | -0.0994 |
| 3205 | HOXA9 | A002-C-116 | Human | Colorectum | FAP | 4.38e-06 | -1.30e-01 | -0.0452 |
| 3205 | HOXA9 | A014-C-008 | Human | Colorectum | FAP | 3.72e-02 | -1.67e-01 | -0.191 |
| 3205 | HOXA9 | CRC-3-11773 | Human | Colorectum | CRC | 9.36e-06 | -1.67e-01 | 0.2564 |
| 3205 | HOXA9 | LZE2T | Human | Esophagus | ESCC | 5.44e-10 | 6.91e-01 | 0.082 |
| 3205 | HOXA9 | LZE4T | Human | Esophagus | ESCC | 9.56e-12 | 3.22e-01 | 0.0811 |
| 3205 | HOXA9 | LZE5T | Human | Esophagus | ESCC | 1.57e-03 | 2.47e-01 | 0.0514 |
| 3205 | HOXA9 | LZE7T | Human | Esophagus | ESCC | 2.07e-09 | 3.30e-01 | 0.0667 |
| 3205 | HOXA9 | P2T-E | Human | Esophagus | ESCC | 1.51e-64 | 1.01e+00 | 0.1177 |
| 3205 | HOXA9 | P4T-E | Human | Esophagus | ESCC | 3.48e-37 | 8.54e-01 | 0.1323 |
| 3205 | HOXA9 | P5T-E | Human | Esophagus | ESCC | 2.39e-24 | 4.93e-01 | 0.1327 |
| 3205 | HOXA9 | P8T-E | Human | Esophagus | ESCC | 1.88e-04 | 1.31e-01 | 0.0889 |
| 3205 | HOXA9 | P9T-E | Human | Esophagus | ESCC | 5.45e-19 | 4.25e-01 | 0.1131 |
| 3205 | HOXA9 | P10T-E | Human | Esophagus | ESCC | 4.16e-22 | 3.89e-01 | 0.116 |
| 3205 | HOXA9 | P16T-E | Human | Esophagus | ESCC | 9.14e-50 | 8.93e-01 | 0.1153 |
| Page: 1 2 3 |
| Tissue | Expression Dynamics | Abbreviation |
| Colorectum (GSE201348) |  | FAP: Familial adenomatous polyposis |
| CRC: Colorectal cancer | ||
| Colorectum (HTA11) | 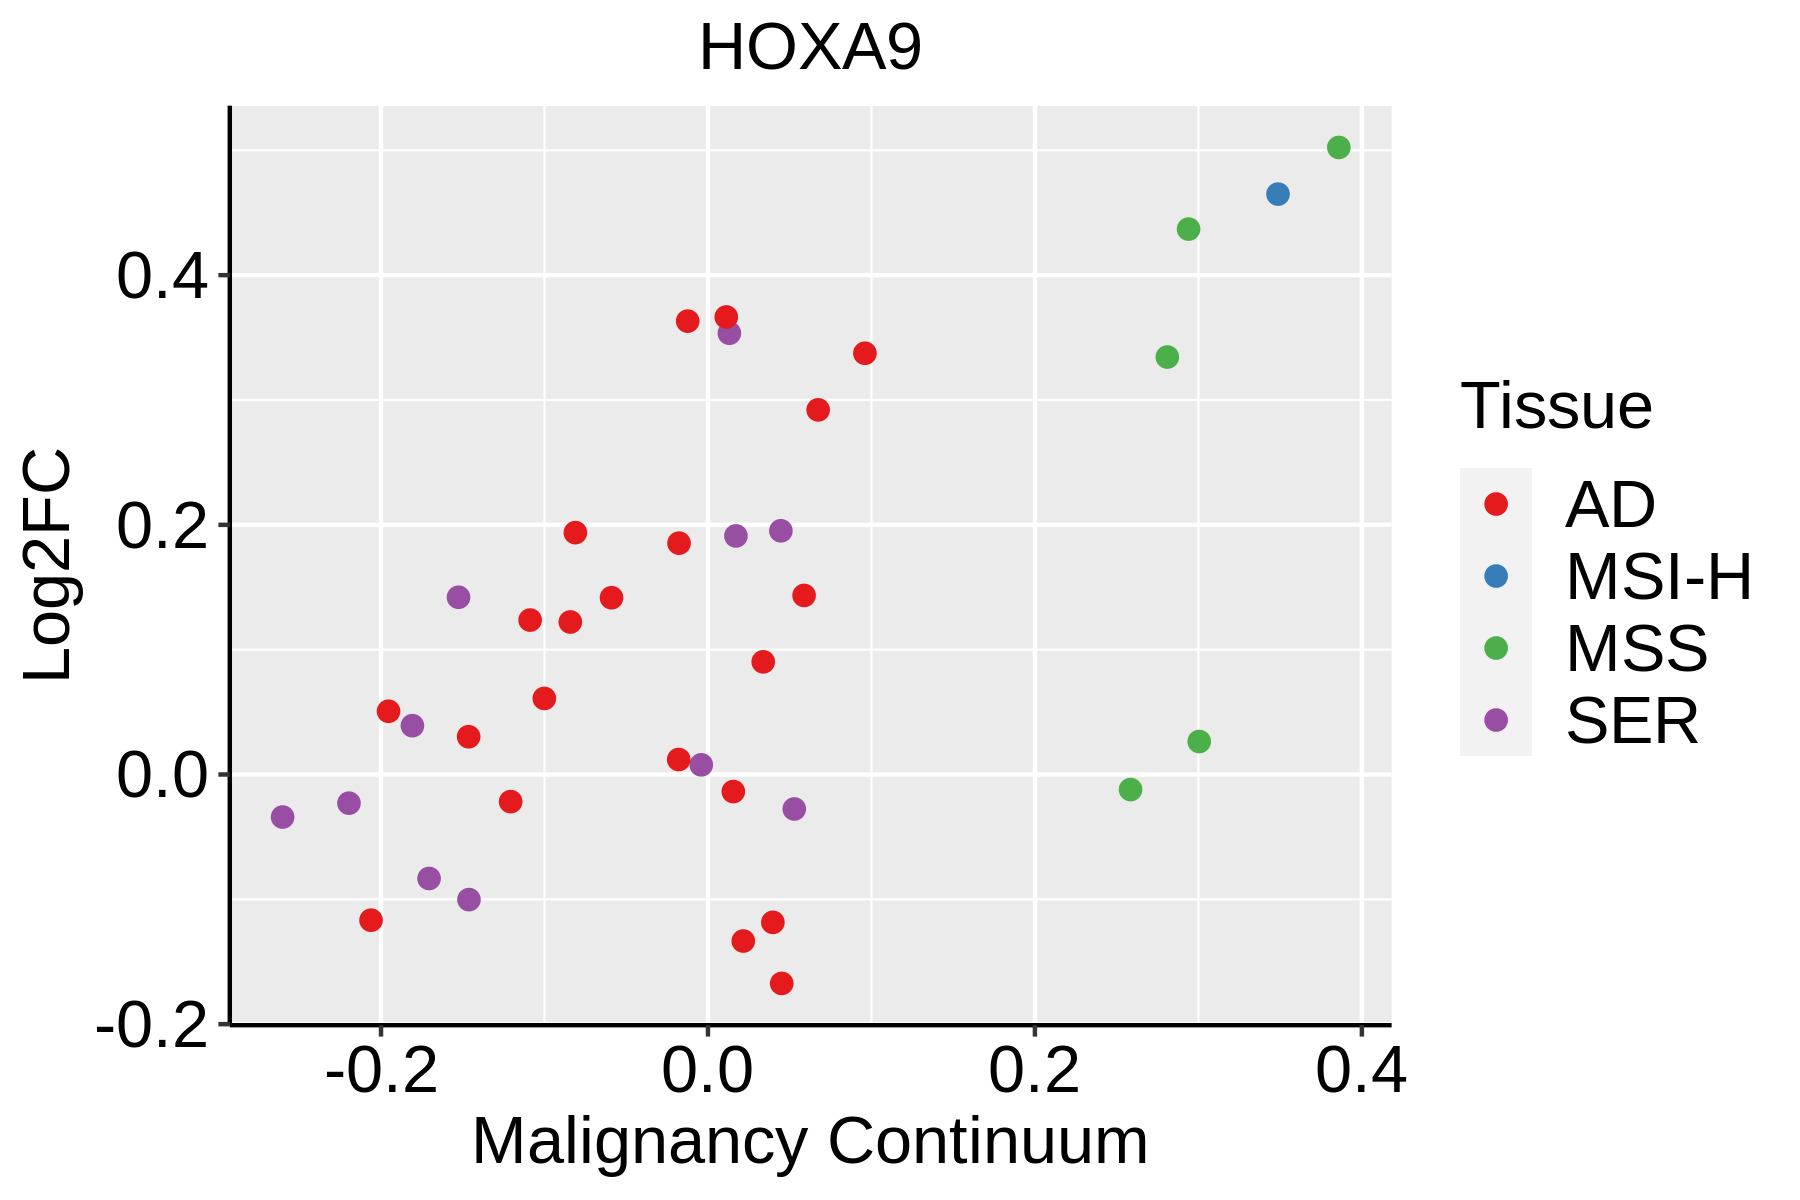 | AD: Adenomas |
| SER: Sessile serrated lesions | ||
| MSI-H: Microsatellite-high colorectal cancer | ||
| MSS: Microsatellite stable colorectal cancer | ||
| Esophagus | 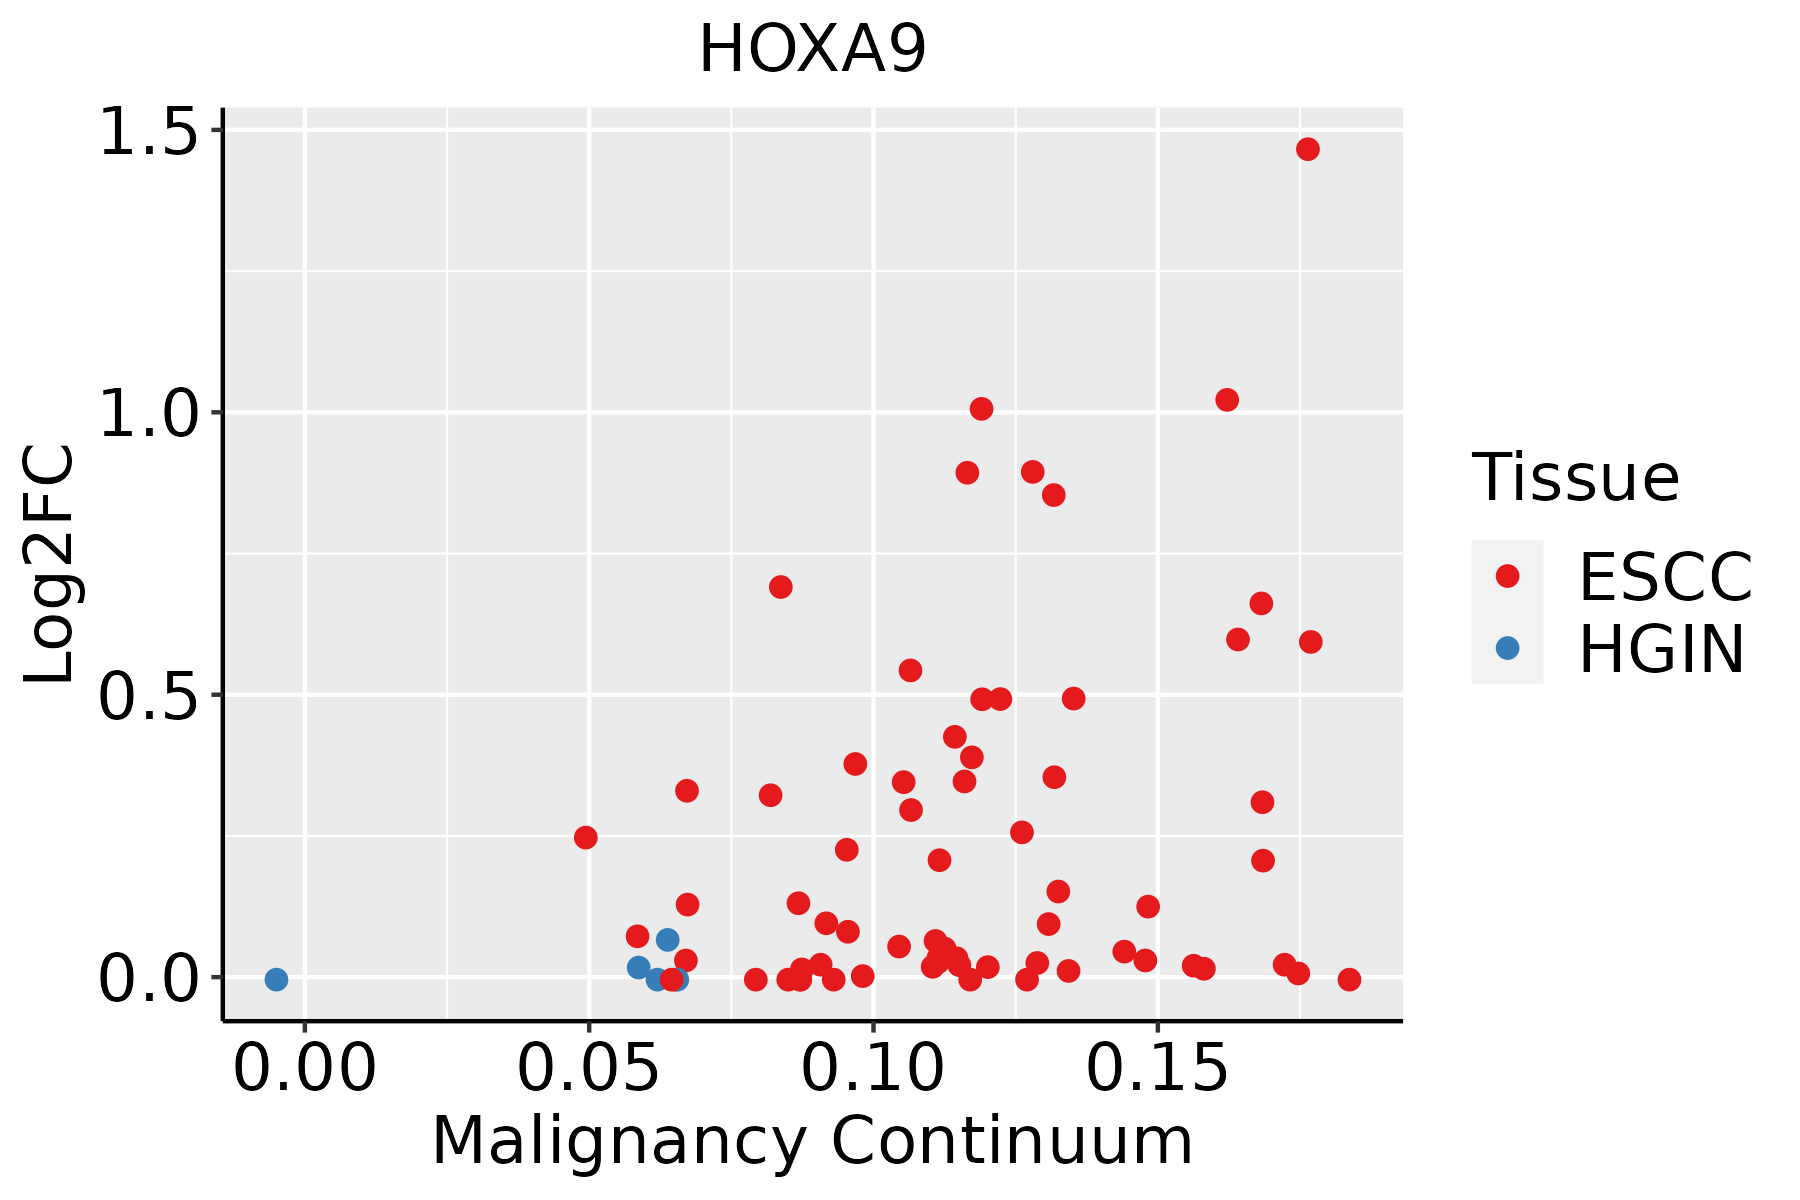 | ESCC: Esophageal squamous cell carcinoma |
| HGIN: High-grade intraepithelial neoplasias | ||
| LGIN: Low-grade intraepithelial neoplasias |
| ∗log2FC in expression of this searched gene in stem-like cells from each diseased tissue sample relative to stem-like cells in normal samples in each tissue plotted against the malignancy continuum. Samples are colored based on if they are from different disease stage. |
Top |
Malignant transformation related pathway analysis |
| Find out the enriched GO biological processes and KEGG pathways involved in transition from healthy to precancer to cancer |
| Tissue | Disease Stage | Enriched GO biological Processes |
| Colorectum | AD |  |
| Colorectum | SER |  |
| Colorectum | MSS |  |
| Colorectum | MSI-H |  |
| Colorectum | FAP |  |
| ∗Top 15 enriched GO BP terms are showed in the bar plot of each disease state in each tissue. Each row represents a significant GO biological process which is colored according to the -log10(p.adjust). |
| Page: 1 2 3 4 5 6 7 8 9 |
| GO ID | Tissue | Disease Stage | Description | Gene Ratio | Bg Ratio | pvalue | p.adjust | Count |
| GO:0048732 | Colorectum | AD | gland development | 149/3918 | 436/18723 | 6.07e-11 | 6.33e-09 | 149 |
| GO:0030099 | Colorectum | AD | myeloid cell differentiation | 119/3918 | 381/18723 | 1.24e-06 | 4.01e-05 | 119 |
| GO:0030879 | Colorectum | AD | mammary gland development | 53/3918 | 137/18723 | 1.46e-06 | 4.58e-05 | 53 |
| GO:0061458 | Colorectum | AD | reproductive system development | 116/3918 | 427/18723 | 1.11e-03 | 1.01e-02 | 116 |
| GO:0048608 | Colorectum | AD | reproductive structure development | 114/3918 | 424/18723 | 1.78e-03 | 1.47e-02 | 114 |
| GO:1903706 | Colorectum | AD | regulation of hemopoiesis | 99/3918 | 367/18723 | 3.08e-03 | 2.28e-02 | 99 |
| GO:0045637 | Colorectum | AD | regulation of myeloid cell differentiation | 61/3918 | 210/18723 | 3.17e-03 | 2.35e-02 | 61 |
| GO:0048736 | Colorectum | AD | appendage development | 51/3918 | 172/18723 | 4.20e-03 | 2.89e-02 | 51 |
| GO:0060173 | Colorectum | AD | limb development | 51/3918 | 172/18723 | 4.20e-03 | 2.89e-02 | 51 |
| GO:0048568 | Colorectum | AD | embryonic organ development | 112/3918 | 427/18723 | 4.60e-03 | 3.14e-02 | 112 |
| GO:00487322 | Colorectum | MSS | gland development | 143/3467 | 436/18723 | 3.85e-13 | 8.01e-11 | 143 |
| GO:00308792 | Colorectum | MSS | mammary gland development | 51/3467 | 137/18723 | 1.88e-07 | 8.26e-06 | 51 |
| GO:00300992 | Colorectum | MSS | myeloid cell differentiation | 110/3467 | 381/18723 | 4.48e-07 | 1.75e-05 | 110 |
| GO:00614582 | Colorectum | MSS | reproductive system development | 115/3467 | 427/18723 | 9.86e-06 | 2.39e-04 | 115 |
| GO:00486082 | Colorectum | MSS | reproductive structure development | 113/3467 | 424/18723 | 1.94e-05 | 4.18e-04 | 113 |
| GO:00487362 | Colorectum | MSS | appendage development | 48/3467 | 172/18723 | 1.61e-03 | 1.46e-02 | 48 |
| GO:00601732 | Colorectum | MSS | limb development | 48/3467 | 172/18723 | 1.61e-03 | 1.46e-02 | 48 |
| GO:19037061 | Colorectum | MSS | regulation of hemopoiesis | 89/3467 | 367/18723 | 3.39e-03 | 2.56e-02 | 89 |
| GO:00456371 | Colorectum | MSS | regulation of myeloid cell differentiation | 54/3467 | 210/18723 | 5.85e-03 | 3.96e-02 | 54 |
| GO:00485681 | Colorectum | MSS | embryonic organ development | 100/3467 | 427/18723 | 6.00e-03 | 4.03e-02 | 100 |
| Page: 1 2 3 |
| Pathway ID | Tissue | Disease Stage | Description | Gene Ratio | Bg Ratio | pvalue | p.adjust | qvalue | Count |
| hsa05202 | Colorectum | FAP | Transcriptional misregulation in cancer | 45/1404 | 193/8465 | 9.19e-03 | 3.33e-02 | 2.03e-02 | 45 |
| hsa052021 | Colorectum | FAP | Transcriptional misregulation in cancer | 45/1404 | 193/8465 | 9.19e-03 | 3.33e-02 | 2.03e-02 | 45 |
| hsa052028 | Esophagus | ESCC | Transcriptional misregulation in cancer | 116/4205 | 193/8465 | 2.08e-03 | 5.95e-03 | 3.05e-03 | 116 |
| hsa0520213 | Esophagus | ESCC | Transcriptional misregulation in cancer | 116/4205 | 193/8465 | 2.08e-03 | 5.95e-03 | 3.05e-03 | 116 |
| Page: 1 |
Top |
Cell-cell communication analysis |
| Identification of potential cell-cell interactions between two cell types and their ligand-receptor pairs for different disease states |
| Ligand | Receptor | LRpair | Pathway | Tissue | Disease Stage |
| Page: 1 |
Top |
Single-cell gene regulatory network inference analysis |
| Find out the significant the regulons (TFs) and the target genes of each regulon across cell types for different disease states |
| TF | Cell Type | Tissue | Disease Stage | Target Gene | RSS | Regulon Activity |
| HOXA9 | LUM | Endometrium | Healthy | PGRMC1,HOXA11,CHST7, etc. | 3.94e-01 |  |
| HOXA9 | BAS | Endometrium | Healthy | PGRMC1,HOXA11,CHST7, etc. | 2.83e-01 | |
| ∗The dot plots of a searched regulon are shown for all cell subpopulations in each disease state of each tissue based on the regulon specific score inferred using pySCENIC and by calculating the average expression. |
| Page: 1 |
Top |
Somatic mutation of malignant transformation related genes |
| Annotation of somatic variants for genes involved in malignant transformation |
| Hugo Symbol | Variant Class | Variant Classification | dbSNP RS | HGVSc | HGVSp | HGVSp Short | SWISSPROT | BIOTYPE | SIFT | PolyPhen | Tumor Sample Barcode | Tissue | Histology | Sex | Age | Stage | Therapy Types | Drugs | Outcome |
| HOXA9 | SNV | Missense_Mutation | novel | c.520G>A | p.Ala174Thr | p.A174T | P31269 | protein_coding | tolerated(0.29) | benign(0.066) | TCGA-AN-A046-01 | Breast | breast invasive carcinoma | Female | >=65 | I/II | Unknown | Unknown | SD |
| HOXA9 | SNV | Missense_Mutation | c.770G>A | p.Arg257His | p.R257H | P31269 | protein_coding | deleterious(0) | probably_damaging(1) | TCGA-2W-A8YY-01 | Cervix | cervical & endocervical cancer | Female | <65 | I/II | Chemotherapy | cisplatin | CR | |
| HOXA9 | SNV | Missense_Mutation | rs267601472 | c.620G>A | p.Arg207Gln | p.R207Q | P31269 | protein_coding | deleterious(0) | probably_damaging(1) | TCGA-2W-A8YY-01 | Cervix | cervical & endocervical cancer | Female | <65 | I/II | Chemotherapy | cisplatin | CR |
| HOXA9 | SNV | Missense_Mutation | c.792N>G | p.Ile264Met | p.I264M | P31269 | protein_coding | tolerated(1) | benign(0.01) | TCGA-VS-A9UQ-01 | Cervix | cervical & endocervical cancer | Female | <65 | I/II | Unknown | Unknown | PD | |
| HOXA9 | SNV | Missense_Mutation | c.326G>A | p.Arg109His | p.R109H | P31269 | protein_coding | deleterious(0.02) | possibly_damaging(0.866) | TCGA-A6-2681-01 | Colorectum | colon adenocarcinoma | Female | >=65 | I/II | Unknown | Unknown | PD | |
| HOXA9 | SNV | Missense_Mutation | rs369971422 | c.500A>G | p.Glu167Gly | p.E167G | P31269 | protein_coding | tolerated(0.24) | benign(0.007) | TCGA-AD-6889-01 | Colorectum | colon adenocarcinoma | Male | >=65 | I/II | Chemotherapy | xeloda | PD |
| HOXA9 | SNV | Missense_Mutation | novel | c.628C>T | p.Arg210Trp | p.R210W | P31269 | protein_coding | deleterious(0) | probably_damaging(1) | TCGA-A5-A0G2-01 | Endometrium | uterine corpus endometrioid carcinoma | Female | <65 | III/IV | Unknown | Unknown | SD |
| HOXA9 | SNV | Missense_Mutation | c.770N>T | p.Arg257Leu | p.R257L | P31269 | protein_coding | deleterious(0) | probably_damaging(1) | TCGA-AP-A0LM-01 | Endometrium | uterine corpus endometrioid carcinoma | Female | <65 | III/IV | Chemotherapy | cisplatin | SD | |
| HOXA9 | SNV | Missense_Mutation | c.608C>T | p.Ala203Val | p.A203V | P31269 | protein_coding | deleterious(0) | probably_damaging(0.995) | TCGA-AX-A0J0-01 | Endometrium | uterine corpus endometrioid carcinoma | Female | <65 | I/II | Unknown | Unknown | SD | |
| HOXA9 | SNV | Missense_Mutation | c.688N>C | p.Tyr230His | p.Y230H | P31269 | protein_coding | deleterious(0) | probably_damaging(1) | TCGA-BG-A0LX-01 | Endometrium | uterine corpus endometrioid carcinoma | Female | <65 | I/II | Unknown | Unknown | SD |
| Page: 1 2 3 4 |
Top |
Related drugs of malignant transformation related genes |
| Identification of chemicals and drugs interact with genes involved in malignant transfromation |
| (DGIdb 4.0) |
| Entrez ID | Symbol | Category | Interaction Types | Drug Claim Name | Drug Name | PMIDs |
| 3205 | HOXA9 | TRANSCRIPTION FACTOR, CLINICALLY ACTIONABLE | G-CSF | FILGRASTIM | 11687616 |
| Page: 1 |

Copyright 2023-Present -The University of Texas Health Science Center at Houston |