
|
|||||
|
 | |
| |
| |
| |
| |
| |
|
Gene: HOXA7 |
Gene summary for HOXA7 |
| Gene information | Species | Human | Gene symbol | HOXA7 | Gene ID | 3204 |
| Gene name | homeobox A7 | |
| Gene Alias | ANTP | |
| Cytomap | 7p15.2 | |
| Gene Type | protein-coding | GO ID | GO:0000122 | UniProtAcc | P31268 |
Top |
Malignant transformation analysis |
| Identification of the aberrant gene expression in precancerous and cancerous lesions by comparing the gene expression of stem-like cells in diseased tissues with normal stem cells |
| Entrez ID | Symbol | Replicates | Species | Organ | Tissue | Adj P-value | Log2FC | Malignancy |
| 3204 | HOXA7 | LZE2T | Human | Esophagus | ESCC | 4.68e-07 | 6.34e-01 | 0.082 |
| 3204 | HOXA7 | LZE4T | Human | Esophagus | ESCC | 3.20e-12 | 3.97e-01 | 0.0811 |
| 3204 | HOXA7 | LZE7T | Human | Esophagus | ESCC | 1.29e-05 | 4.28e-01 | 0.0667 |
| 3204 | HOXA7 | LZE8T | Human | Esophagus | ESCC | 1.26e-02 | 1.26e-01 | 0.067 |
| 3204 | HOXA7 | LZE20T | Human | Esophagus | ESCC | 3.04e-04 | 1.68e-01 | 0.0662 |
| 3204 | HOXA7 | LZE22T | Human | Esophagus | ESCC | 1.17e-04 | 4.22e-01 | 0.068 |
| 3204 | HOXA7 | LZE24T | Human | Esophagus | ESCC | 1.96e-16 | 3.73e-01 | 0.0596 |
| 3204 | HOXA7 | LZE21T | Human | Esophagus | ESCC | 6.00e-05 | 3.47e-01 | 0.0655 |
| 3204 | HOXA7 | LZE6T | Human | Esophagus | ESCC | 2.44e-05 | 2.93e-01 | 0.0845 |
| 3204 | HOXA7 | P1T-E | Human | Esophagus | ESCC | 5.07e-10 | 5.22e-01 | 0.0875 |
| 3204 | HOXA7 | P2T-E | Human | Esophagus | ESCC | 2.52e-31 | 4.59e-01 | 0.1177 |
| 3204 | HOXA7 | P4T-E | Human | Esophagus | ESCC | 1.07e-38 | 9.63e-01 | 0.1323 |
| 3204 | HOXA7 | P5T-E | Human | Esophagus | ESCC | 1.45e-09 | 1.66e-01 | 0.1327 |
| 3204 | HOXA7 | P8T-E | Human | Esophagus | ESCC | 3.44e-23 | 3.88e-01 | 0.0889 |
| 3204 | HOXA7 | P9T-E | Human | Esophagus | ESCC | 1.94e-22 | 5.59e-01 | 0.1131 |
| 3204 | HOXA7 | P10T-E | Human | Esophagus | ESCC | 7.38e-51 | 8.55e-01 | 0.116 |
| 3204 | HOXA7 | P12T-E | Human | Esophagus | ESCC | 2.84e-37 | 7.06e-01 | 0.1122 |
| 3204 | HOXA7 | P15T-E | Human | Esophagus | ESCC | 1.36e-21 | 4.85e-01 | 0.1149 |
| 3204 | HOXA7 | P16T-E | Human | Esophagus | ESCC | 4.14e-24 | 4.99e-01 | 0.1153 |
| 3204 | HOXA7 | P17T-E | Human | Esophagus | ESCC | 3.24e-04 | 1.88e-01 | 0.1278 |
| Page: 1 2 3 4 |
| Tissue | Expression Dynamics | Abbreviation |
| Esophagus | 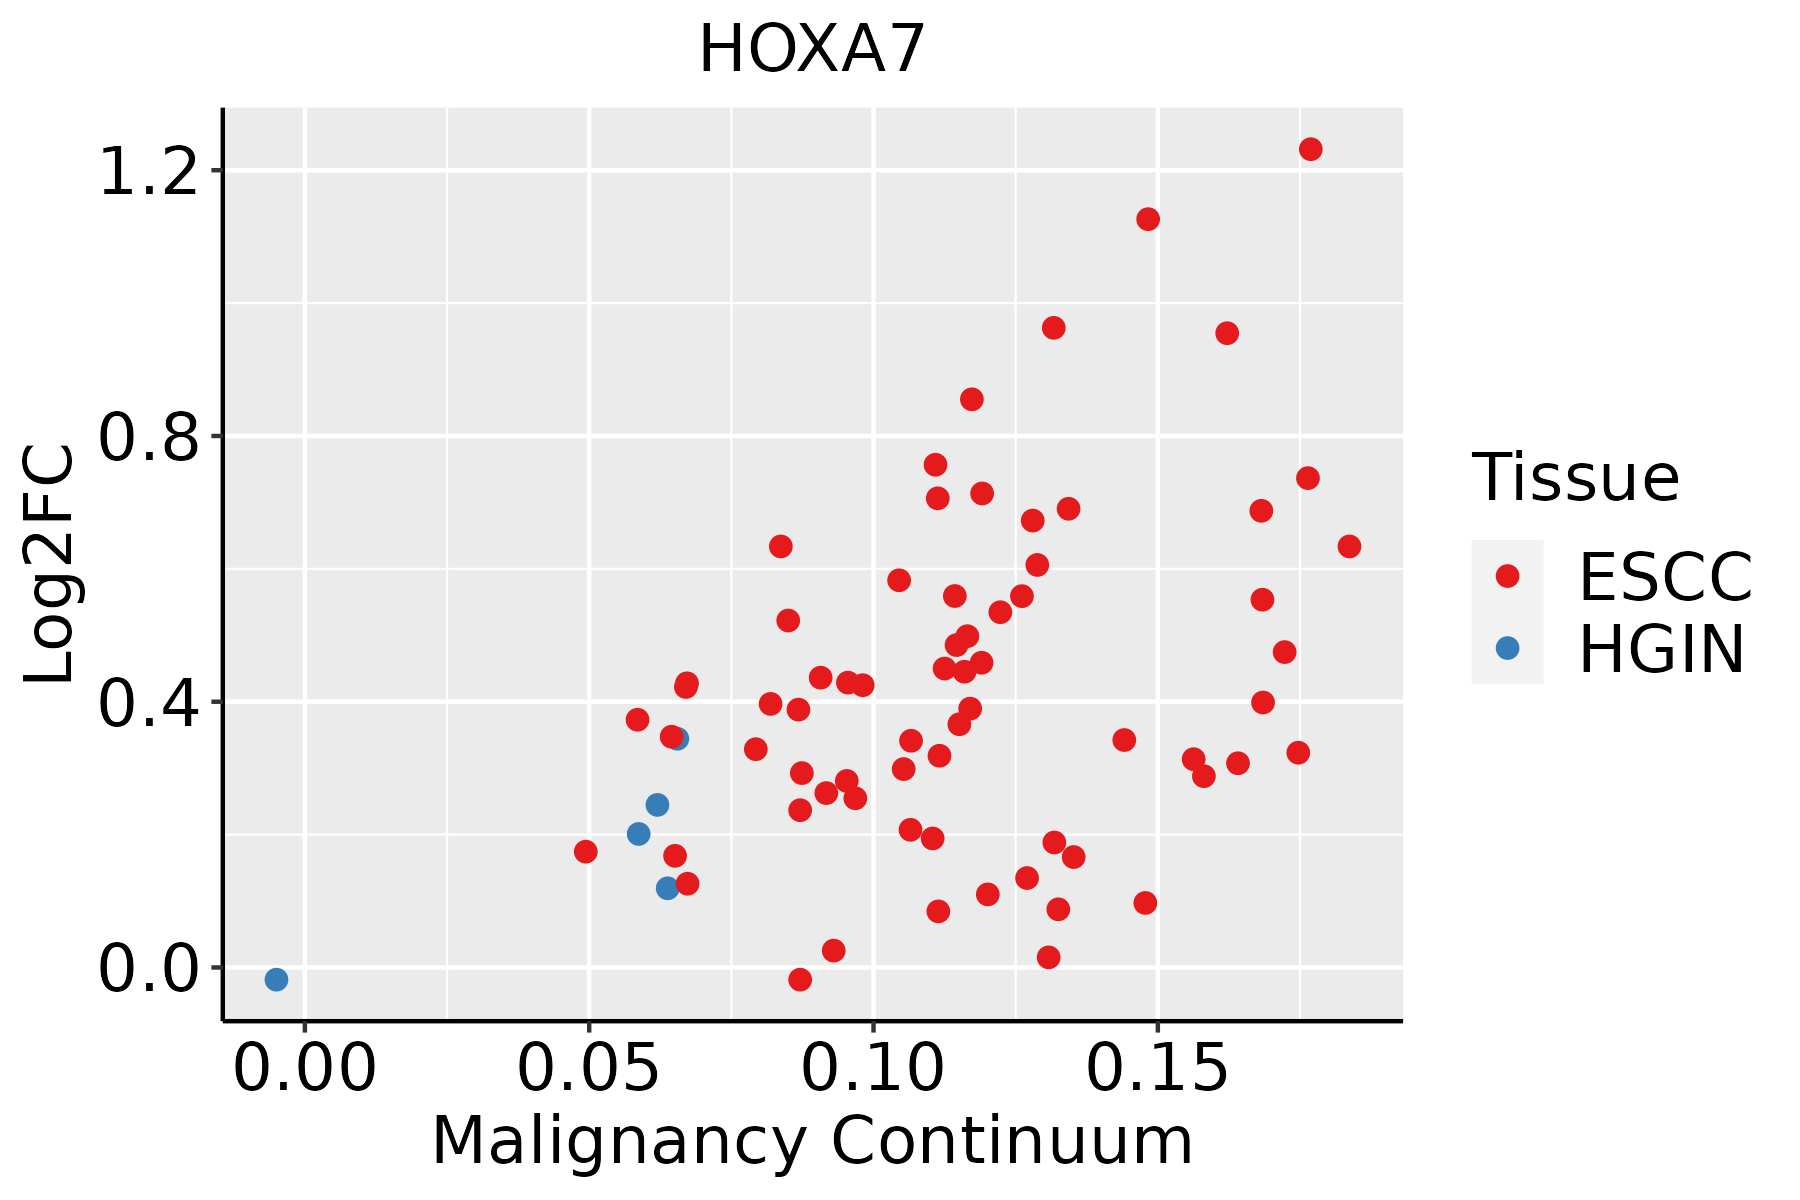 | ESCC: Esophageal squamous cell carcinoma |
| HGIN: High-grade intraepithelial neoplasias | ||
| LGIN: Low-grade intraepithelial neoplasias | ||
| Thyroid | 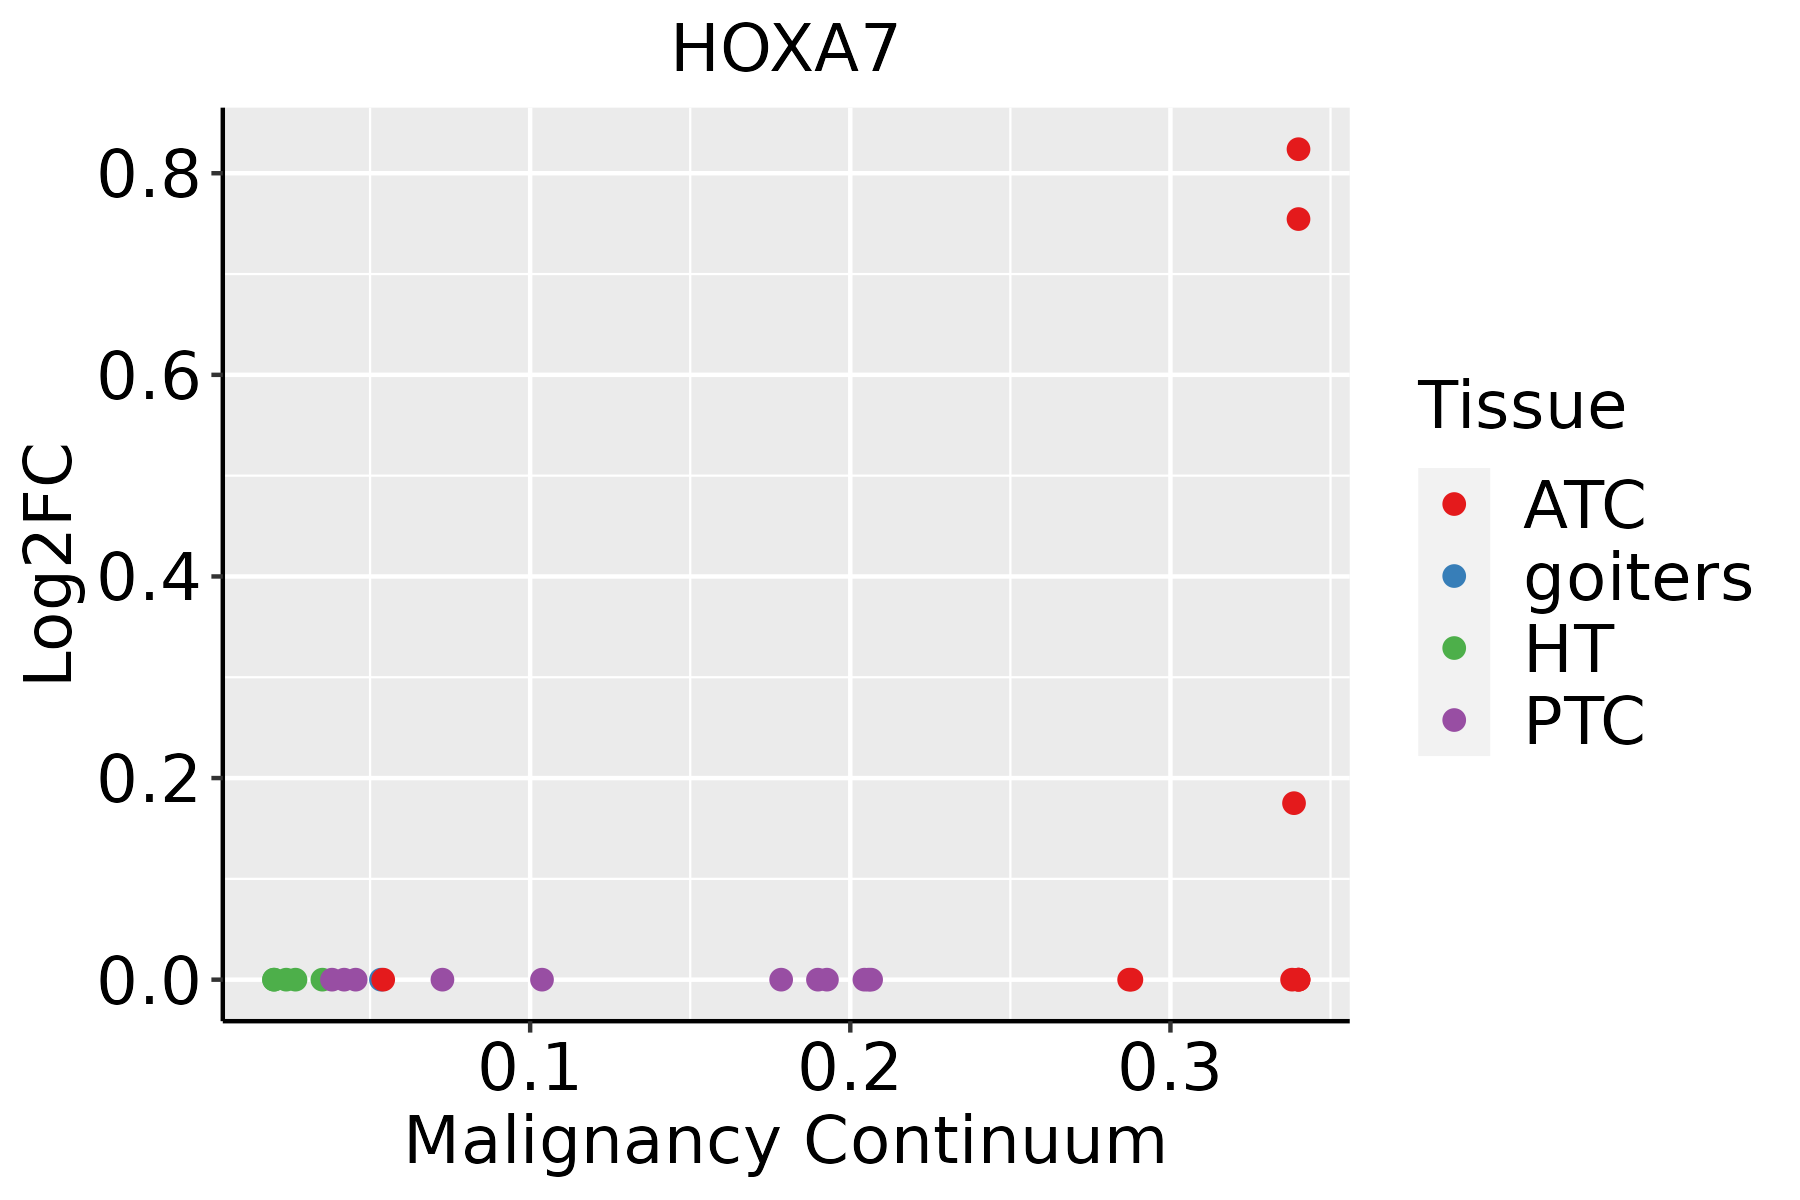 | ATC: Anaplastic thyroid cancer |
| HT: Hashimoto's thyroiditis | ||
| PTC: Papillary thyroid cancer |
| ∗log2FC in expression of this searched gene in stem-like cells from each diseased tissue sample relative to stem-like cells in normal samples in each tissue plotted against the malignancy continuum. Samples are colored based on if they are from different disease stage. |
Top |
Malignant transformation related pathway analysis |
| Find out the enriched GO biological processes and KEGG pathways involved in transition from healthy to precancer to cancer |
| Tissue | Disease Stage | Enriched GO biological Processes |
| Colorectum | AD |  |
| Colorectum | SER |  |
| Colorectum | MSS |  |
| Colorectum | MSI-H |  |
| Colorectum | FAP |  |
| ∗Top 15 enriched GO BP terms are showed in the bar plot of each disease state in each tissue. Each row represents a significant GO biological process which is colored according to the -log10(p.adjust). |
| Page: 1 2 3 4 5 6 7 8 9 |
| GO ID | Tissue | Disease Stage | Description | Gene Ratio | Bg Ratio | pvalue | p.adjust | Count |
| GO:0030099111 | Esophagus | ESCC | myeloid cell differentiation | 232/8552 | 381/18723 | 1.22e-09 | 2.90e-08 | 232 |
| GO:003158919 | Esophagus | ESCC | cell-substrate adhesion | 221/8552 | 363/18723 | 3.06e-09 | 6.62e-08 | 221 |
| GO:001081020 | Esophagus | ESCC | regulation of cell-substrate adhesion | 144/8552 | 221/18723 | 3.55e-09 | 7.45e-08 | 144 |
| GO:00435888 | Esophagus | ESCC | skin development | 163/8552 | 263/18723 | 6.48e-08 | 1.14e-06 | 163 |
| GO:000854410 | Esophagus | ESCC | epidermis development | 193/8552 | 324/18723 | 2.87e-07 | 4.19e-06 | 193 |
| GO:000195217 | Esophagus | ESCC | regulation of cell-matrix adhesion | 85/8552 | 128/18723 | 1.70e-06 | 2.02e-05 | 85 |
| GO:000257317 | Esophagus | ESCC | myeloid leukocyte differentiation | 128/8552 | 208/18723 | 2.75e-06 | 3.15e-05 | 128 |
| GO:000716018 | Esophagus | ESCC | cell-matrix adhesion | 141/8552 | 233/18723 | 3.33e-06 | 3.71e-05 | 141 |
| GO:000991310 | Esophagus | ESCC | epidermal cell differentiation | 122/8552 | 202/18723 | 1.69e-05 | 1.51e-04 | 122 |
| GO:00456826 | Esophagus | ESCC | regulation of epidermis development | 46/8552 | 65/18723 | 3.65e-05 | 2.97e-04 | 46 |
| GO:00488638 | Esophagus | ESCC | stem cell differentiation | 122/8552 | 206/18723 | 5.95e-05 | 4.59e-04 | 122 |
| GO:00302167 | Esophagus | ESCC | keratinocyte differentiation | 86/8552 | 139/18723 | 8.53e-05 | 6.19e-04 | 86 |
| GO:00456046 | Esophagus | ESCC | regulation of epidermal cell differentiation | 41/8552 | 58/18723 | 1.00e-04 | 7.10e-04 | 41 |
| GO:1903706110 | Esophagus | ESCC | regulation of hemopoiesis | 201/8552 | 367/18723 | 2.60e-04 | 1.58e-03 | 201 |
| GO:00485687 | Esophagus | ESCC | embryonic organ development | 228/8552 | 427/18723 | 7.28e-04 | 3.79e-03 | 228 |
| GO:000268316 | Esophagus | ESCC | negative regulation of immune system process | 231/8552 | 434/18723 | 8.48e-04 | 4.36e-03 | 231 |
| GO:19031317 | Esophagus | ESCC | mononuclear cell differentiation | 226/8552 | 426/18723 | 1.20e-03 | 5.88e-03 | 226 |
| GO:0045637111 | Esophagus | ESCC | regulation of myeloid cell differentiation | 118/8552 | 210/18723 | 1.35e-03 | 6.43e-03 | 118 |
| GO:190210510 | Esophagus | ESCC | regulation of leukocyte differentiation | 152/8552 | 279/18723 | 1.82e-03 | 8.35e-03 | 152 |
| GO:00456167 | Esophagus | ESCC | regulation of keratinocyte differentiation | 26/8552 | 37/18723 | 2.16e-03 | 9.62e-03 | 26 |
| Page: 1 2 3 |
| Pathway ID | Tissue | Disease Stage | Description | Gene Ratio | Bg Ratio | pvalue | p.adjust | qvalue | Count |
| Page: 1 |
Top |
Cell-cell communication analysis |
| Identification of potential cell-cell interactions between two cell types and their ligand-receptor pairs for different disease states |
| Ligand | Receptor | LRpair | Pathway | Tissue | Disease Stage |
| Page: 1 |
Top |
Single-cell gene regulatory network inference analysis |
| Find out the significant the regulons (TFs) and the target genes of each regulon across cell types for different disease states |
| TF | Cell Type | Tissue | Disease Stage | Target Gene | RSS | Regulon Activity |
| HOXA7 | MVA | Cervix | CC | CFAP20,CCL23,INHBB, etc. | 1.38e-02 |  |
| HOXA7 | ICAF | Cervix | HSIL_HPV | CFAP20,CCL23,INHBB, etc. | 2.99e-02 |  |
| HOXA7 | MYOFIB | Endometrium | Healthy | GPBAR1,INAFM2,APTR, etc. | 1.94e-01 |  |
| HOXA7 | MSC | Esophagus | Healthy | SFRP4,HOXB7,HOXA5, etc. | 1.30e-02 |  |
| HOXA7 | MSC.PVA | Skin | cSCC | ZBED5,MOSPD1,KLC2, etc. | 1.88e-02 |  |
| HOXA7 | LYMEND | Skin | SCCIS | ZBED5,MOSPD1,KLC2, etc. | 1.72e-02 |  |
| ∗The dot plots of a searched regulon are shown for all cell subpopulations in each disease state of each tissue based on the regulon specific score inferred using pySCENIC and by calculating the average expression. |
| Page: 1 |
Top |
Somatic mutation of malignant transformation related genes |
| Annotation of somatic variants for genes involved in malignant transformation |
| Hugo Symbol | Variant Class | Variant Classification | dbSNP RS | HGVSc | HGVSp | HGVSp Short | SWISSPROT | BIOTYPE | SIFT | PolyPhen | Tumor Sample Barcode | Tissue | Histology | Sex | Age | Stage | Therapy Types | Drugs | Outcome |
| HOXA7 | SNV | Missense_Mutation | novel | c.475N>T | p.Arg159Cys | p.R159C | P31268 | protein_coding | deleterious(0) | probably_damaging(1) | TCGA-AC-A62V-01 | Breast | breast invasive carcinoma | Male | <65 | III/IV | Targeted Molecular therapy | denosumab | PD |
| HOXA7 | SNV | Missense_Mutation | c.542G>A | p.Arg181His | p.R181H | P31268 | protein_coding | deleterious(0) | probably_damaging(1) | TCGA-C8-A8HP-01 | Breast | breast invasive carcinoma | Female | <65 | III/IV | Chemotherapy | 5-fluorouracil | CR | |
| HOXA7 | insertion | Frame_Shift_Ins | novel | c.439_440insGGACAATTCTTCTCTCGGGCTGCCCAAGCGACAGCTGTCAG | p.Lys147ArgfsTer23 | p.K147Rfs*23 | P31268 | protein_coding | TCGA-AN-A03X-01 | Breast | breast invasive carcinoma | Female | >=65 | I/II | Unknown | Unknown | SD | ||
| HOXA7 | insertion | Frame_Shift_Ins | novel | c.425_426insCGAGGGCGCCGTGCCCTCTGCCGCCGCCACT | p.Leu143GlufsTer30 | p.L143Efs*30 | P31268 | protein_coding | TCGA-B6-A0IJ-01 | Breast | breast invasive carcinoma | Female | <65 | I/II | Unknown | Unknown | SD | ||
| HOXA7 | SNV | Missense_Mutation | rs755438662 | c.89C>T | p.Ser30Phe | p.S30F | P31268 | protein_coding | deleterious(0) | possibly_damaging(0.592) | TCGA-JX-A3Q0-01 | Cervix | cervical & endocervical cancer | Female | <65 | III/IV | Unknown | Unknown | SD |
| HOXA7 | SNV | Missense_Mutation | novel | c.589N>A | p.Ala197Thr | p.A197T | P31268 | protein_coding | tolerated(0.78) | benign(0) | TCGA-A6-2686-01 | Colorectum | colon adenocarcinoma | Female | >=65 | I/II | Unknown | Unknown | SD |
| HOXA7 | SNV | Missense_Mutation | novel | c.526N>C | p.Ile176Leu | p.I176L | P31268 | protein_coding | deleterious(0.01) | probably_damaging(1) | TCGA-AA-3510-01 | Colorectum | colon adenocarcinoma | Male | >=65 | I/II | Unknown | Unknown | SD |
| HOXA7 | SNV | Missense_Mutation | novel | c.479G>A | p.Arg160His | p.R160H | P31268 | protein_coding | deleterious(0) | probably_damaging(0.999) | TCGA-AA-3877-01 | Colorectum | colon adenocarcinoma | Female | >=65 | I/II | Unknown | Unknown | SD |
| HOXA7 | SNV | Missense_Mutation | c.497N>T | p.Ala166Val | p.A166V | P31268 | protein_coding | tolerated(0.08) | possibly_damaging(0.663) | TCGA-DC-6157-01 | Colorectum | rectum adenocarcinoma | Male | <65 | I/II | Unknown | Unknown | SD | |
| HOXA7 | SNV | Missense_Mutation | c.550N>G | p.Lys184Glu | p.K184E | P31268 | protein_coding | deleterious(0) | probably_damaging(1) | TCGA-A5-A0GP-01 | Endometrium | uterine corpus endometrioid carcinoma | Female | <65 | I/II | Unknown | Unknown | SD |
| Page: 1 2 3 4 5 |
Top |
Related drugs of malignant transformation related genes |
| Identification of chemicals and drugs interact with genes involved in malignant transfromation |
| (DGIdb 4.0) |
| Entrez ID | Symbol | Category | Interaction Types | Drug Claim Name | Drug Name | PMIDs |
| Page: 1 |

Copyright 2023-Present -The University of Texas Health Science Center at Houston |