| Tissue | Expression Dynamics | Abbreviation |
| Cervix | 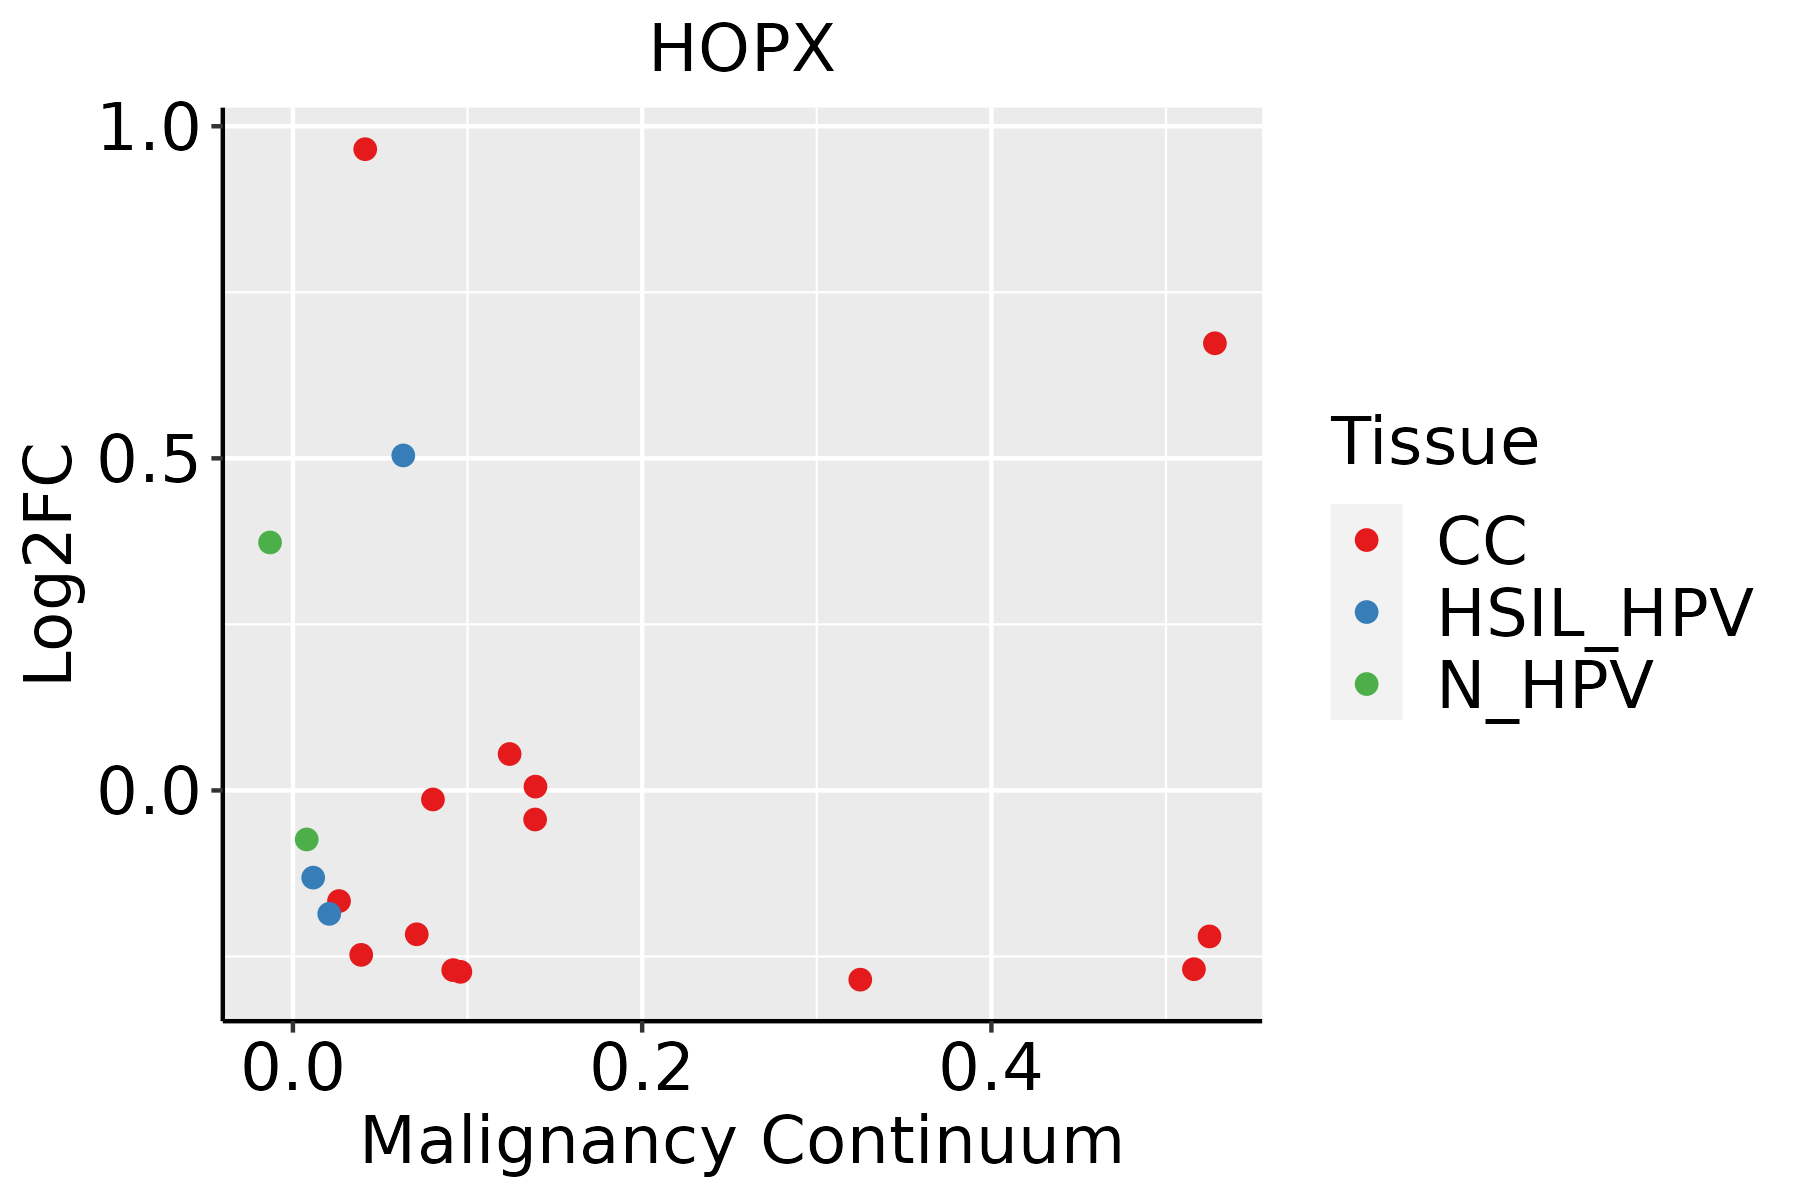 | CC: Cervix cancer |
| HSIL_HPV: HPV-infected high-grade squamous intraepithelial lesions |
| N_HPV: HPV-infected normal cervix |
| Esophagus | 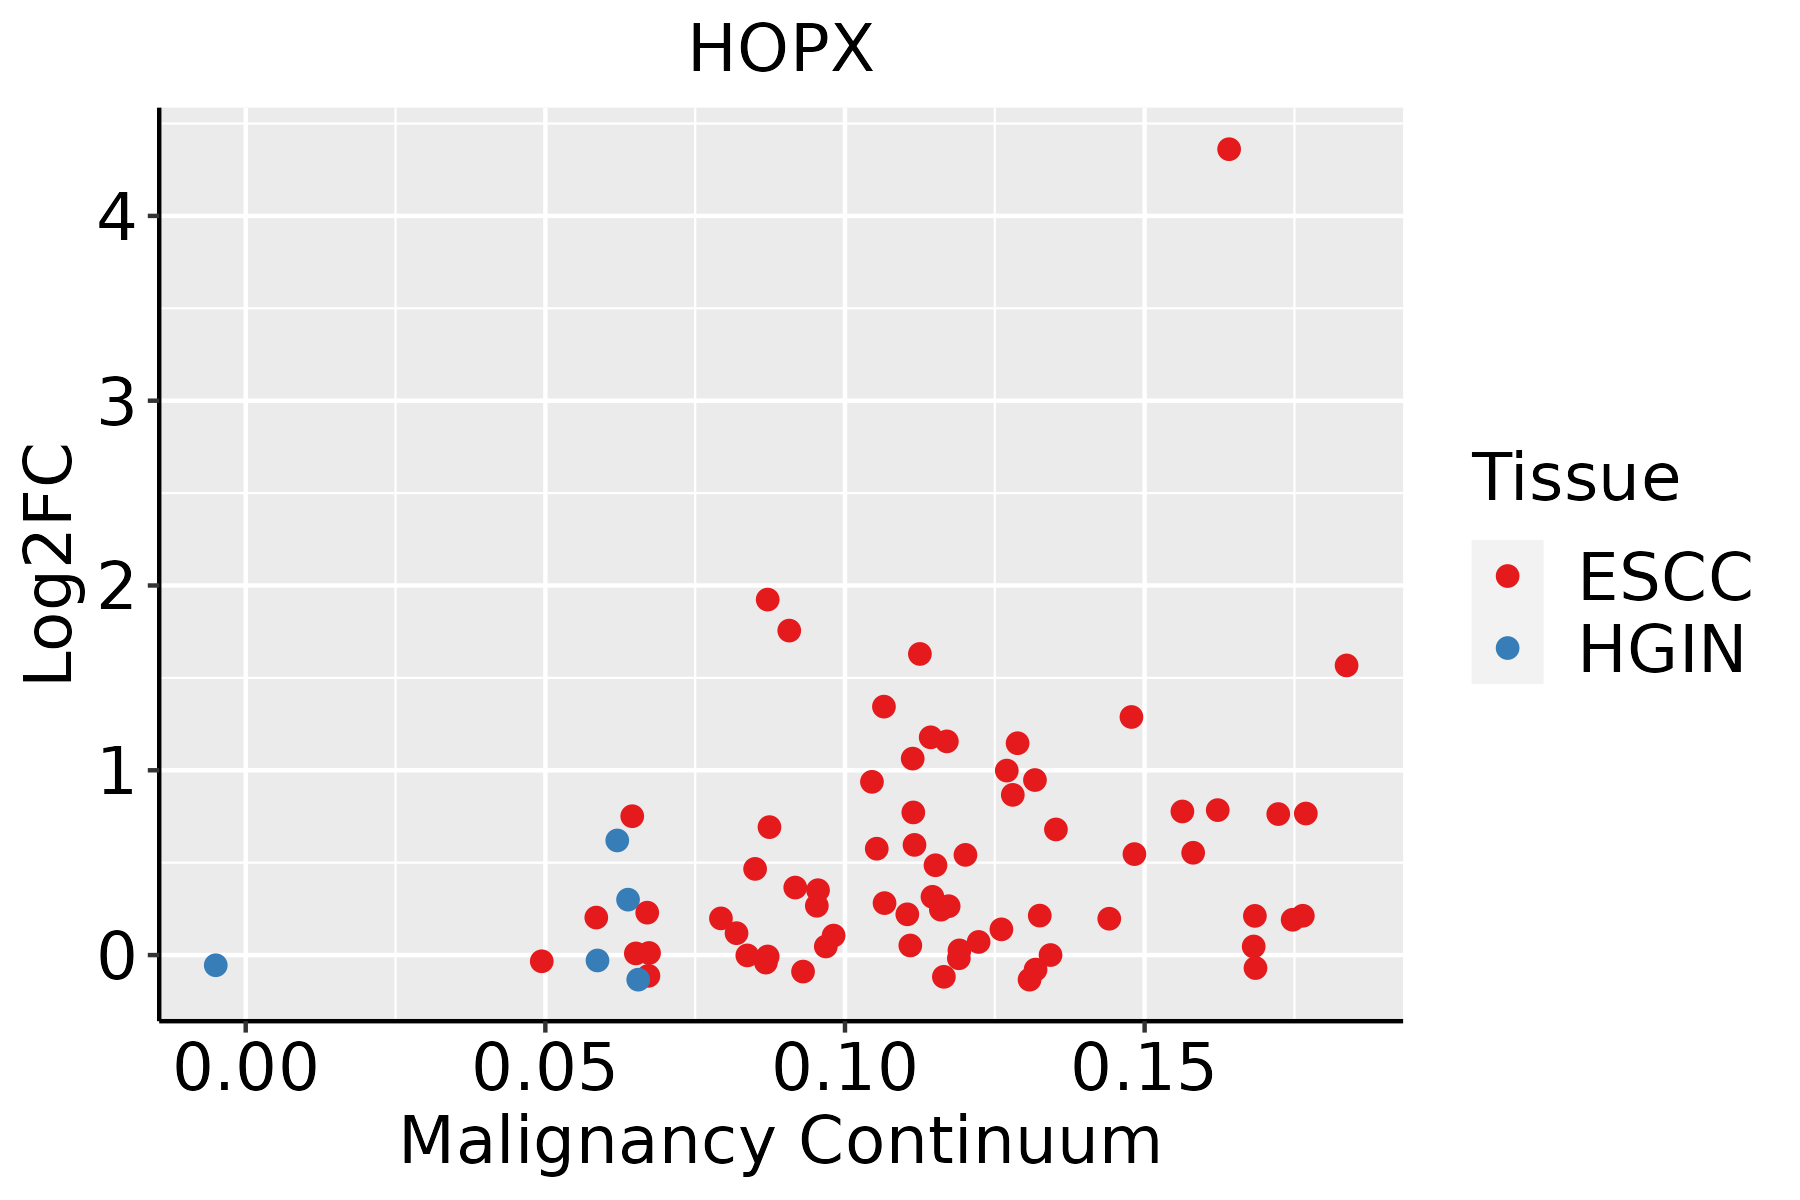 | ESCC: Esophageal squamous cell carcinoma |
| HGIN: High-grade intraepithelial neoplasias |
| LGIN: Low-grade intraepithelial neoplasias |
| Lung |  | AAH: Atypical adenomatous hyperplasia |
| AIS: Adenocarcinoma in situ |
| IAC: Invasive lung adenocarcinoma |
| MIA: Minimally invasive adenocarcinoma |
| Oral Cavity | 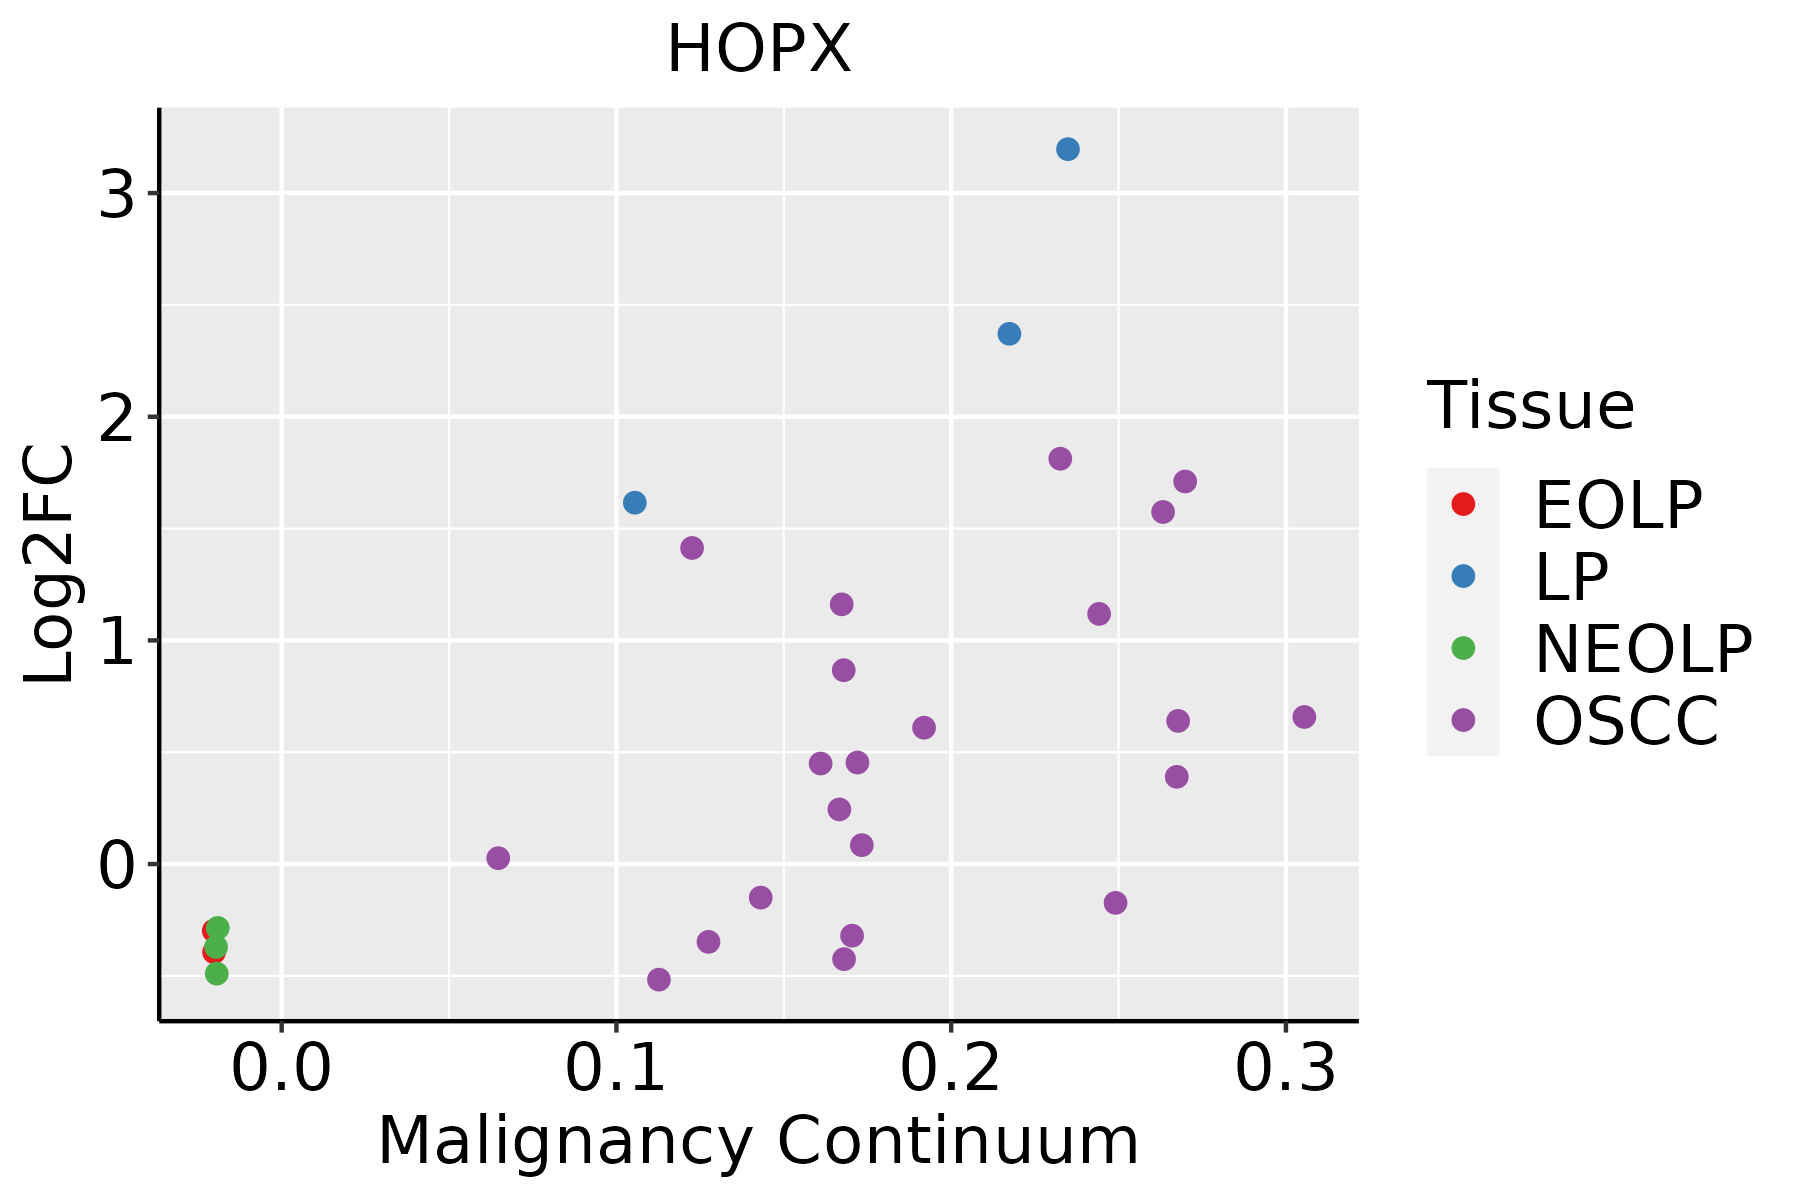 | EOLP: Erosive Oral lichen planus |
| LP: leukoplakia |
| NEOLP: Non-erosive oral lichen planus |
| OSCC: Oral squamous cell carcinoma |
| Skin | 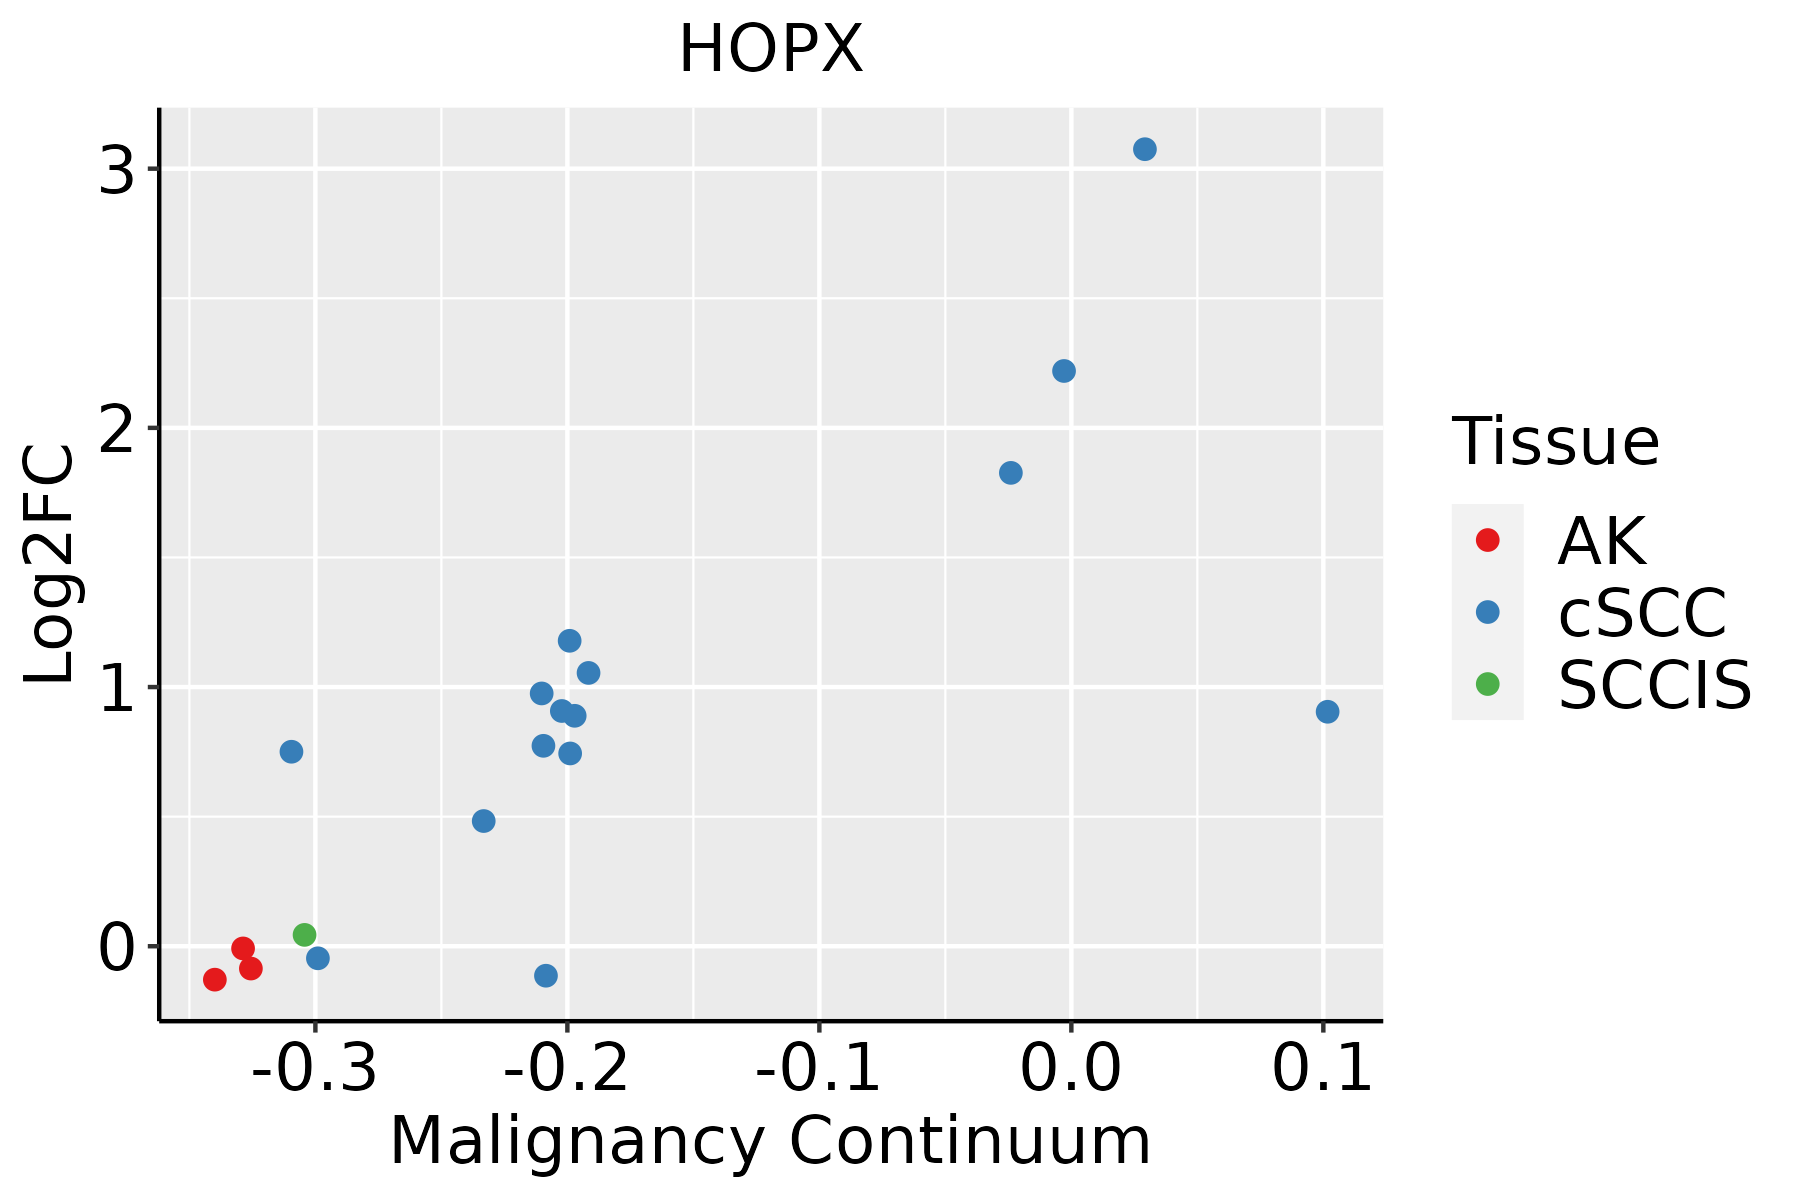 | AK: Actinic keratosis |
| cSCC: Cutaneous squamous cell carcinoma |
| SCCIS:squamous cell carcinoma in situ |
| Thyroid | 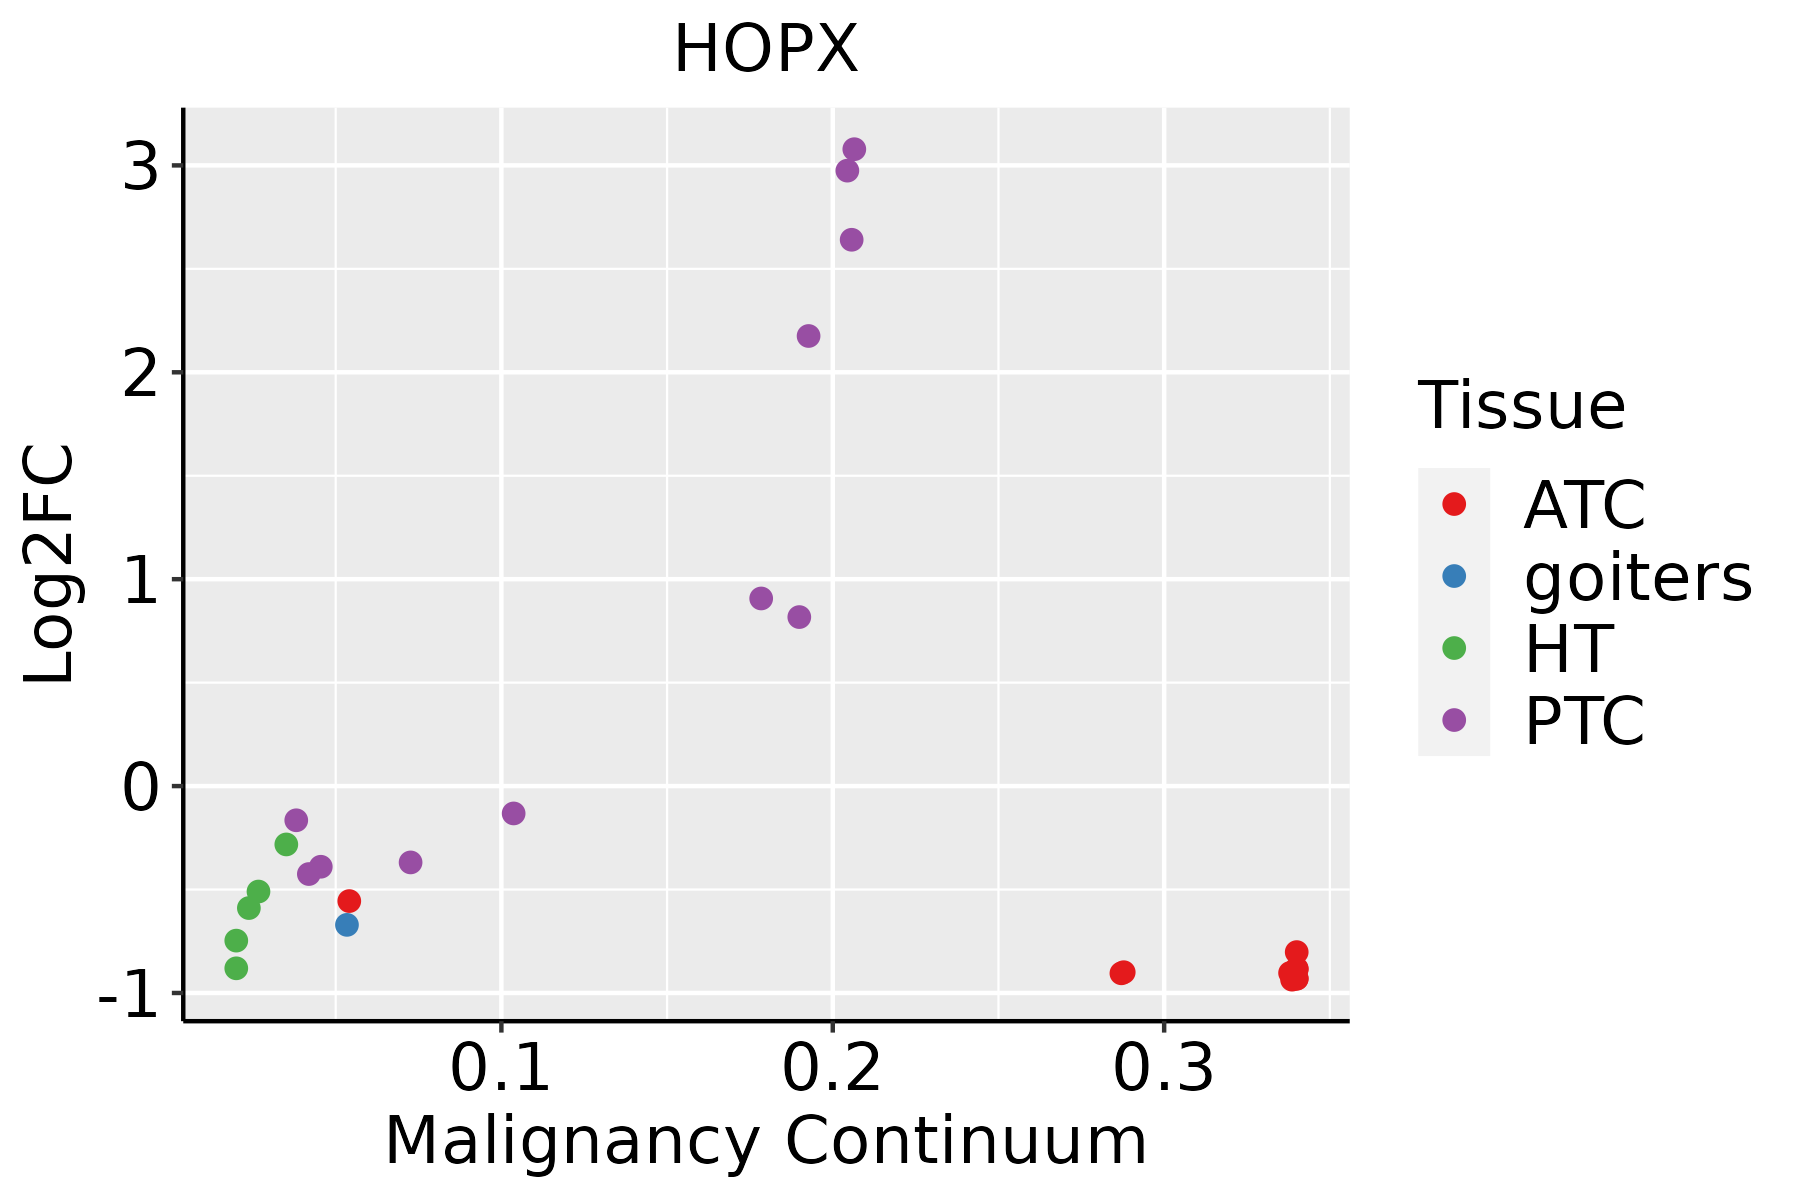 | ATC: Anaplastic thyroid cancer |
| HT: Hashimoto's thyroiditis |
| PTC: Papillary thyroid cancer |
| GO ID | Tissue | Disease Stage | Description | Gene Ratio | Bg Ratio | pvalue | p.adjust | Count |
| GO:005109810 | Cervix | CC | regulation of binding | 80/2311 | 363/18723 | 1.32e-07 | 6.42e-06 | 80 |
| GO:00310996 | Cervix | CC | regeneration | 46/2311 | 198/18723 | 1.43e-05 | 2.84e-04 | 46 |
| GO:00017018 | Cervix | CC | in utero embryonic development | 71/2311 | 367/18723 | 7.21e-05 | 1.00e-03 | 71 |
| GO:00605375 | Cervix | CC | muscle tissue development | 76/2311 | 403/18723 | 9.76e-05 | 1.27e-03 | 76 |
| GO:00459277 | Cervix | CC | positive regulation of growth | 53/2311 | 259/18723 | 1.33e-04 | 1.64e-03 | 53 |
| GO:00165705 | Cervix | CC | histone modification | 84/2311 | 463/18723 | 1.70e-04 | 2.01e-03 | 84 |
| GO:00147064 | Cervix | CC | striated muscle tissue development | 72/2311 | 384/18723 | 1.76e-04 | 2.07e-03 | 72 |
| GO:00433939 | Cervix | CC | regulation of protein binding | 42/2311 | 196/18723 | 2.27e-04 | 2.55e-03 | 42 |
| GO:00486386 | Cervix | CC | regulation of developmental growth | 61/2311 | 330/18723 | 7.69e-04 | 6.85e-03 | 61 |
| GO:00426924 | Cervix | CC | muscle cell differentiation | 69/2311 | 384/18723 | 8.12e-04 | 7.09e-03 | 69 |
| GO:0042246 | Cervix | CC | tissue regeneration | 19/2311 | 72/18723 | 9.11e-04 | 7.81e-03 | 19 |
| GO:00434032 | Cervix | CC | skeletal muscle tissue regeneration | 12/2311 | 37/18723 | 1.15e-03 | 9.39e-03 | 12 |
| GO:00303245 | Cervix | CC | lung development | 36/2311 | 177/18723 | 1.64e-03 | 1.26e-02 | 36 |
| GO:00303235 | Cervix | CC | respiratory tube development | 36/2311 | 181/18723 | 2.46e-03 | 1.71e-02 | 36 |
| GO:00018291 | Cervix | CC | trophectodermal cell differentiation | 7/2311 | 17/18723 | 2.72e-03 | 1.85e-02 | 7 |
| GO:00605413 | Cervix | CC | respiratory system development | 39/2311 | 203/18723 | 3.18e-03 | 2.07e-02 | 39 |
| GO:00511464 | Cervix | CC | striated muscle cell differentiation | 50/2311 | 283/18723 | 5.53e-03 | 3.19e-02 | 50 |
| GO:00486395 | Cervix | CC | positive regulation of developmental growth | 33/2311 | 174/18723 | 7.65e-03 | 4.07e-02 | 33 |
| GO:003109913 | Cervix | HSIL_HPV | regeneration | 20/737 | 198/18723 | 1.12e-04 | 2.33e-03 | 20 |
| GO:001470611 | Cervix | HSIL_HPV | striated muscle tissue development | 28/737 | 384/18723 | 1.35e-03 | 1.55e-02 | 28 |
| Hugo Symbol | Variant Class | Variant Classification | dbSNP RS | HGVSc | HGVSp | HGVSp Short | SWISSPROT | BIOTYPE | SIFT | PolyPhen | Tumor Sample Barcode | Tissue | Histology | Sex | Age | Stage | Therapy Types | Drugs | Outcome |
| HOPX | SNV | Missense_Mutation | novel | c.40N>A | p.Glu14Lys | p.E14K | Q9BPY8 | protein_coding | tolerated_low_confidence(0.29) | benign(0.053) | TCGA-JW-A5VL-01 | Cervix | cervical & endocervical cancer | Female | <65 | I/II | Unknown | Unknown | SD |
| HOPX | SNV | Missense_Mutation | | c.301N>C | p.Phe101Leu | p.F101L | Q9BPY8 | protein_coding | deleterious_low_confidence(0) | possibly_damaging(0.903) | TCGA-AA-3864-01 | Colorectum | colon adenocarcinoma | Male | >=65 | I/II | Unknown | Unknown | SD |
| HOPX | SNV | Missense_Mutation | novel | c.205N>T | p.Asp69Tyr | p.D69Y | Q9BPY8 | protein_coding | tolerated_low_confidence(0.89) | benign(0.092) | TCGA-AZ-4315-01 | Colorectum | colon adenocarcinoma | Male | <65 | I/II | Unknown | Unknown | SD |
| HOPX | SNV | Missense_Mutation | novel | c.258A>C | p.Glu86Asp | p.E86D | Q9BPY8 | protein_coding | tolerated_low_confidence(0.07) | possibly_damaging(0.558) | TCGA-BS-A0UF-01 | Endometrium | uterine corpus endometrioid carcinoma | Female | >=65 | I/II | Unknown | Unknown | SD |
| HOPX | SNV | Missense_Mutation | novel | c.295N>A | p.Asp99Asn | p.D99N | Q9BPY8 | protein_coding | deleterious_low_confidence(0) | benign(0.003) | TCGA-D1-A103-01 | Endometrium | uterine corpus endometrioid carcinoma | Female | >=65 | I/II | Unknown | Unknown | SD |
| HOPX | SNV | Missense_Mutation | rs535907950 | c.314N>T | p.Pro105Leu | p.P105L | Q9BPY8 | protein_coding | deleterious_low_confidence(0) | benign(0.013) | TCGA-D1-A17D-01 | Endometrium | uterine corpus endometrioid carcinoma | Female | <65 | I/II | Chemotherapy | carboplatin | SD |
| HOPX | SNV | Missense_Mutation | novel | c.295N>A | p.Asp99Asn | p.D99N | Q9BPY8 | protein_coding | deleterious_low_confidence(0) | benign(0.003) | TCGA-FI-A2D5-01 | Endometrium | uterine corpus endometrioid carcinoma | Female | <65 | III/IV | Chemotherapy | carboplatinum | PD |
| HOPX | SNV | Missense_Mutation | novel | c.53N>T | p.Thr18Ile | p.T18I | Q9BPY8 | protein_coding | tolerated_low_confidence(0.11) | possibly_damaging(0.522) | TCGA-2Y-A9GZ-01 | Liver | liver hepatocellular carcinoma | Female | >=65 | I/II | Targeted Molecular therapy | sorafenib | PD |
| HOPX | SNV | Missense_Mutation | | c.170N>T | p.Glu57Val | p.E57V | Q9BPY8 | protein_coding | deleterious_low_confidence(0) | probably_damaging(0.998) | TCGA-43-5668-01 | Lung | lung squamous cell carcinoma | Male | >=65 | I/II | Other, specify in notesMAGE3-AS15-NSC-003 | clinical | PD |
| HOPX | SNV | Missense_Mutation | | c.86A>T | p.Glu29Val | p.E29V | Q9BPY8 | protein_coding | deleterious_low_confidence(0) | possibly_damaging(0.506) | TCGA-66-2793-01 | Lung | lung squamous cell carcinoma | Male | >=65 | III/IV | Unknown | Unknown | SD |


