
|
|||||
|
 | |
| |
| |
| |
| |
| |
|
Gene: HOOK3 |
Gene summary for HOOK3 |
| Gene information | Species | Human | Gene symbol | HOOK3 | Gene ID | 84376 |
| Gene name | hook microtubule tethering protein 3 | |
| Gene Alias | HK3 | |
| Cytomap | 8p11.21 | |
| Gene Type | protein-coding | GO ID | GO:0000226 | UniProtAcc | Q86VS8 |
Top |
Malignant transformation analysis |
| Identification of the aberrant gene expression in precancerous and cancerous lesions by comparing the gene expression of stem-like cells in diseased tissues with normal stem cells |
| Entrez ID | Symbol | Replicates | Species | Organ | Tissue | Adj P-value | Log2FC | Malignancy |
| 84376 | HOOK3 | LZE2T | Human | Esophagus | ESCC | 5.59e-04 | 8.76e-01 | 0.082 |
| 84376 | HOOK3 | LZE4T | Human | Esophagus | ESCC | 1.32e-14 | 4.38e-01 | 0.0811 |
| 84376 | HOOK3 | LZE7T | Human | Esophagus | ESCC | 3.12e-02 | 8.98e-02 | 0.0667 |
| 84376 | HOOK3 | LZE8T | Human | Esophagus | ESCC | 1.09e-04 | 9.88e-02 | 0.067 |
| 84376 | HOOK3 | LZE20T | Human | Esophagus | ESCC | 2.36e-13 | 5.96e-01 | 0.0662 |
| 84376 | HOOK3 | LZE22T | Human | Esophagus | ESCC | 1.84e-02 | 2.65e-01 | 0.068 |
| 84376 | HOOK3 | LZE24T | Human | Esophagus | ESCC | 8.86e-16 | 5.46e-01 | 0.0596 |
| 84376 | HOOK3 | P1T-E | Human | Esophagus | ESCC | 4.30e-05 | 6.39e-01 | 0.0875 |
| 84376 | HOOK3 | P2T-E | Human | Esophagus | ESCC | 1.42e-37 | 6.65e-01 | 0.1177 |
| 84376 | HOOK3 | P4T-E | Human | Esophagus | ESCC | 1.60e-29 | 6.18e-01 | 0.1323 |
| 84376 | HOOK3 | P5T-E | Human | Esophagus | ESCC | 7.44e-10 | 2.50e-01 | 0.1327 |
| 84376 | HOOK3 | P8T-E | Human | Esophagus | ESCC | 1.14e-25 | 4.65e-01 | 0.0889 |
| 84376 | HOOK3 | P9T-E | Human | Esophagus | ESCC | 9.82e-14 | 3.23e-01 | 0.1131 |
| 84376 | HOOK3 | P10T-E | Human | Esophagus | ESCC | 4.80e-27 | 5.71e-01 | 0.116 |
| 84376 | HOOK3 | P11T-E | Human | Esophagus | ESCC | 1.37e-15 | 7.32e-01 | 0.1426 |
| 84376 | HOOK3 | P12T-E | Human | Esophagus | ESCC | 6.65e-32 | 7.94e-01 | 0.1122 |
| 84376 | HOOK3 | P15T-E | Human | Esophagus | ESCC | 9.01e-31 | 7.70e-01 | 0.1149 |
| 84376 | HOOK3 | P16T-E | Human | Esophagus | ESCC | 2.66e-61 | 1.32e+00 | 0.1153 |
| 84376 | HOOK3 | P17T-E | Human | Esophagus | ESCC | 6.38e-08 | 4.49e-01 | 0.1278 |
| 84376 | HOOK3 | P19T-E | Human | Esophagus | ESCC | 5.20e-08 | 9.15e-01 | 0.1662 |
| Page: 1 2 3 4 5 6 7 |
| Tissue | Expression Dynamics | Abbreviation |
| Esophagus | 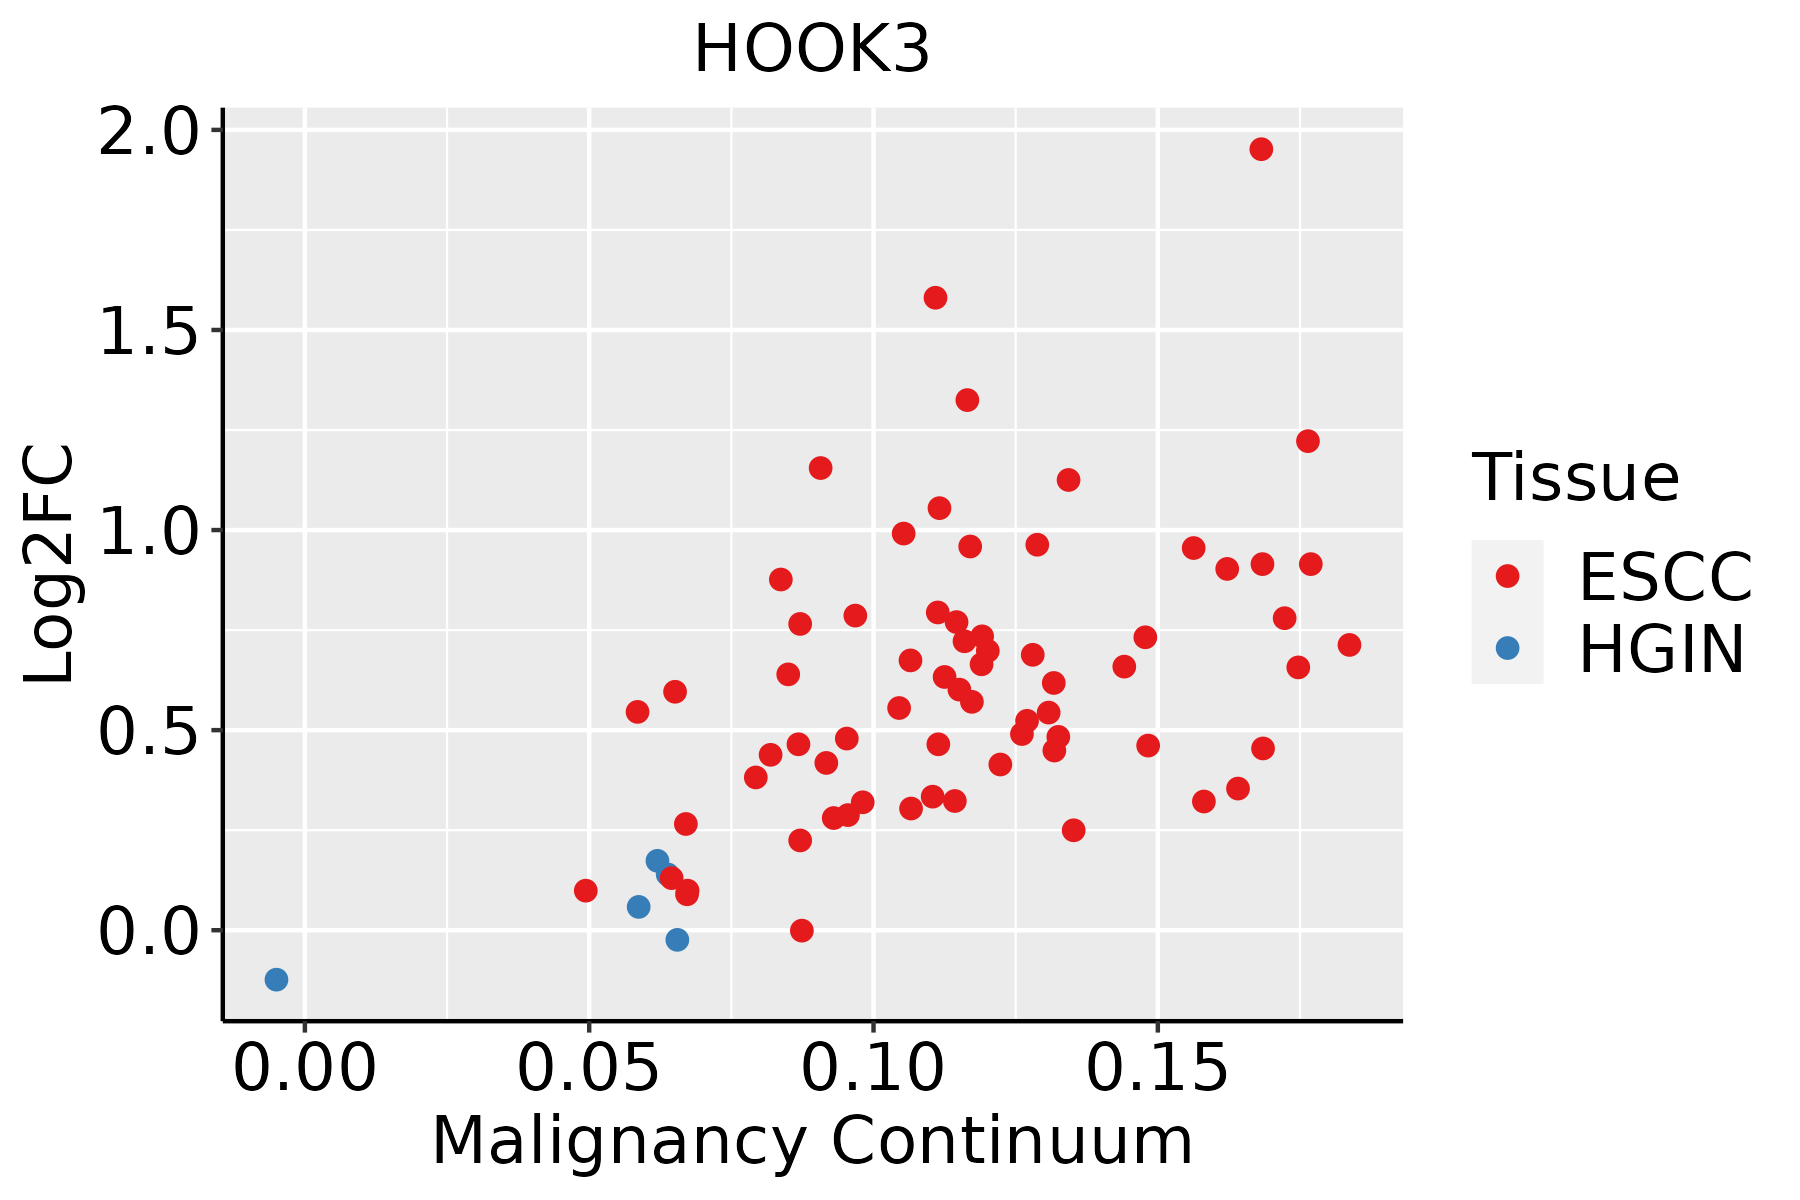 | ESCC: Esophageal squamous cell carcinoma |
| HGIN: High-grade intraepithelial neoplasias | ||
| LGIN: Low-grade intraepithelial neoplasias | ||
| Liver | 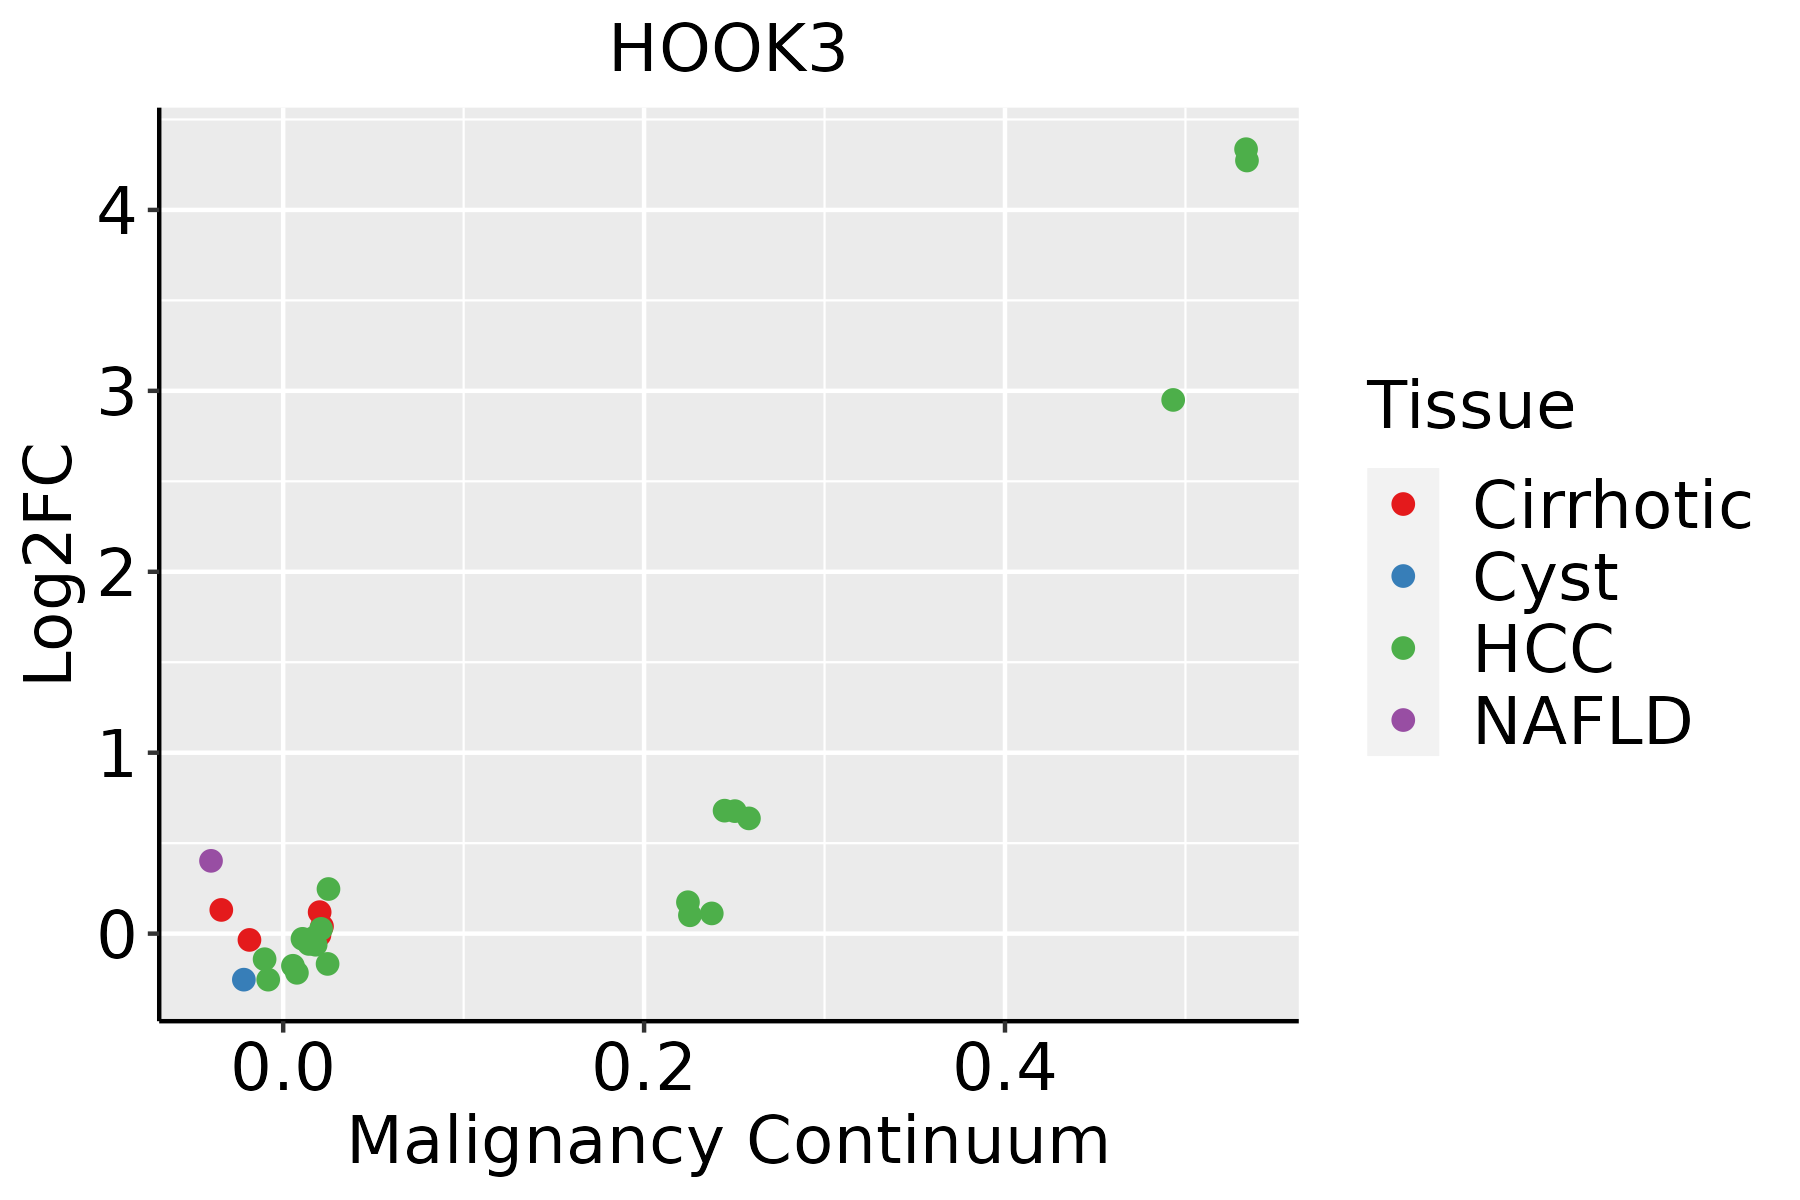 | HCC: Hepatocellular carcinoma |
| NAFLD: Non-alcoholic fatty liver disease | ||
| Lung |  | AAH: Atypical adenomatous hyperplasia |
| AIS: Adenocarcinoma in situ | ||
| IAC: Invasive lung adenocarcinoma | ||
| MIA: Minimally invasive adenocarcinoma | ||
| Oral Cavity |  | EOLP: Erosive Oral lichen planus |
| LP: leukoplakia | ||
| NEOLP: Non-erosive oral lichen planus | ||
| OSCC: Oral squamous cell carcinoma | ||
| Prostate |  | BPH: Benign Prostatic Hyperplasia |
| Skin | 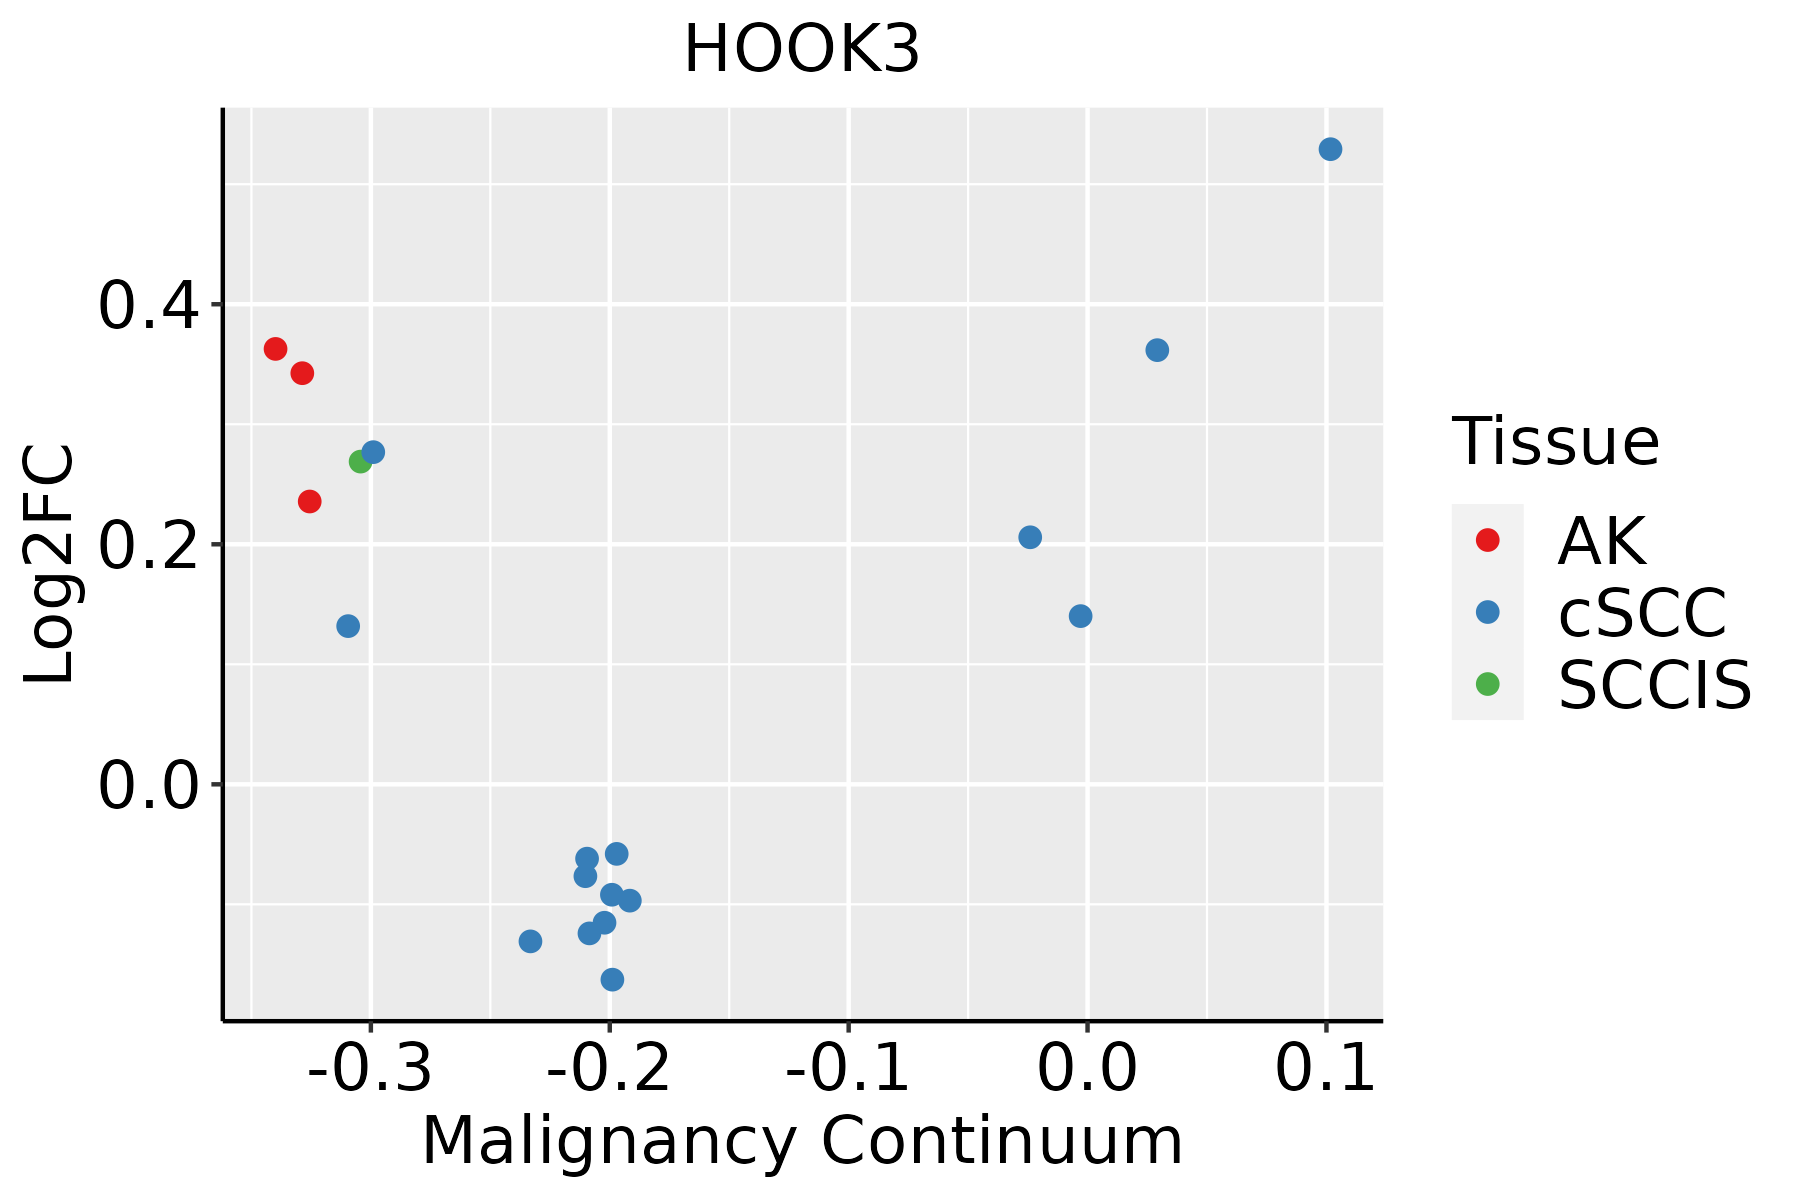 | AK: Actinic keratosis |
| cSCC: Cutaneous squamous cell carcinoma | ||
| SCCIS:squamous cell carcinoma in situ | ||
| Thyroid | 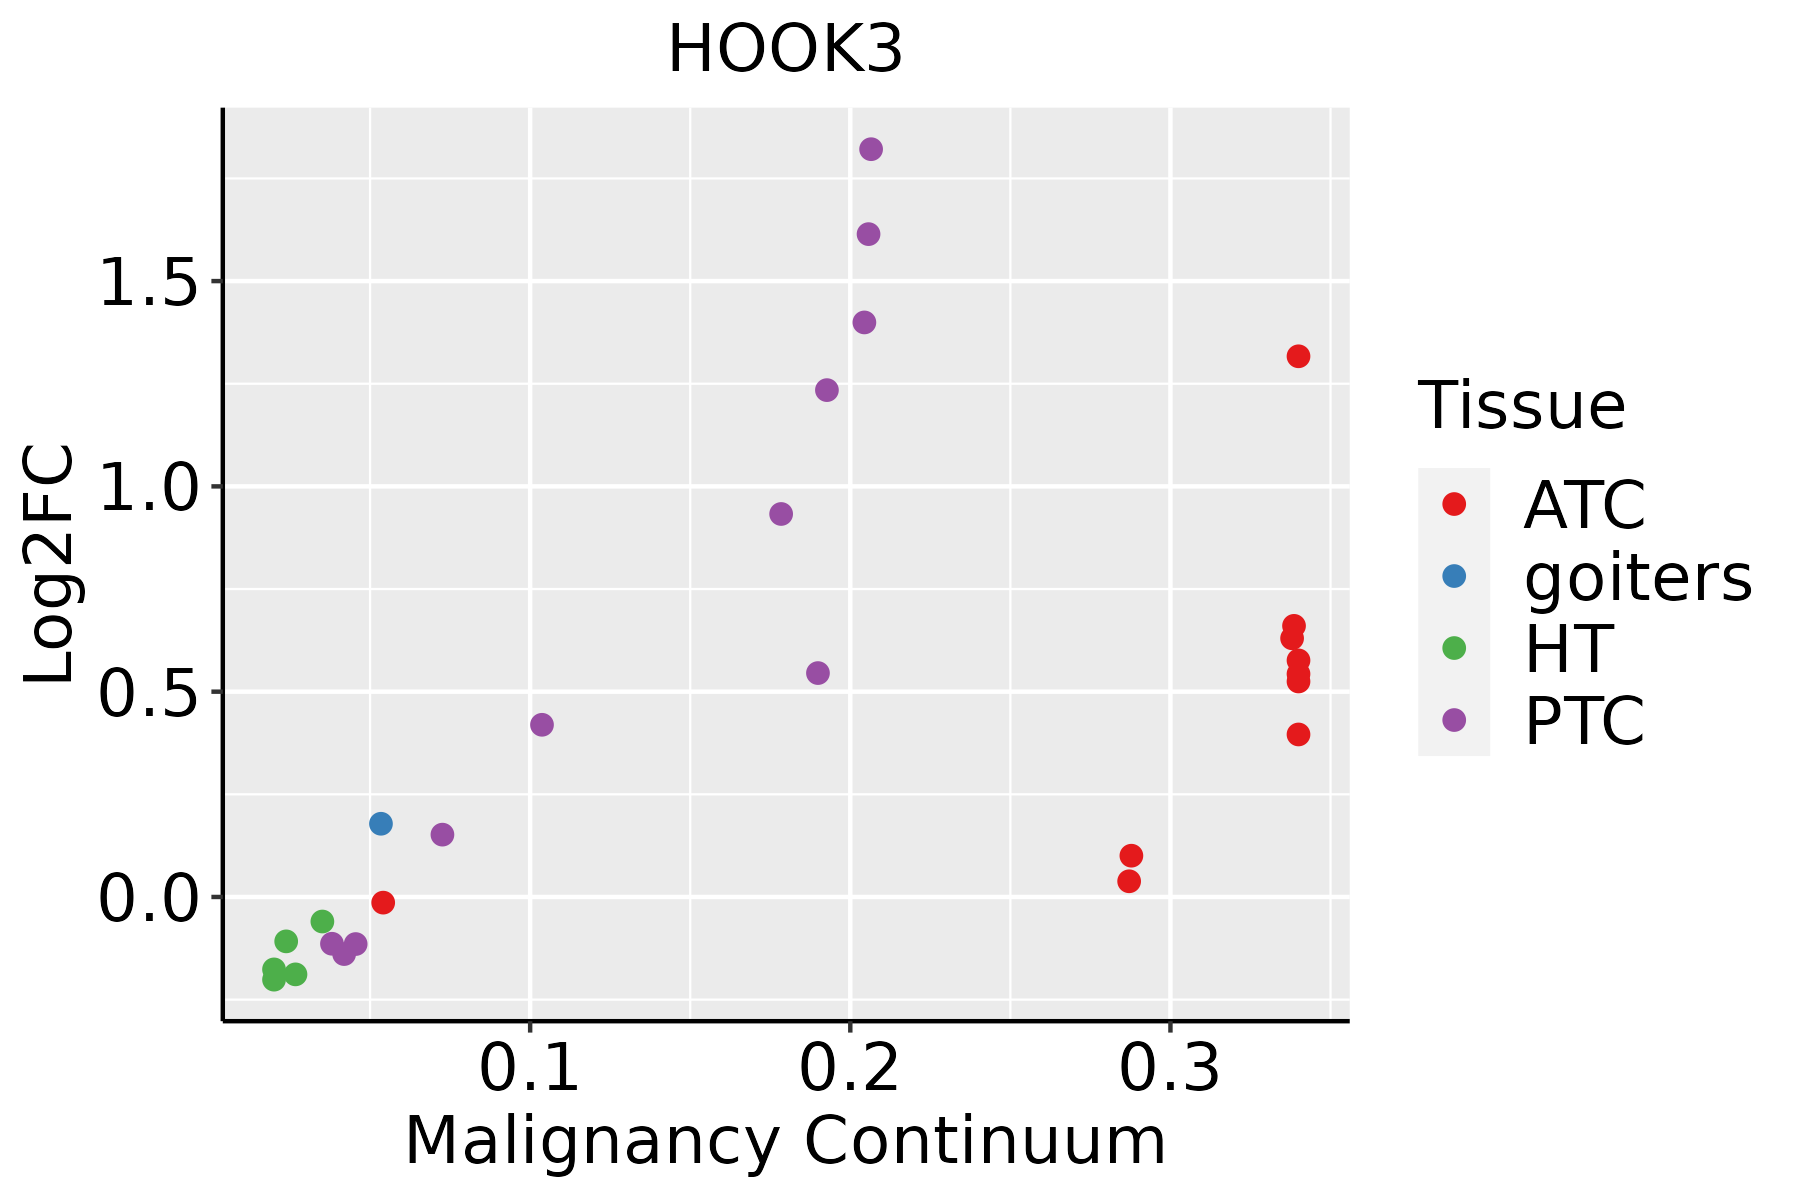 | ATC: Anaplastic thyroid cancer |
| HT: Hashimoto's thyroiditis | ||
| PTC: Papillary thyroid cancer |
| ∗log2FC in expression of this searched gene in stem-like cells from each diseased tissue sample relative to stem-like cells in normal samples in each tissue plotted against the malignancy continuum. Samples are colored based on if they are from different disease stage. |
Top |
Malignant transformation related pathway analysis |
| Find out the enriched GO biological processes and KEGG pathways involved in transition from healthy to precancer to cancer |
| Tissue | Disease Stage | Enriched GO biological Processes |
| Colorectum | AD |  |
| Colorectum | SER |  |
| Colorectum | MSS |  |
| Colorectum | MSI-H |  |
| Colorectum | FAP |  |
| ∗Top 15 enriched GO BP terms are showed in the bar plot of each disease state in each tissue. Each row represents a significant GO biological process which is colored according to the -log10(p.adjust). |
| Page: 1 2 3 4 5 6 7 8 9 |
| GO ID | Tissue | Disease Stage | Description | Gene Ratio | Bg Ratio | pvalue | p.adjust | Count |
| GO:005165617 | Esophagus | ESCC | establishment of organelle localization | 273/8552 | 390/18723 | 9.13e-23 | 1.81e-20 | 273 |
| GO:001605014 | Esophagus | ESCC | vesicle organization | 211/8552 | 300/18723 | 2.85e-18 | 2.87e-16 | 211 |
| GO:000703417 | Esophagus | ESCC | vacuolar transport | 119/8552 | 157/18723 | 1.16e-14 | 6.30e-13 | 119 |
| GO:001648210 | Esophagus | ESCC | cytosolic transport | 124/8552 | 168/18723 | 9.69e-14 | 4.69e-12 | 124 |
| GO:000703314 | Esophagus | ESCC | vacuole organization | 127/8552 | 180/18723 | 1.04e-11 | 3.85e-10 | 127 |
| GO:003070518 | Esophagus | ESCC | cytoskeleton-dependent intracellular transport | 133/8552 | 195/18723 | 1.48e-10 | 4.27e-09 | 133 |
| GO:00070419 | Esophagus | ESCC | lysosomal transport | 83/8552 | 114/18723 | 3.52e-09 | 7.41e-08 | 83 |
| GO:000703214 | Esophagus | ESCC | endosome organization | 61/8552 | 82/18723 | 1.13e-07 | 1.85e-06 | 61 |
| GO:00989278 | Esophagus | ESCC | vesicle-mediated transport between endosomal compartments | 36/8552 | 43/18723 | 2.90e-07 | 4.20e-06 | 36 |
| GO:00726985 | Esophagus | ESCC | protein localization to microtubule cytoskeleton | 43/8552 | 54/18723 | 3.28e-07 | 4.61e-06 | 43 |
| GO:009872714 | Esophagus | ESCC | maintenance of cell number | 90/8552 | 134/18723 | 3.94e-07 | 5.43e-06 | 90 |
| GO:001982714 | Esophagus | ESCC | stem cell population maintenance | 88/8552 | 131/18723 | 5.23e-07 | 6.97e-06 | 88 |
| GO:00443804 | Esophagus | ESCC | protein localization to cytoskeleton | 45/8552 | 58/18723 | 6.89e-07 | 8.99e-06 | 45 |
| GO:00450226 | Esophagus | ESCC | early endosome to late endosome transport | 33/8552 | 40/18723 | 1.80e-06 | 2.11e-05 | 33 |
| GO:00070403 | Esophagus | ESCC | lysosome organization | 53/8552 | 74/18723 | 5.34e-06 | 5.57e-05 | 53 |
| GO:00801713 | Esophagus | ESCC | lytic vacuole organization | 53/8552 | 74/18723 | 5.34e-06 | 5.57e-05 | 53 |
| GO:19055086 | Esophagus | ESCC | protein localization to microtubule organizing center | 28/8552 | 35/18723 | 3.40e-05 | 2.78e-04 | 28 |
| GO:00083333 | Esophagus | ESCC | endosome to lysosome transport | 40/8552 | 55/18723 | 4.27e-05 | 3.42e-04 | 40 |
| GO:005076710 | Esophagus | ESCC | regulation of neurogenesis | 203/8552 | 364/18723 | 6.10e-05 | 4.68e-04 | 203 |
| GO:00715396 | Esophagus | ESCC | protein localization to centrosome | 26/8552 | 33/18723 | 1.06e-04 | 7.43e-04 | 26 |
| Page: 1 2 3 4 5 6 7 8 9 10 11 12 13 14 |
| Pathway ID | Tissue | Disease Stage | Description | Gene Ratio | Bg Ratio | pvalue | p.adjust | qvalue | Count |
| hsa04814 | Lung | MIAC | Motor proteins | 21/507 | 193/8465 | 5.64e-03 | 3.82e-02 | 2.76e-02 | 21 |
| hsa048141 | Lung | MIAC | Motor proteins | 21/507 | 193/8465 | 5.64e-03 | 3.82e-02 | 2.76e-02 | 21 |
| hsa048145 | Oral cavity | NEOLP | Motor proteins | 37/1112 | 193/8465 | 1.06e-02 | 3.54e-02 | 2.22e-02 | 37 |
| hsa0481412 | Oral cavity | NEOLP | Motor proteins | 37/1112 | 193/8465 | 1.06e-02 | 3.54e-02 | 2.22e-02 | 37 |
| Page: 1 |
Top |
Cell-cell communication analysis |
| Identification of potential cell-cell interactions between two cell types and their ligand-receptor pairs for different disease states |
| Ligand | Receptor | LRpair | Pathway | Tissue | Disease Stage |
| Page: 1 |
Top |
Single-cell gene regulatory network inference analysis |
| Find out the significant the regulons (TFs) and the target genes of each regulon across cell types for different disease states |
| TF | Cell Type | Tissue | Disease Stage | Target Gene | RSS | Regulon Activity |
| ∗The dot plots of a searched regulon are shown for all cell subpopulations in each disease state of each tissue based on the regulon specific score inferred using pySCENIC and by calculating the average expression. |
| Page: 1 |
Top |
Somatic mutation of malignant transformation related genes |
| Annotation of somatic variants for genes involved in malignant transformation |
| Hugo Symbol | Variant Class | Variant Classification | dbSNP RS | HGVSc | HGVSp | HGVSp Short | SWISSPROT | BIOTYPE | SIFT | PolyPhen | Tumor Sample Barcode | Tissue | Histology | Sex | Age | Stage | Therapy Types | Drugs | Outcome |
| HOOK3 | SNV | Missense_Mutation | c.631N>C | p.Glu211Gln | p.E211Q | Q86VS8 | protein_coding | deleterious(0.02) | possibly_damaging(0.608) | TCGA-A2-A04P-01 | Breast | breast invasive carcinoma | Female | <65 | III/IV | Chemotherapy | taxol | PD | |
| HOOK3 | SNV | Missense_Mutation | c.1547N>A | p.Arg516Lys | p.R516K | Q86VS8 | protein_coding | deleterious(0.02) | probably_damaging(0.964) | TCGA-A2-A0CX-01 | Breast | breast invasive carcinoma | Female | <65 | I/II | Chemotherapy | adriamycin | SD | |
| HOOK3 | SNV | Missense_Mutation | novel | c.1086C>G | p.Asn362Lys | p.N362K | Q86VS8 | protein_coding | deleterious(0.03) | possibly_damaging(0.793) | TCGA-A2-A4S1-01 | Breast | breast invasive carcinoma | Female | >=65 | I/II | Unknown | Unknown | SD |
| HOOK3 | SNV | Missense_Mutation | c.1021N>C | p.Glu341Gln | p.E341Q | Q86VS8 | protein_coding | tolerated(0.23) | benign(0.078) | TCGA-C8-A26Y-01 | Breast | breast invasive carcinoma | Female | >=65 | I/II | Unknown | Unknown | SD | |
| HOOK3 | SNV | Missense_Mutation | c.325N>A | p.His109Asn | p.H109N | Q86VS8 | protein_coding | tolerated(0.32) | benign(0.062) | TCGA-E2-A1IG-01 | Breast | breast invasive carcinoma | Female | <65 | I/II | Chemotherapy | cyclophosphamide | SD | |
| HOOK3 | insertion | Frame_Shift_Ins | novel | c.1977_1978dupGA | p.Met660ArgfsTer16 | p.M660Rfs*16 | Q86VS8 | protein_coding | TCGA-EW-A1IZ-01 | Breast | breast invasive carcinoma | Female | <65 | III/IV | Chemotherapy | taxotere | SD | ||
| HOOK3 | SNV | Missense_Mutation | novel | c.883N>A | p.Glu295Lys | p.E295K | Q86VS8 | protein_coding | deleterious(0) | probably_damaging(0.977) | TCGA-C5-A7UI-01 | Cervix | cervical & endocervical cancer | Female | <65 | I/II | Unknown | Unknown | SD |
| HOOK3 | SNV | Missense_Mutation | c.148N>A | p.Pro50Thr | p.P50T | Q86VS8 | protein_coding | deleterious(0.01) | benign(0.186) | TCGA-EK-A3GK-01 | Cervix | cervical & endocervical cancer | Female | <65 | I/II | Unknown | Unknown | SD | |
| HOOK3 | SNV | Missense_Mutation | novel | c.160N>C | p.Asp54His | p.D54H | Q86VS8 | protein_coding | deleterious(0.02) | possibly_damaging(0.826) | TCGA-VS-A9UM-01 | Cervix | cervical & endocervical cancer | Female | <65 | I/II | Chemotherapy | cisplatin | CR |
| HOOK3 | SNV | Missense_Mutation | c.1902N>C | p.Lys634Asn | p.K634N | Q86VS8 | protein_coding | deleterious(0) | probably_damaging(0.947) | TCGA-A6-5664-01 | Colorectum | colon adenocarcinoma | Male | >=65 | III/IV | Chemotherapy | fluorouracil | SD |
| Page: 1 2 3 4 5 6 7 |
Top |
Related drugs of malignant transformation related genes |
| Identification of chemicals and drugs interact with genes involved in malignant transfromation |
| (DGIdb 4.0) |
| Entrez ID | Symbol | Category | Interaction Types | Drug Claim Name | Drug Name | PMIDs |
| Page: 1 |

Copyright 2023-Present -The University of Texas Health Science Center at Houston |