
|
|||||
|
 | |
| |
| |
| |
| |
| |
|
Gene: HOOK2 |
Gene summary for HOOK2 |
| Gene information | Species | Human | Gene symbol | HOOK2 | Gene ID | 29911 |
| Gene name | hook microtubule tethering protein 2 | |
| Gene Alias | HK2 | |
| Cytomap | 19p13.13 | |
| Gene Type | protein-coding | GO ID | GO:0000226 | UniProtAcc | Q96ED9 |
Top |
Malignant transformation analysis |
| Identification of the aberrant gene expression in precancerous and cancerous lesions by comparing the gene expression of stem-like cells in diseased tissues with normal stem cells |
| Entrez ID | Symbol | Replicates | Species | Organ | Tissue | Adj P-value | Log2FC | Malignancy |
| 29911 | HOOK2 | HTA11_3410_2000001011 | Human | Colorectum | AD | 8.37e-03 | 1.54e-01 | 0.0155 |
| 29911 | HOOK2 | HTA11_2487_2000001011 | Human | Colorectum | SER | 7.15e-07 | 7.29e-01 | -0.1808 |
| 29911 | HOOK2 | HTA11_1938_2000001011 | Human | Colorectum | AD | 2.71e-09 | 6.50e-01 | -0.0811 |
| 29911 | HOOK2 | HTA11_78_2000001011 | Human | Colorectum | AD | 1.25e-04 | 5.02e-01 | -0.1088 |
| 29911 | HOOK2 | HTA11_347_2000001011 | Human | Colorectum | AD | 1.09e-23 | 7.45e-01 | -0.1954 |
| 29911 | HOOK2 | HTA11_3361_2000001011 | Human | Colorectum | AD | 2.81e-04 | 4.71e-01 | -0.1207 |
| 29911 | HOOK2 | HTA11_83_2000001011 | Human | Colorectum | SER | 5.86e-08 | 6.78e-01 | -0.1526 |
| 29911 | HOOK2 | HTA11_696_2000001011 | Human | Colorectum | AD | 4.59e-15 | 7.30e-01 | -0.1464 |
| 29911 | HOOK2 | HTA11_866_2000001011 | Human | Colorectum | AD | 2.67e-10 | 5.50e-01 | -0.1001 |
| 29911 | HOOK2 | HTA11_1391_2000001011 | Human | Colorectum | AD | 3.01e-15 | 8.74e-01 | -0.059 |
| 29911 | HOOK2 | HTA11_546_2000001011 | Human | Colorectum | AD | 3.04e-03 | 5.97e-01 | -0.0842 |
| 29911 | HOOK2 | HTA11_866_3004761011 | Human | Colorectum | AD | 7.88e-20 | 7.05e-01 | 0.096 |
| 29911 | HOOK2 | HTA11_4255_2000001011 | Human | Colorectum | SER | 4.57e-02 | 6.36e-01 | 0.0446 |
| 29911 | HOOK2 | HTA11_8622_2000001021 | Human | Colorectum | SER | 3.72e-04 | 6.76e-01 | 0.0528 |
| 29911 | HOOK2 | HTA11_10623_2000001011 | Human | Colorectum | AD | 6.75e-03 | 5.69e-01 | -0.0177 |
| 29911 | HOOK2 | HTA11_10711_2000001011 | Human | Colorectum | AD | 2.35e-11 | 7.24e-01 | 0.0338 |
| 29911 | HOOK2 | HTA11_7696_3000711011 | Human | Colorectum | AD | 1.55e-26 | 9.64e-01 | 0.0674 |
| 29911 | HOOK2 | HTA11_6818_2000001011 | Human | Colorectum | AD | 4.93e-06 | 7.08e-01 | 0.0112 |
| 29911 | HOOK2 | HTA11_6818_2000001021 | Human | Colorectum | AD | 8.64e-09 | 6.81e-01 | 0.0588 |
| 29911 | HOOK2 | HTA11_99999970781_79442 | Human | Colorectum | MSS | 1.24e-18 | 9.62e-01 | 0.294 |
| Page: 1 2 3 4 5 6 7 8 9 10 |
| Tissue | Expression Dynamics | Abbreviation |
| Colorectum (GSE201348) |  | FAP: Familial adenomatous polyposis |
| CRC: Colorectal cancer | ||
| Colorectum (HTA11) |  | AD: Adenomas |
| SER: Sessile serrated lesions | ||
| MSI-H: Microsatellite-high colorectal cancer | ||
| MSS: Microsatellite stable colorectal cancer | ||
| Esophagus | 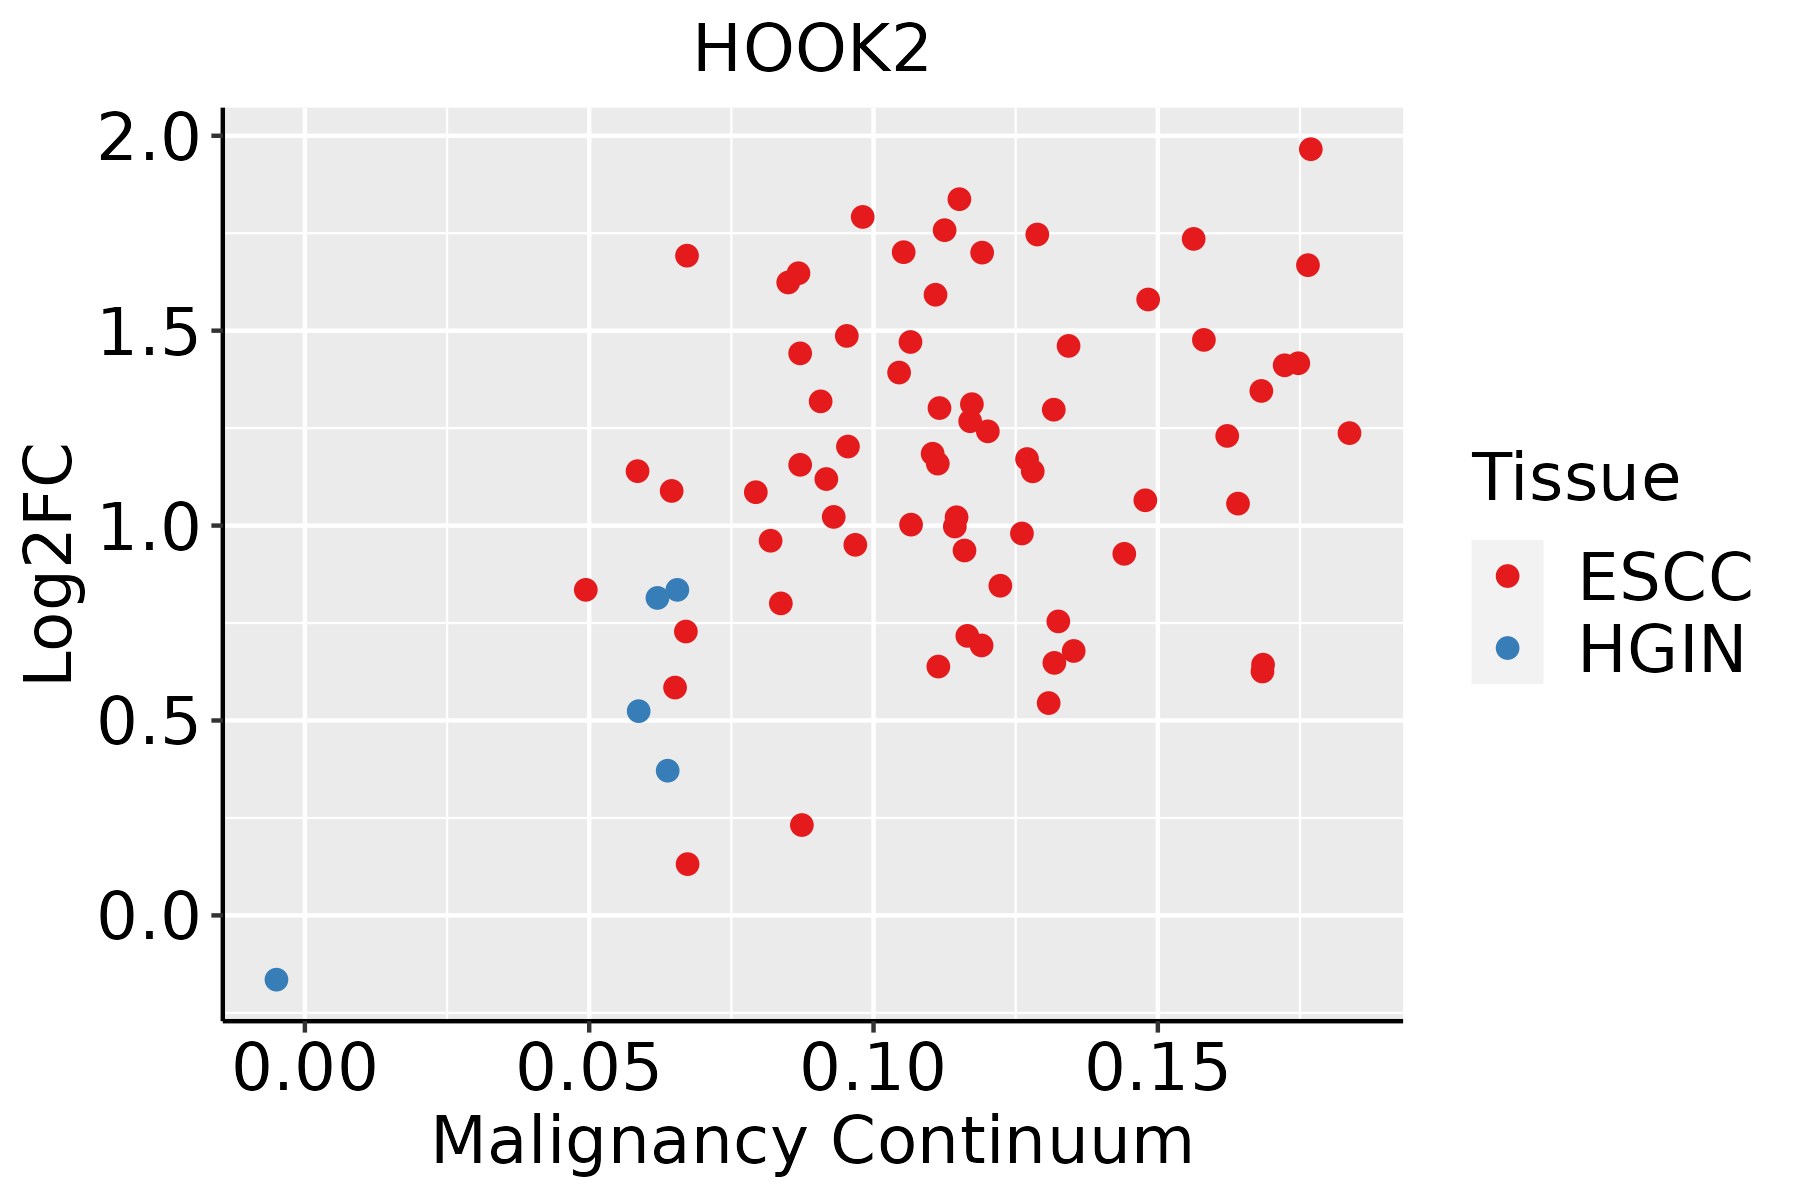 | ESCC: Esophageal squamous cell carcinoma |
| HGIN: High-grade intraepithelial neoplasias | ||
| LGIN: Low-grade intraepithelial neoplasias | ||
| GC | 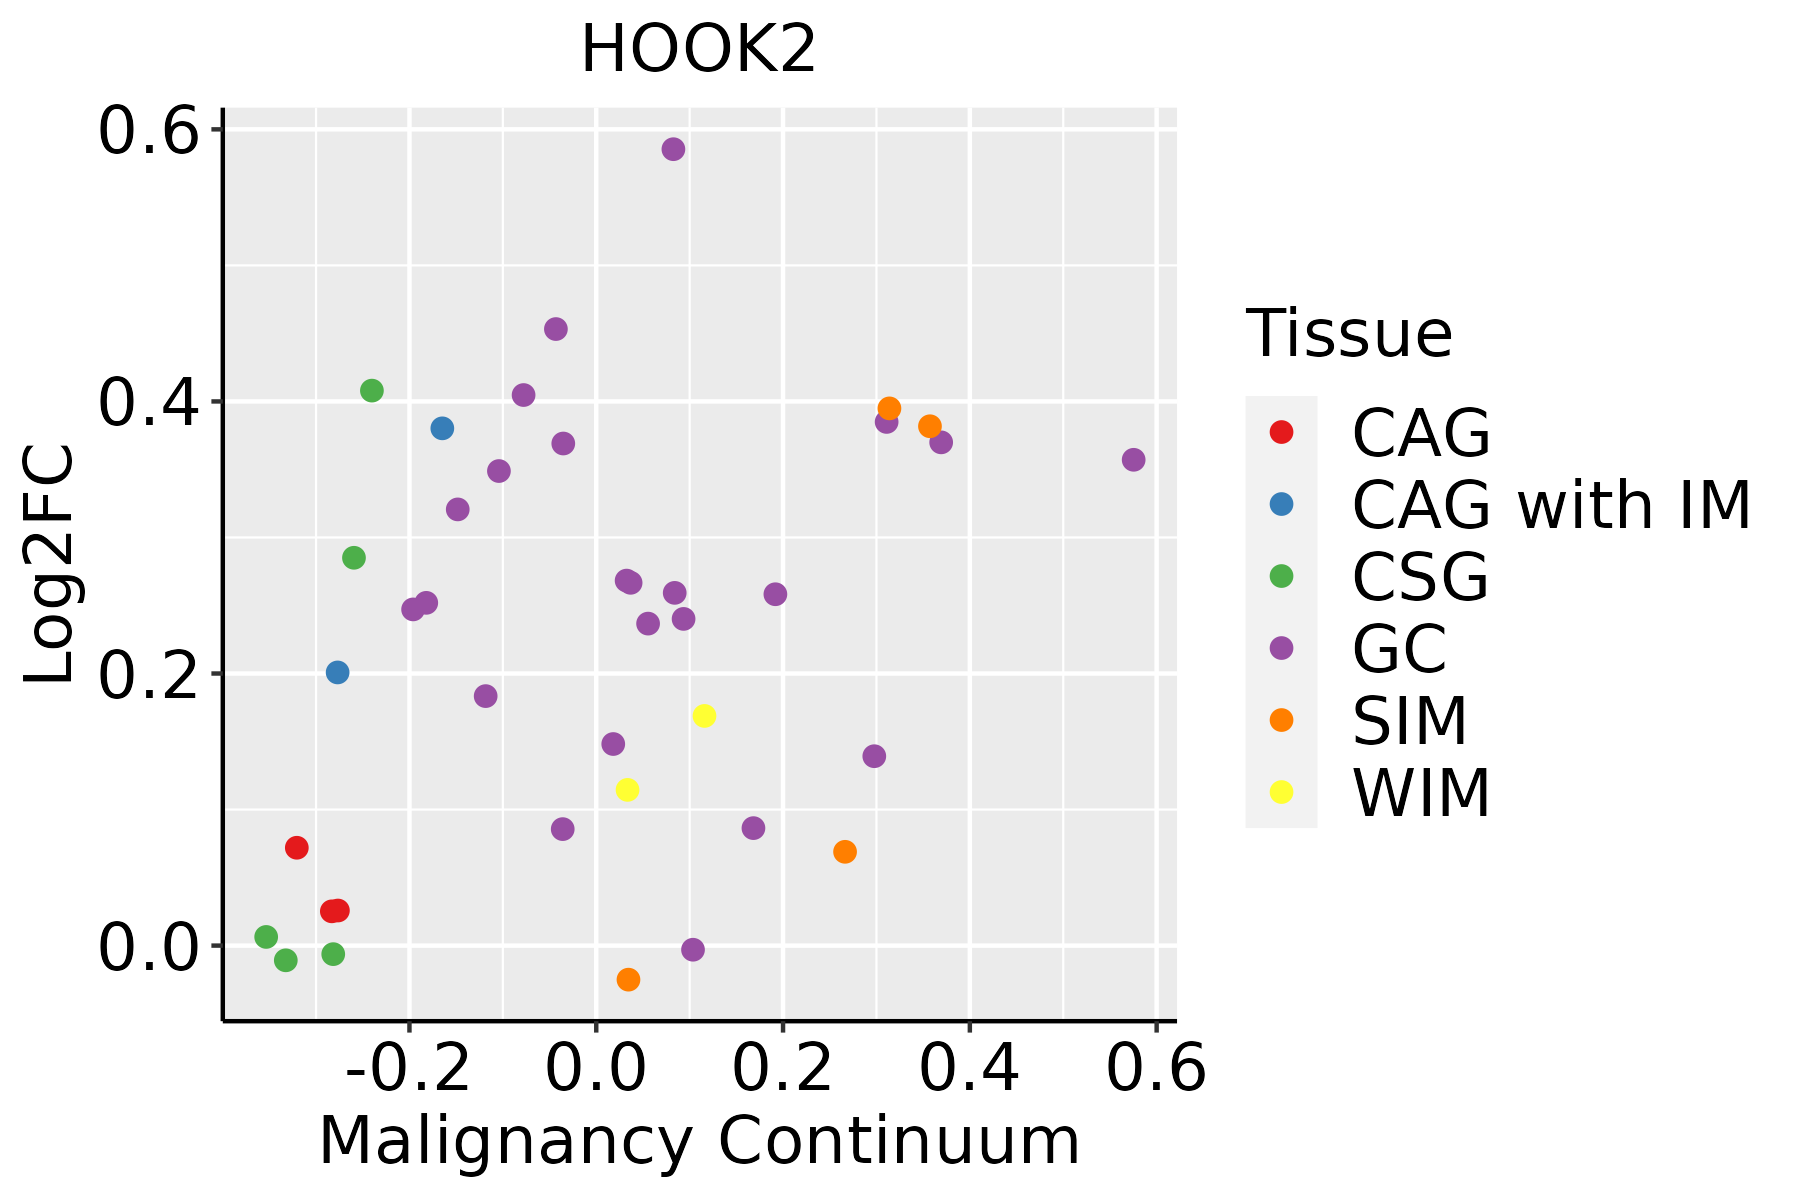 | CAG: Chronic atrophic gastritis |
| CAG with IM: Chronic atrophic gastritis with intestinal metaplasia | ||
| CSG: Chronic superficial gastritis | ||
| GC: Gastric cancer | ||
| SIM: Severe intestinal metaplasia | ||
| WIM: Wild intestinal metaplasia | ||
| Lung | 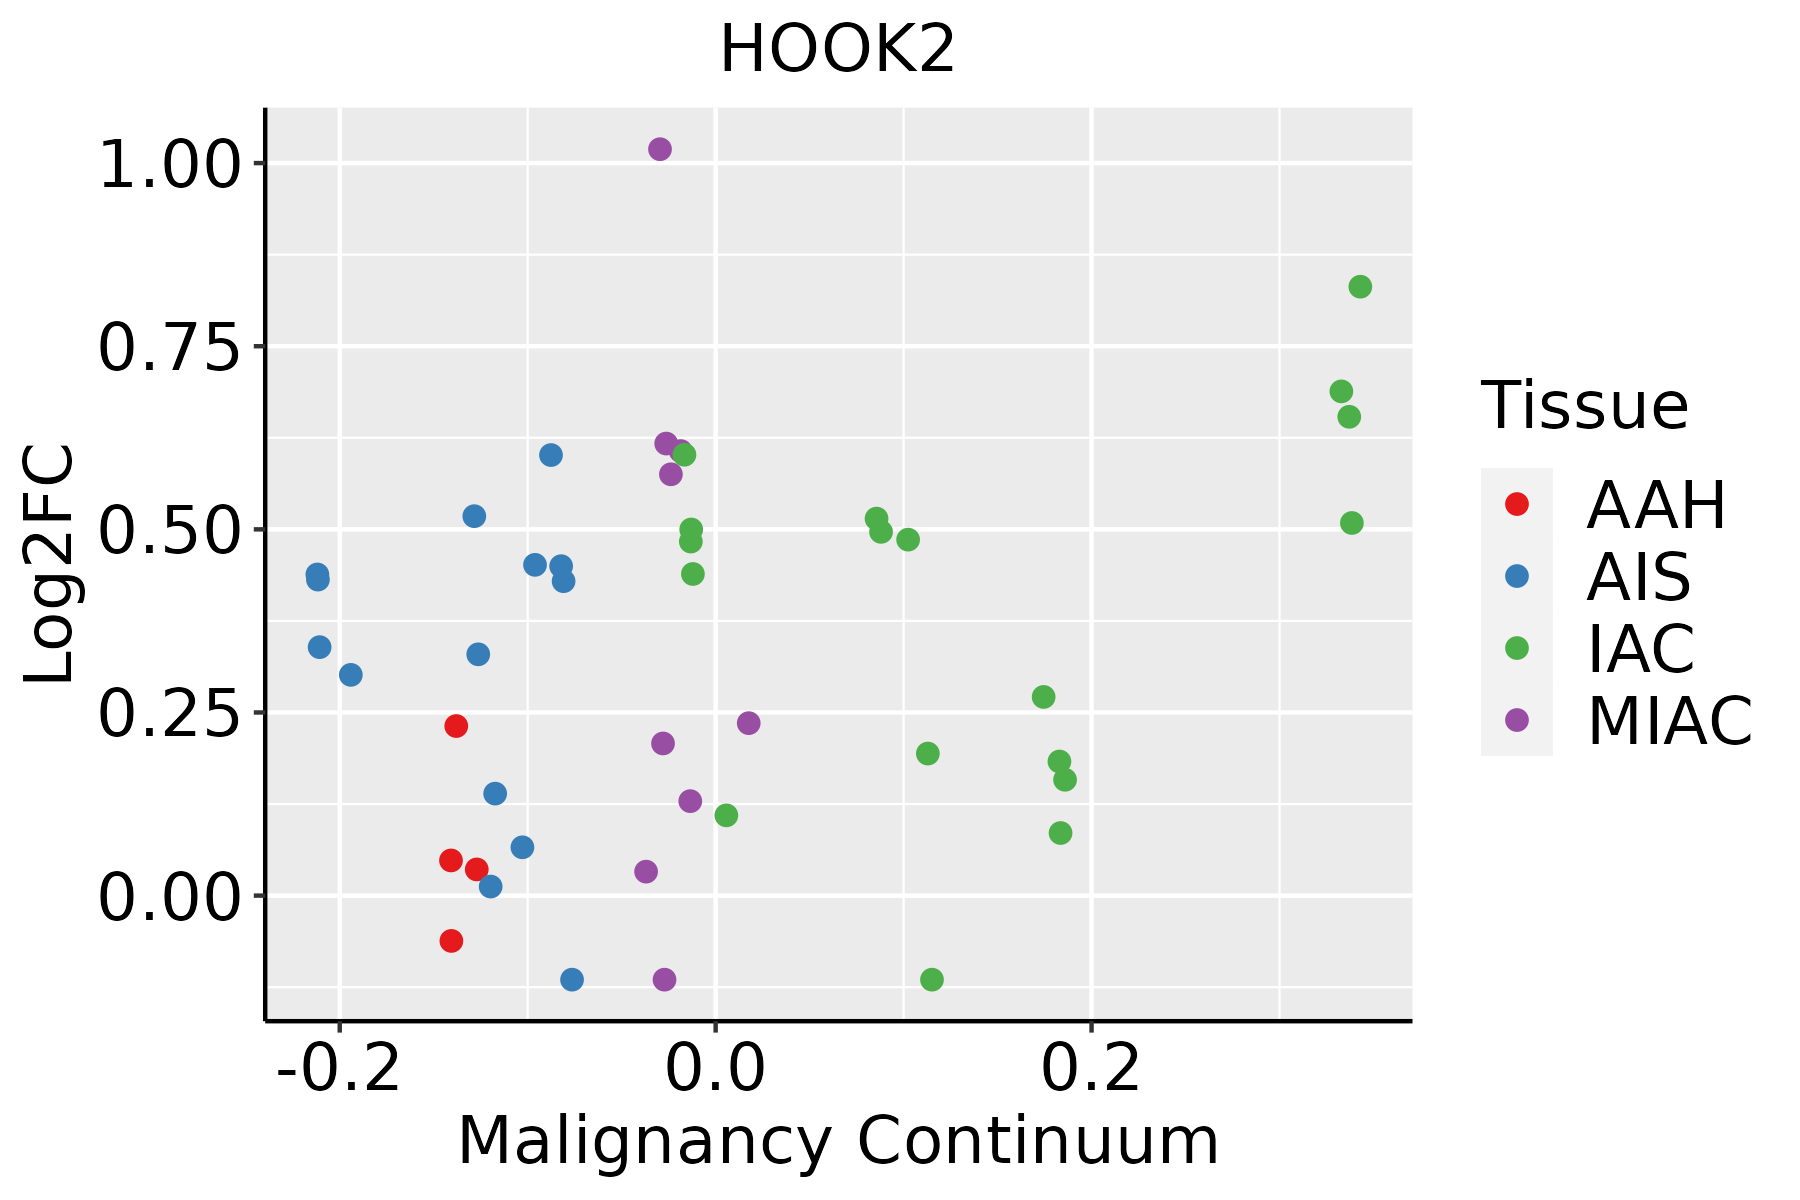 | AAH: Atypical adenomatous hyperplasia |
| AIS: Adenocarcinoma in situ | ||
| IAC: Invasive lung adenocarcinoma | ||
| MIA: Minimally invasive adenocarcinoma | ||
| Oral Cavity | 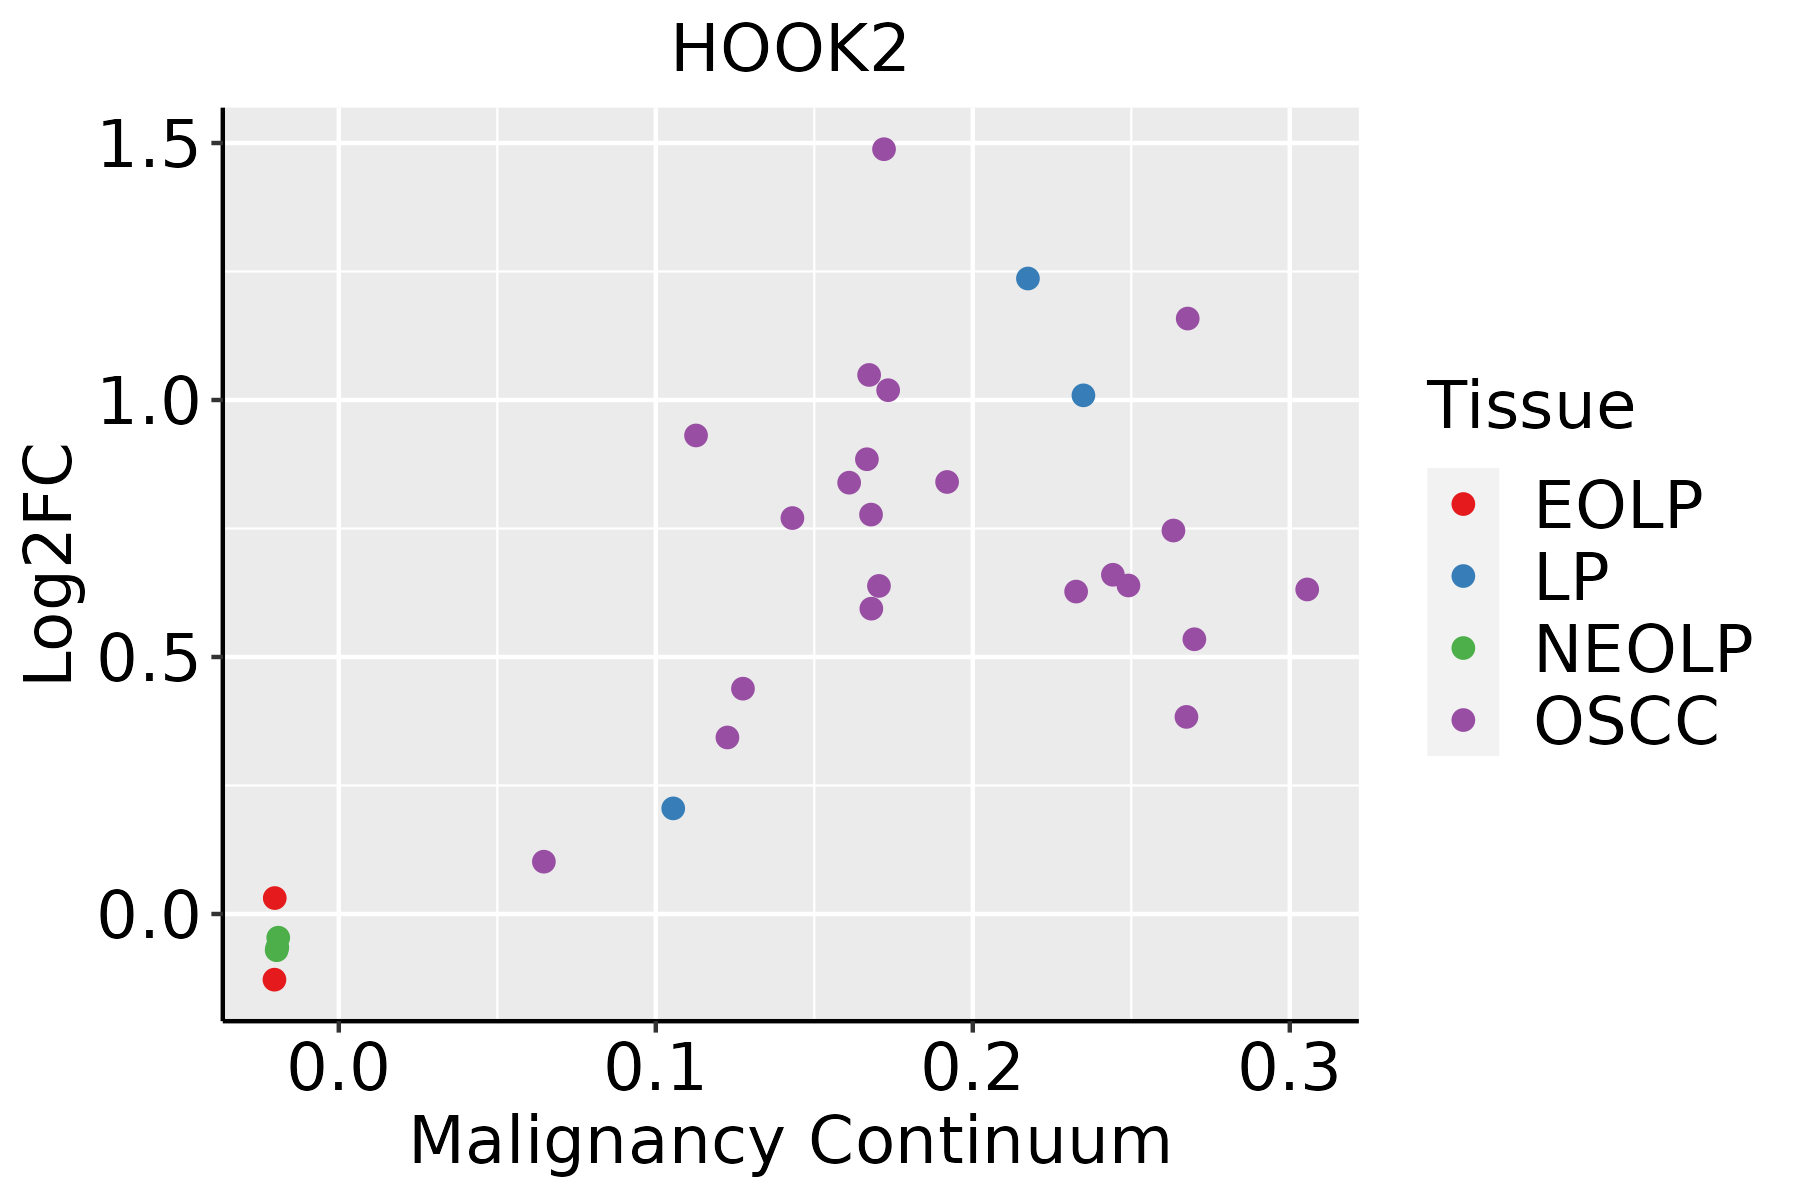 | EOLP: Erosive Oral lichen planus |
| LP: leukoplakia | ||
| NEOLP: Non-erosive oral lichen planus | ||
| OSCC: Oral squamous cell carcinoma | ||
| Prostate | 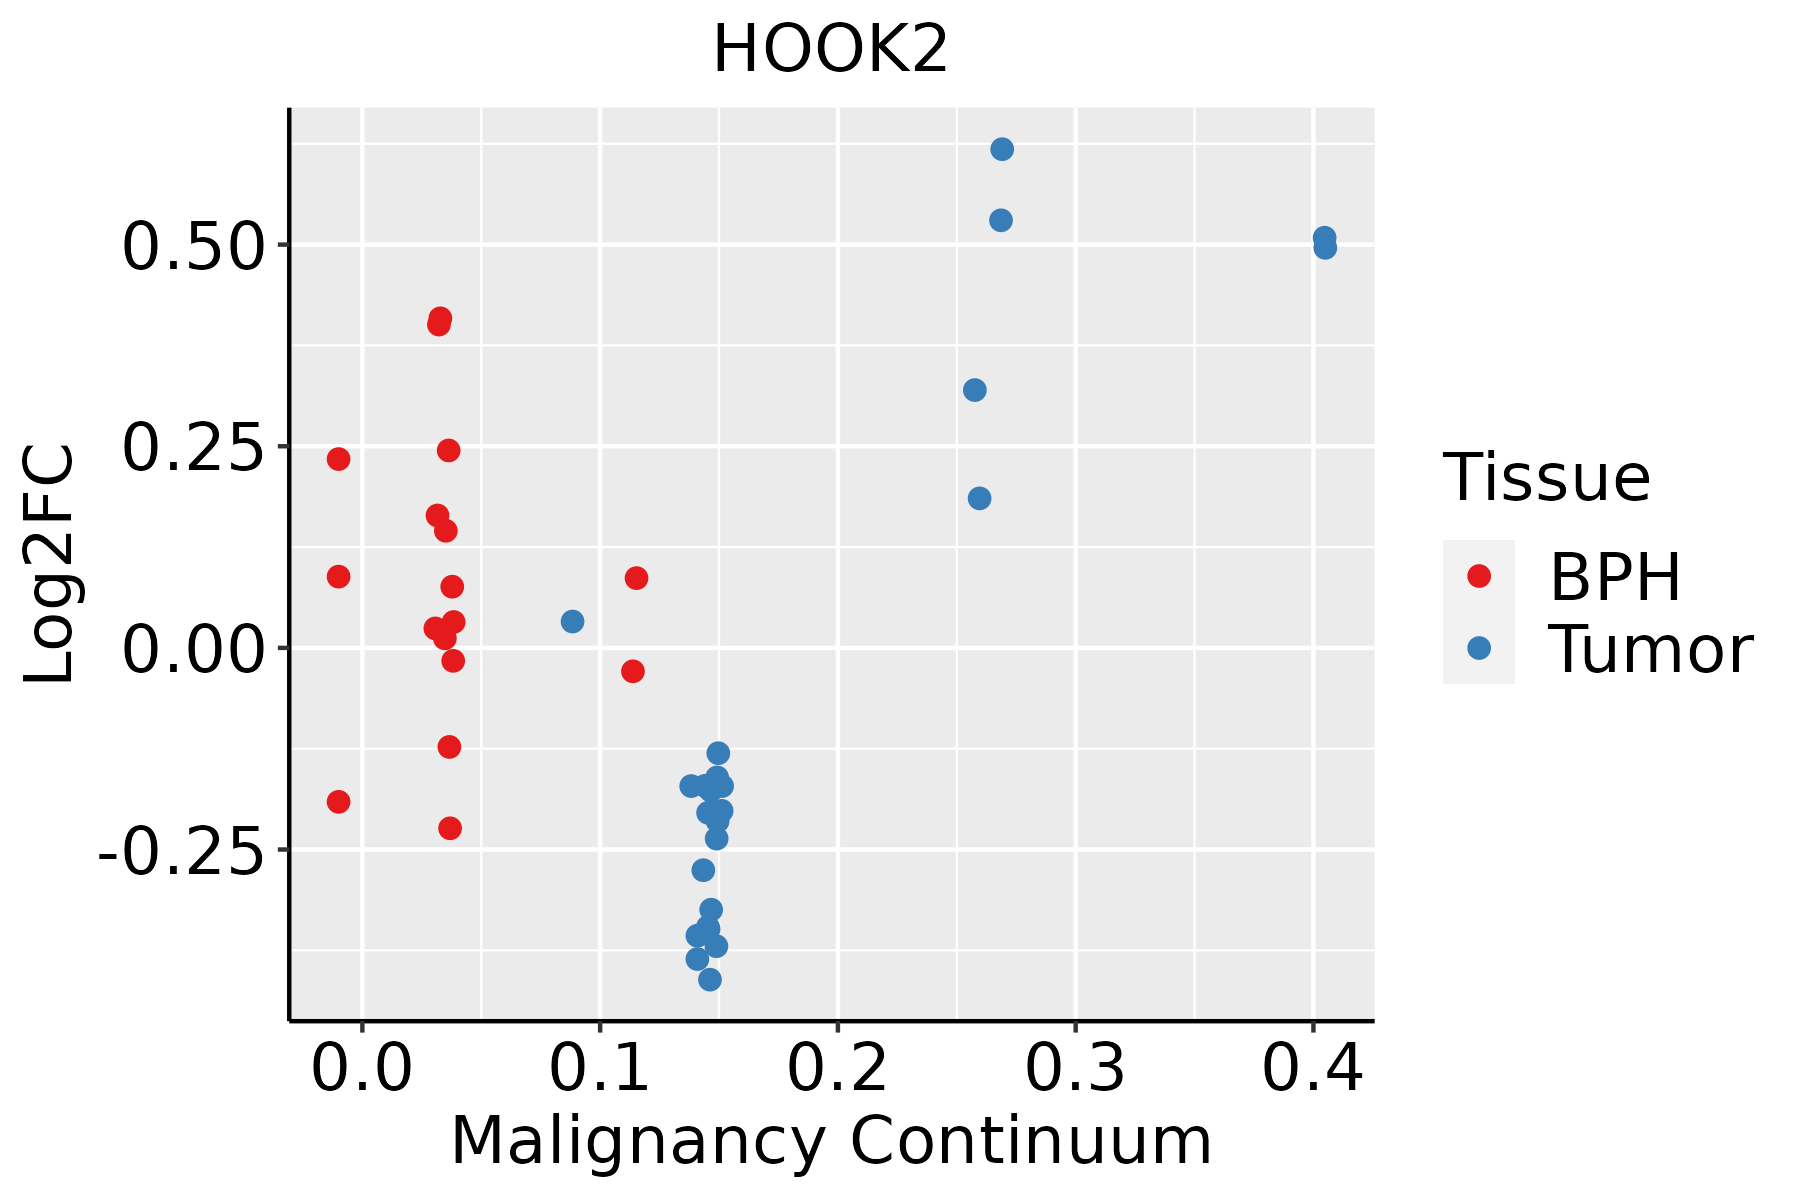 | BPH: Benign Prostatic Hyperplasia |
| Skin | 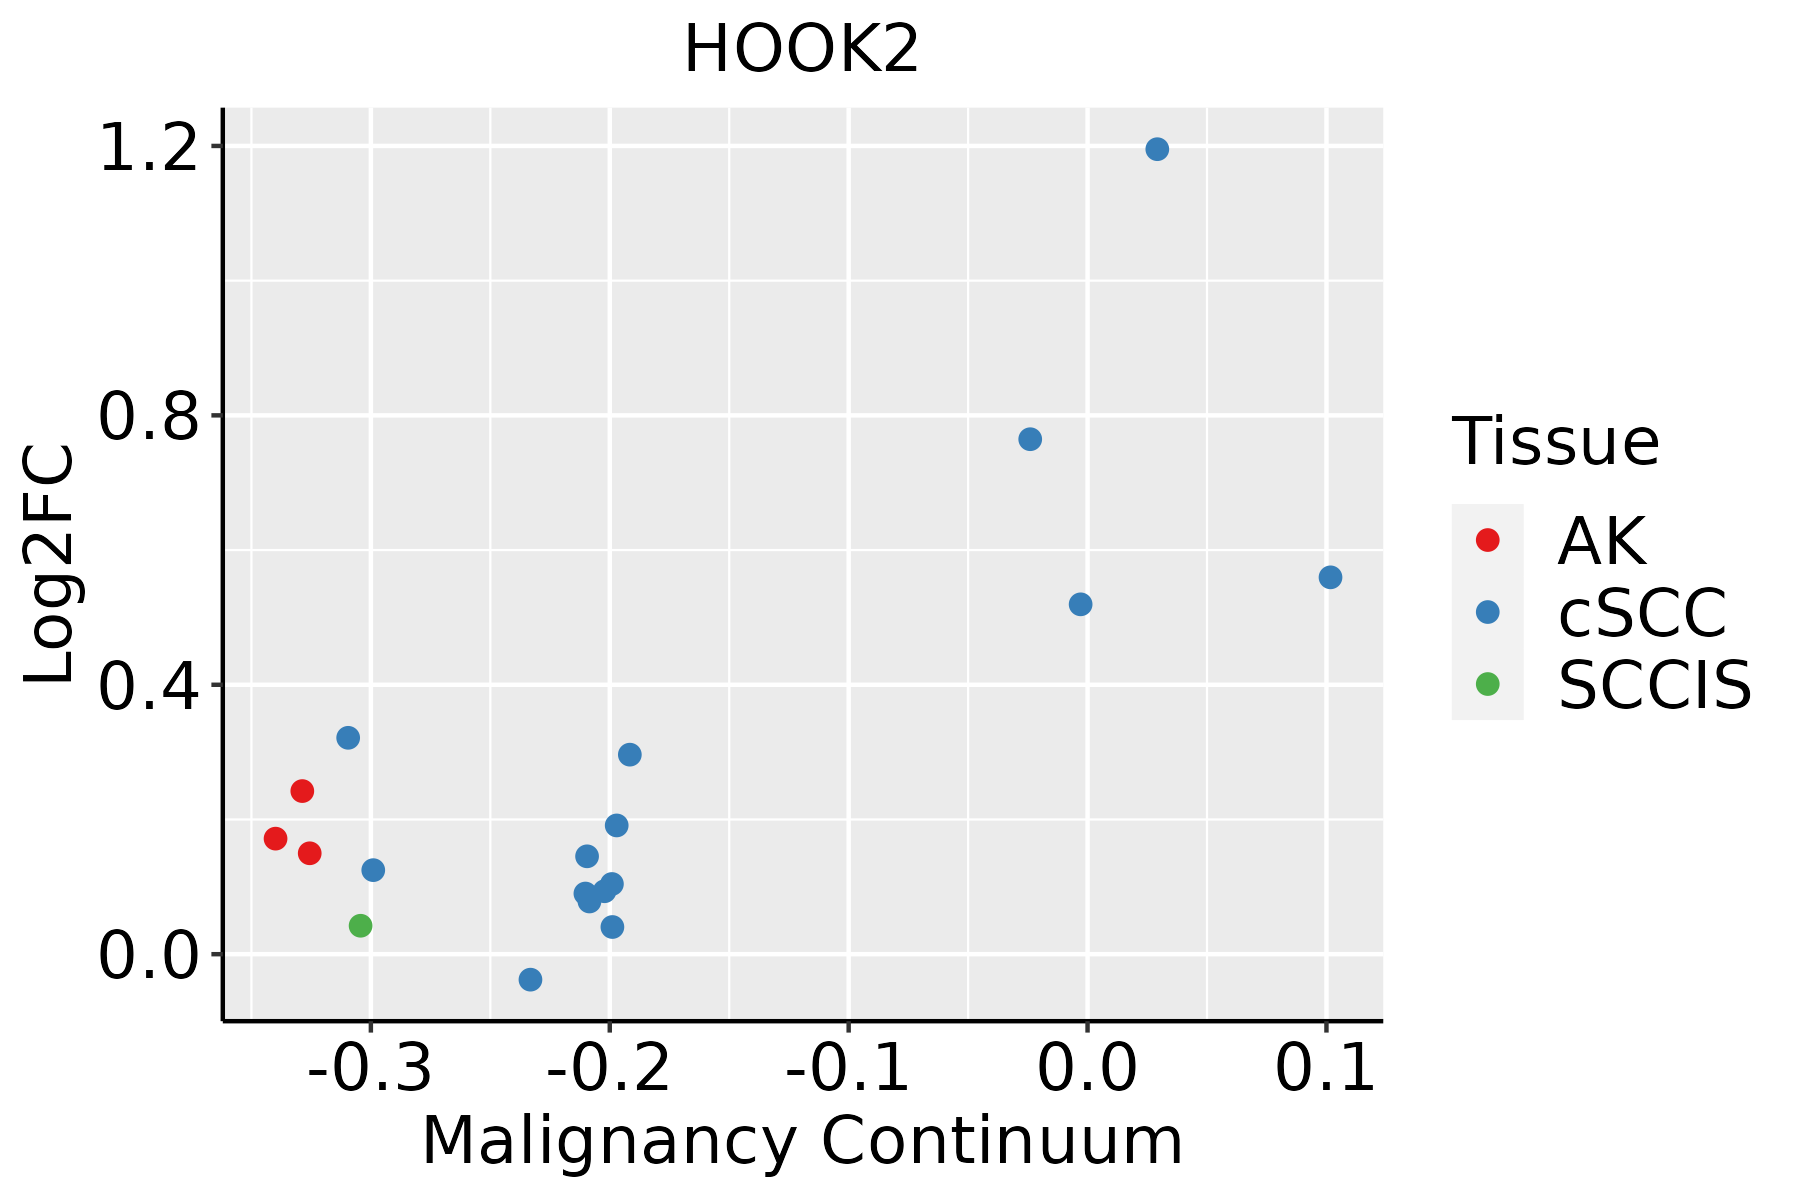 | AK: Actinic keratosis |
| cSCC: Cutaneous squamous cell carcinoma | ||
| SCCIS:squamous cell carcinoma in situ | ||
| Thyroid | 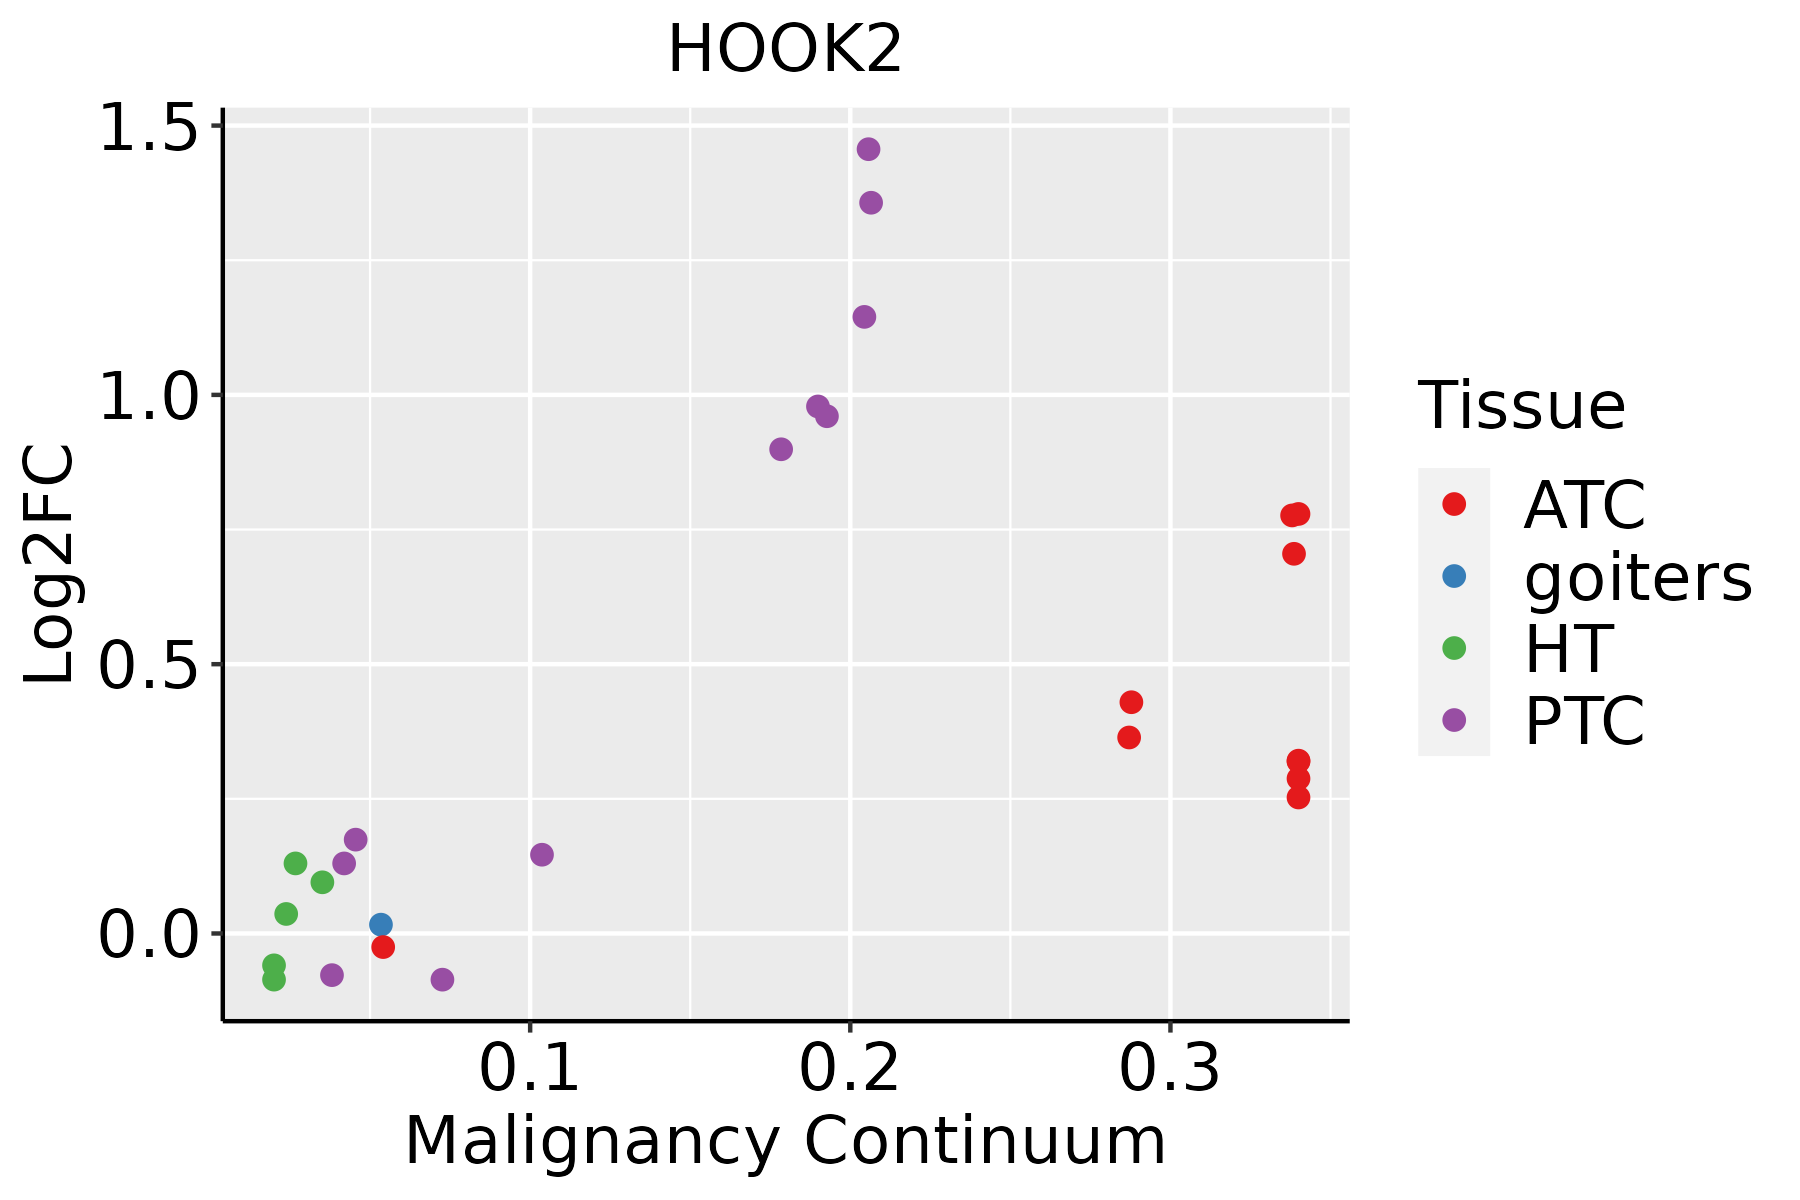 | ATC: Anaplastic thyroid cancer |
| HT: Hashimoto's thyroiditis | ||
| PTC: Papillary thyroid cancer |
| ∗log2FC in expression of this searched gene in stem-like cells from each diseased tissue sample relative to stem-like cells in normal samples in each tissue plotted against the malignancy continuum. Samples are colored based on if they are from different disease stage. |
Top |
Malignant transformation related pathway analysis |
| Find out the enriched GO biological processes and KEGG pathways involved in transition from healthy to precancer to cancer |
| Tissue | Disease Stage | Enriched GO biological Processes |
| Colorectum | AD |  |
| Colorectum | SER |  |
| Colorectum | MSS |  |
| Colorectum | MSI-H |  |
| Colorectum | FAP |  |
| ∗Top 15 enriched GO BP terms are showed in the bar plot of each disease state in each tissue. Each row represents a significant GO biological process which is colored according to the -log10(p.adjust). |
| Page: 1 2 3 4 5 6 7 8 9 |
| GO ID | Tissue | Disease Stage | Description | Gene Ratio | Bg Ratio | pvalue | p.adjust | Count |
| GO:0016482 | Colorectum | AD | cytosolic transport | 68/3918 | 168/18723 | 6.00e-09 | 3.72e-07 | 68 |
| GO:0016050 | Colorectum | AD | vesicle organization | 101/3918 | 300/18723 | 1.65e-07 | 7.17e-06 | 101 |
| GO:0007034 | Colorectum | AD | vacuolar transport | 60/3918 | 157/18723 | 4.97e-07 | 1.85e-05 | 60 |
| GO:0007032 | Colorectum | AD | endosome organization | 33/3918 | 82/18723 | 5.30e-05 | 9.01e-04 | 33 |
| GO:0007041 | Colorectum | AD | lysosomal transport | 42/3918 | 114/18723 | 6.61e-05 | 1.07e-03 | 42 |
| GO:0098927 | Colorectum | AD | vesicle-mediated transport between endosomal compartments | 19/3918 | 43/18723 | 5.03e-04 | 5.43e-03 | 19 |
| GO:0030705 | Colorectum | AD | cytoskeleton-dependent intracellular transport | 60/3918 | 195/18723 | 7.56e-04 | 7.59e-03 | 60 |
| GO:0045022 | Colorectum | AD | early endosome to late endosome transport | 17/3918 | 40/18723 | 1.66e-03 | 1.38e-02 | 17 |
| GO:0007033 | Colorectum | AD | vacuole organization | 53/3918 | 180/18723 | 4.18e-03 | 2.89e-02 | 53 |
| GO:00164821 | Colorectum | SER | cytosolic transport | 46/2897 | 168/18723 | 5.20e-05 | 1.25e-03 | 46 |
| GO:00070341 | Colorectum | SER | vacuolar transport | 43/2897 | 157/18723 | 8.92e-05 | 1.93e-03 | 43 |
| GO:00160501 | Colorectum | SER | vesicle organization | 69/2897 | 300/18723 | 3.59e-04 | 5.61e-03 | 69 |
| GO:00989271 | Colorectum | SER | vesicle-mediated transport between endosomal compartments | 16/2897 | 43/18723 | 4.18e-04 | 6.17e-03 | 16 |
| GO:00070321 | Colorectum | SER | endosome organization | 24/2897 | 82/18723 | 1.11e-03 | 1.28e-02 | 24 |
| GO:00450221 | Colorectum | SER | early endosome to late endosome transport | 14/2897 | 40/18723 | 1.88e-03 | 1.90e-02 | 14 |
| GO:00307051 | Colorectum | SER | cytoskeleton-dependent intracellular transport | 44/2897 | 195/18723 | 5.53e-03 | 4.09e-02 | 44 |
| GO:00160502 | Colorectum | MSS | vesicle organization | 93/3467 | 300/18723 | 1.04e-07 | 4.97e-06 | 93 |
| GO:00164822 | Colorectum | MSS | cytosolic transport | 59/3467 | 168/18723 | 2.29e-07 | 9.79e-06 | 59 |
| GO:00070342 | Colorectum | MSS | vacuolar transport | 52/3467 | 157/18723 | 8.25e-06 | 2.07e-04 | 52 |
| GO:00070411 | Colorectum | MSS | lysosomal transport | 36/3467 | 114/18723 | 5.38e-04 | 6.04e-03 | 36 |
| Page: 1 2 3 4 5 6 7 8 |
| Pathway ID | Tissue | Disease Stage | Description | Gene Ratio | Bg Ratio | pvalue | p.adjust | qvalue | Count |
| Page: 1 |
Top |
Cell-cell communication analysis |
| Identification of potential cell-cell interactions between two cell types and their ligand-receptor pairs for different disease states |
| Ligand | Receptor | LRpair | Pathway | Tissue | Disease Stage |
| Page: 1 |
Top |
Single-cell gene regulatory network inference analysis |
| Find out the significant the regulons (TFs) and the target genes of each regulon across cell types for different disease states |
| TF | Cell Type | Tissue | Disease Stage | Target Gene | RSS | Regulon Activity |
| ∗The dot plots of a searched regulon are shown for all cell subpopulations in each disease state of each tissue based on the regulon specific score inferred using pySCENIC and by calculating the average expression. |
| Page: 1 |
Top |
Somatic mutation of malignant transformation related genes |
| Annotation of somatic variants for genes involved in malignant transformation |
| Hugo Symbol | Variant Class | Variant Classification | dbSNP RS | HGVSc | HGVSp | HGVSp Short | SWISSPROT | BIOTYPE | SIFT | PolyPhen | Tumor Sample Barcode | Tissue | Histology | Sex | Age | Stage | Therapy Types | Drugs | Outcome |
| HOOK2 | SNV | Missense_Mutation | novel | c.2017G>T | p.Ala673Ser | p.A673S | Q96ED9 | protein_coding | tolerated(0.13) | probably_damaging(0.953) | TCGA-A7-A6VY-01 | Breast | breast invasive carcinoma | Female | <65 | I/II | Chemotherapy | cyclophosphamide | CR |
| HOOK2 | SNV | Missense_Mutation | novel | c.2016G>T | p.Met672Ile | p.M672I | Q96ED9 | protein_coding | deleterious(0.03) | benign(0.055) | TCGA-A7-A6VY-01 | Breast | breast invasive carcinoma | Female | <65 | I/II | Chemotherapy | cyclophosphamide | CR |
| HOOK2 | SNV | Missense_Mutation | rs750079184 | c.1283C>T | p.Pro428Leu | p.P428L | Q96ED9 | protein_coding | deleterious(0.02) | possibly_damaging(0.691) | TCGA-AO-A128-01 | Breast | breast invasive carcinoma | Female | <65 | I/II | Chemotherapy | doxorubicin | SD |
| HOOK2 | SNV | Missense_Mutation | rs560204067 | c.422C>T | p.Ser141Leu | p.S141L | Q96ED9 | protein_coding | deleterious(0.01) | probably_damaging(0.983) | TCGA-BH-A0W7-01 | Breast | breast invasive carcinoma | Female | <65 | I/II | Chemotherapy | taxotere | CR |
| HOOK2 | SNV | Missense_Mutation | c.151G>A | p.Glu51Lys | p.E51K | Q96ED9 | protein_coding | deleterious(0.04) | benign(0.374) | TCGA-C8-A12Q-01 | Breast | breast invasive carcinoma | Female | >=65 | III/IV | Unknown | Unknown | PD | |
| HOOK2 | SNV | Missense_Mutation | c.886G>A | p.Glu296Lys | p.E296K | Q96ED9 | protein_coding | deleterious(0) | probably_damaging(0.966) | TCGA-D8-A1J8-01 | Breast | breast invasive carcinoma | Female | >=65 | I/II | Hormone Therapy | nolvadex | SD | |
| HOOK2 | insertion | Frame_Shift_Ins | novel | c.1708_1709insATGG | p.Pro570HisfsTer4 | p.P570Hfs*4 | Q96ED9 | protein_coding | TCGA-A2-A0CU-01 | Breast | breast invasive carcinoma | Female | >=65 | I/II | Hormone Therapy | tamoxiphen | SD | ||
| HOOK2 | insertion | In_Frame_Ins | novel | c.1707_1708insGCCTGGGCTCCACCCACCCTGGCTTCCTCCAGCTCA | p.Pro569_Pro570insAlaTrpAlaProProThrLeuAlaSerSerSerSer | p.P569_P570insAWAPPTLASSSS | Q96ED9 | protein_coding | TCGA-A2-A0CU-01 | Breast | breast invasive carcinoma | Female | >=65 | I/II | Hormone Therapy | tamoxiphen | SD | ||
| HOOK2 | insertion | Nonsense_Mutation | novel | c.1870_1871insACCAATAGCAC | p.Ala624AspfsTer3 | p.A624Dfs*3 | Q96ED9 | protein_coding | TCGA-A8-A0A9-01 | Breast | breast invasive carcinoma | Female | >=65 | I/II | Hormone Therapy | anastrozole | SD | ||
| HOOK2 | SNV | Missense_Mutation | novel | c.1955N>T | p.Ser652Ile | p.S652I | Q96ED9 | protein_coding | tolerated(0.1) | possibly_damaging(0.506) | TCGA-2W-A8YY-01 | Cervix | cervical & endocervical cancer | Female | <65 | I/II | Chemotherapy | cisplatin | CR |
| Page: 1 2 3 4 5 6 7 |
Top |
Related drugs of malignant transformation related genes |
| Identification of chemicals and drugs interact with genes involved in malignant transfromation |
| (DGIdb 4.0) |
| Entrez ID | Symbol | Category | Interaction Types | Drug Claim Name | Drug Name | PMIDs |
| Page: 1 |

Copyright 2023-Present -The University of Texas Health Science Center at Houston |