
|
|||||
|
 | |
| |
| |
| |
| |
| |
|
Gene: HOOK1 |
Gene summary for HOOK1 |
| Gene information | Species | Human | Gene symbol | HOOK1 | Gene ID | 51361 |
| Gene name | hook microtubule tethering protein 1 | |
| Gene Alias | HK1 | |
| Cytomap | 1p32.1 | |
| Gene Type | protein-coding | GO ID | GO:0000003 | UniProtAcc | Q9UJC3 |
Top |
Malignant transformation analysis |
| Identification of the aberrant gene expression in precancerous and cancerous lesions by comparing the gene expression of stem-like cells in diseased tissues with normal stem cells |
| Entrez ID | Symbol | Replicates | Species | Organ | Tissue | Adj P-value | Log2FC | Malignancy |
| 51361 | HOOK1 | LZE4T | Human | Esophagus | ESCC | 3.49e-03 | -2.73e-02 | 0.0811 |
| 51361 | HOOK1 | LZE20T | Human | Esophagus | ESCC | 3.92e-06 | 1.23e-01 | 0.0662 |
| 51361 | HOOK1 | LZE24T | Human | Esophagus | ESCC | 1.91e-20 | 3.15e-01 | 0.0596 |
| 51361 | HOOK1 | P1T-E | Human | Esophagus | ESCC | 7.72e-07 | 2.78e-01 | 0.0875 |
| 51361 | HOOK1 | P2T-E | Human | Esophagus | ESCC | 4.13e-21 | 3.12e-01 | 0.1177 |
| 51361 | HOOK1 | P4T-E | Human | Esophagus | ESCC | 5.08e-11 | 2.18e-01 | 0.1323 |
| 51361 | HOOK1 | P5T-E | Human | Esophagus | ESCC | 7.93e-14 | 1.85e-01 | 0.1327 |
| 51361 | HOOK1 | P8T-E | Human | Esophagus | ESCC | 6.07e-15 | 1.91e-01 | 0.0889 |
| 51361 | HOOK1 | P9T-E | Human | Esophagus | ESCC | 4.16e-03 | -7.50e-02 | 0.1131 |
| 51361 | HOOK1 | P10T-E | Human | Esophagus | ESCC | 2.56e-02 | -4.17e-02 | 0.116 |
| 51361 | HOOK1 | P12T-E | Human | Esophagus | ESCC | 4.50e-15 | 4.16e-01 | 0.1122 |
| 51361 | HOOK1 | P15T-E | Human | Esophagus | ESCC | 6.93e-05 | 6.71e-02 | 0.1149 |
| 51361 | HOOK1 | P16T-E | Human | Esophagus | ESCC | 9.20e-10 | 3.81e-02 | 0.1153 |
| 51361 | HOOK1 | P20T-E | Human | Esophagus | ESCC | 4.30e-19 | 5.37e-01 | 0.1124 |
| 51361 | HOOK1 | P21T-E | Human | Esophagus | ESCC | 6.60e-03 | -9.40e-02 | 0.1617 |
| 51361 | HOOK1 | P22T-E | Human | Esophagus | ESCC | 2.65e-08 | -7.53e-02 | 0.1236 |
| 51361 | HOOK1 | P23T-E | Human | Esophagus | ESCC | 7.77e-17 | 4.13e-01 | 0.108 |
| 51361 | HOOK1 | P24T-E | Human | Esophagus | ESCC | 3.36e-07 | 3.87e-02 | 0.1287 |
| 51361 | HOOK1 | P26T-E | Human | Esophagus | ESCC | 5.17e-18 | 3.69e-01 | 0.1276 |
| 51361 | HOOK1 | P27T-E | Human | Esophagus | ESCC | 2.24e-42 | 9.96e-01 | 0.1055 |
| Page: 1 2 3 4 |
| Tissue | Expression Dynamics | Abbreviation |
| Esophagus | 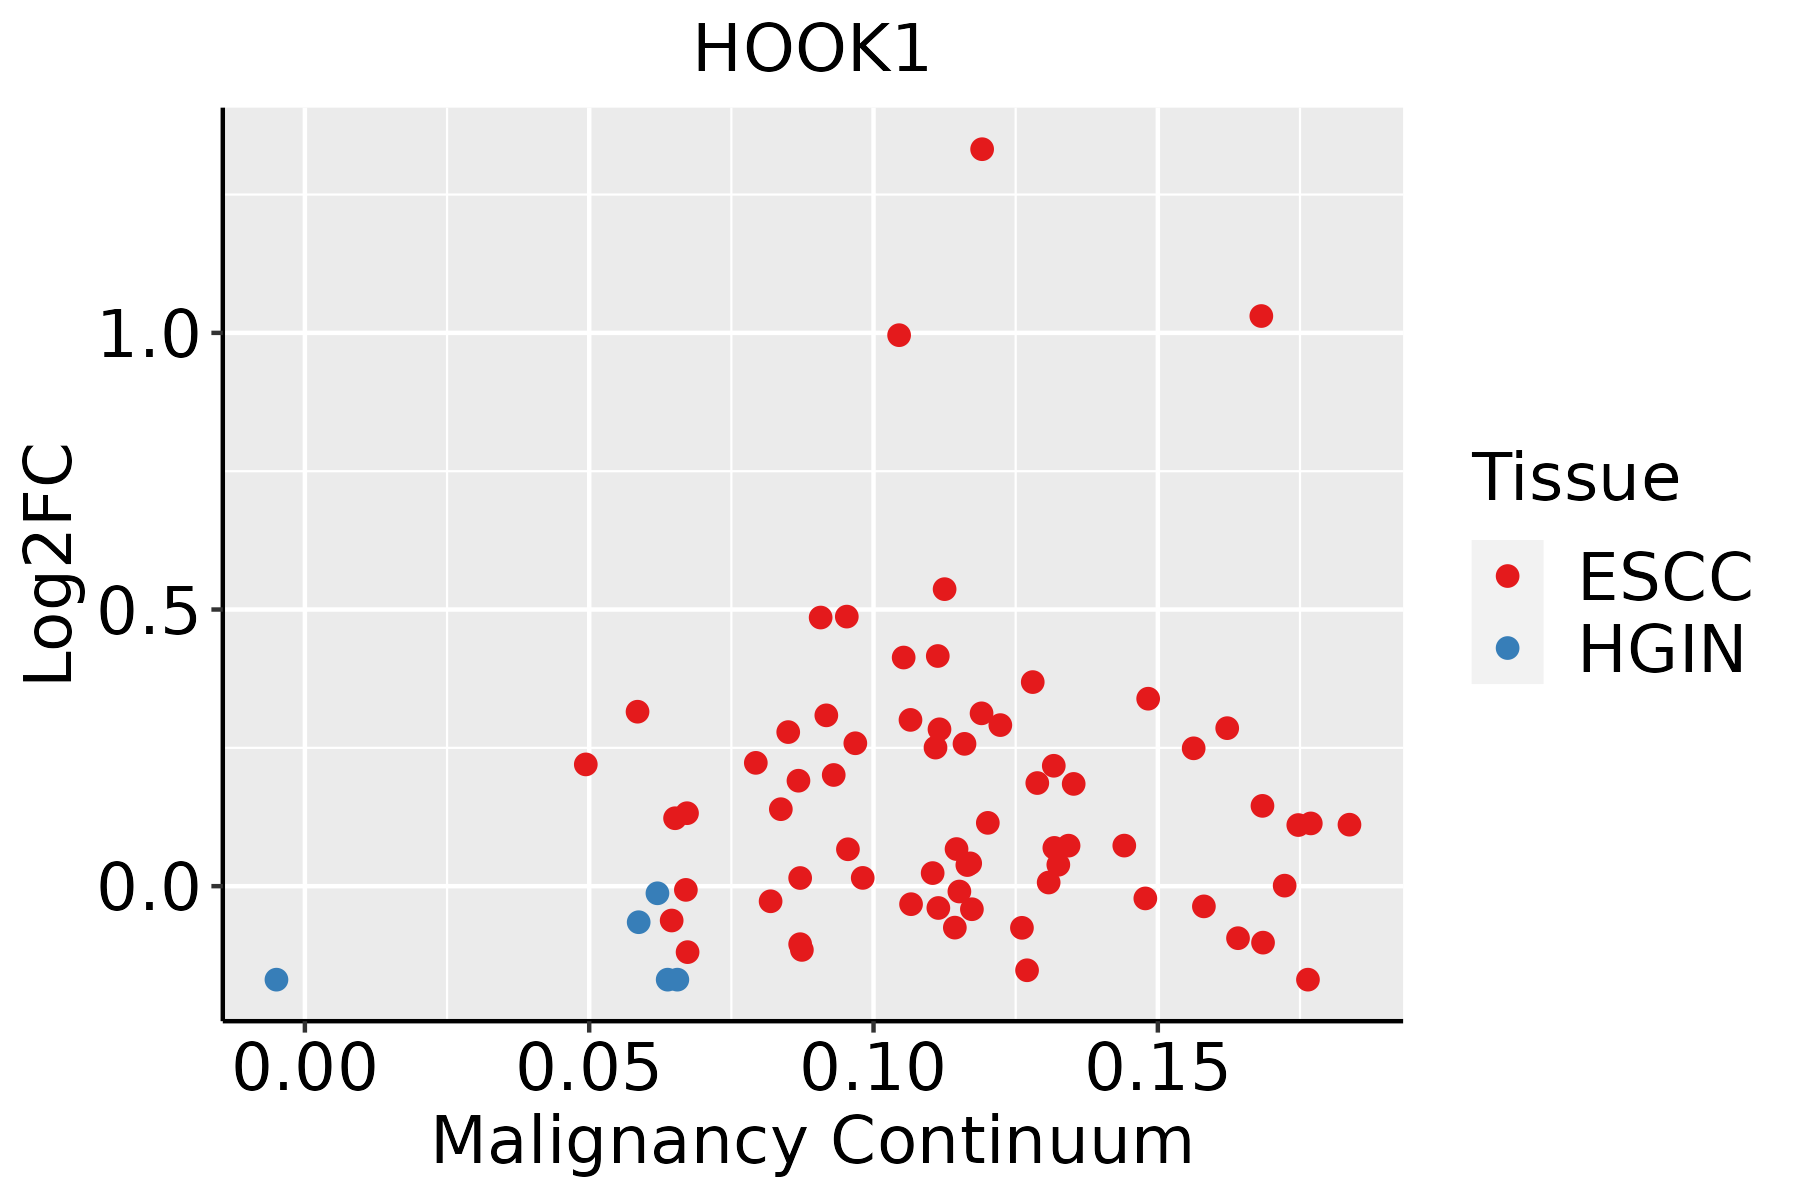 | ESCC: Esophageal squamous cell carcinoma |
| HGIN: High-grade intraepithelial neoplasias | ||
| LGIN: Low-grade intraepithelial neoplasias | ||
| Liver | 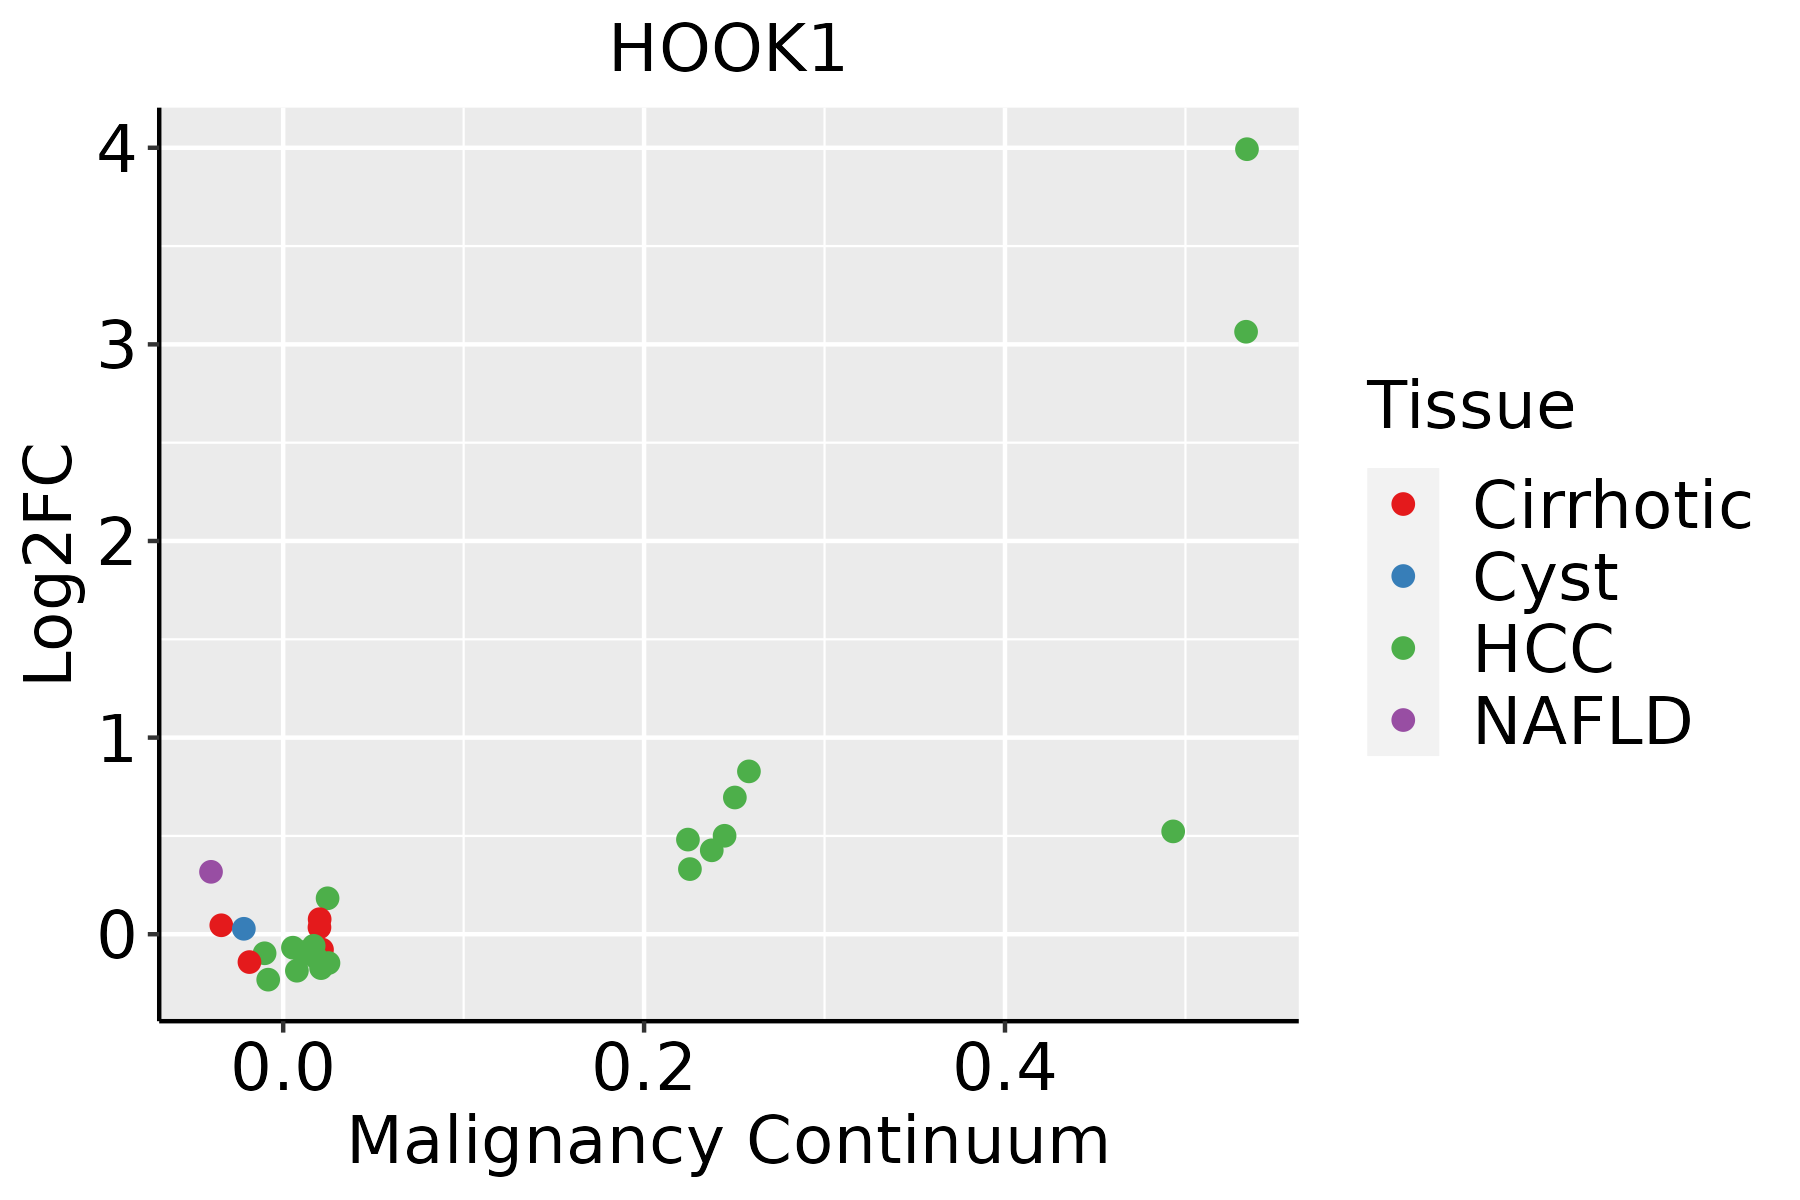 | HCC: Hepatocellular carcinoma |
| NAFLD: Non-alcoholic fatty liver disease | ||
| Oral Cavity | 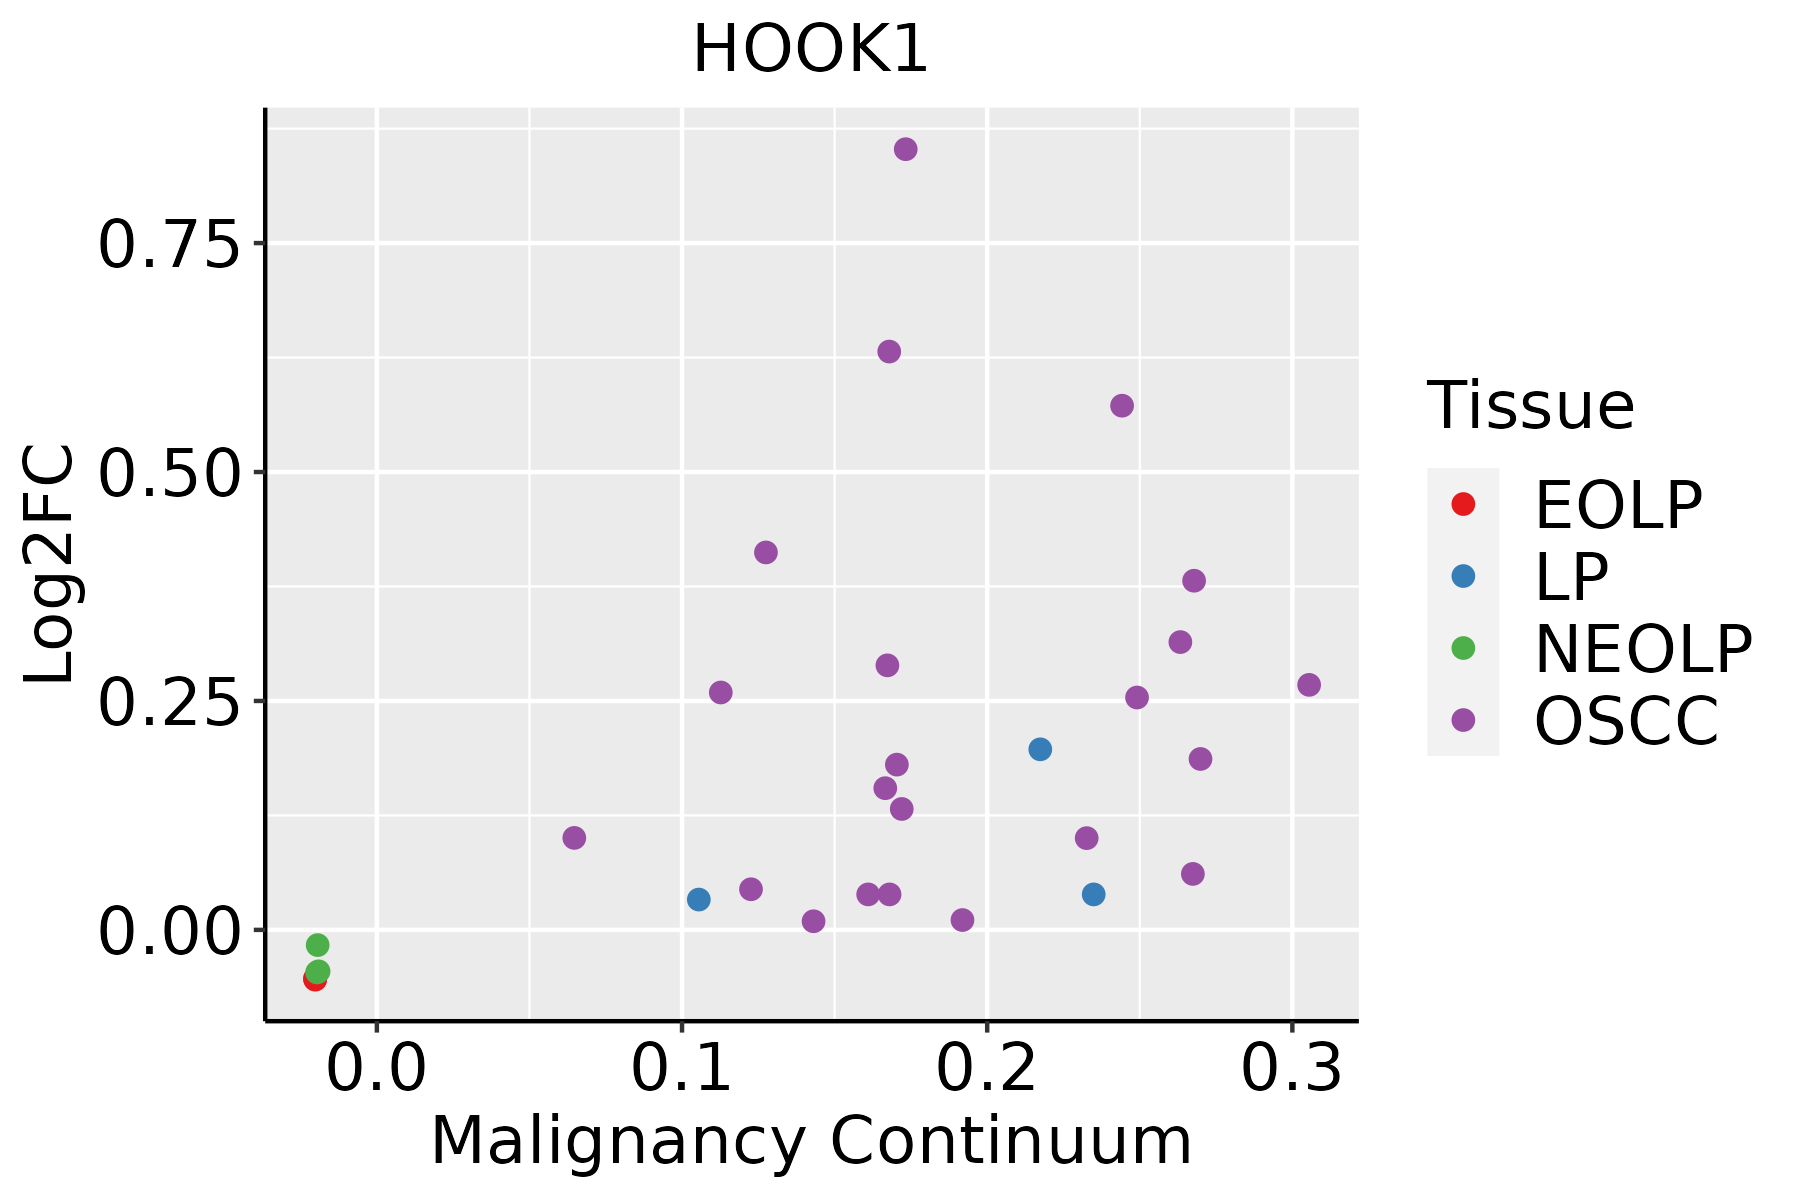 | EOLP: Erosive Oral lichen planus |
| LP: leukoplakia | ||
| NEOLP: Non-erosive oral lichen planus | ||
| OSCC: Oral squamous cell carcinoma | ||
| Thyroid | 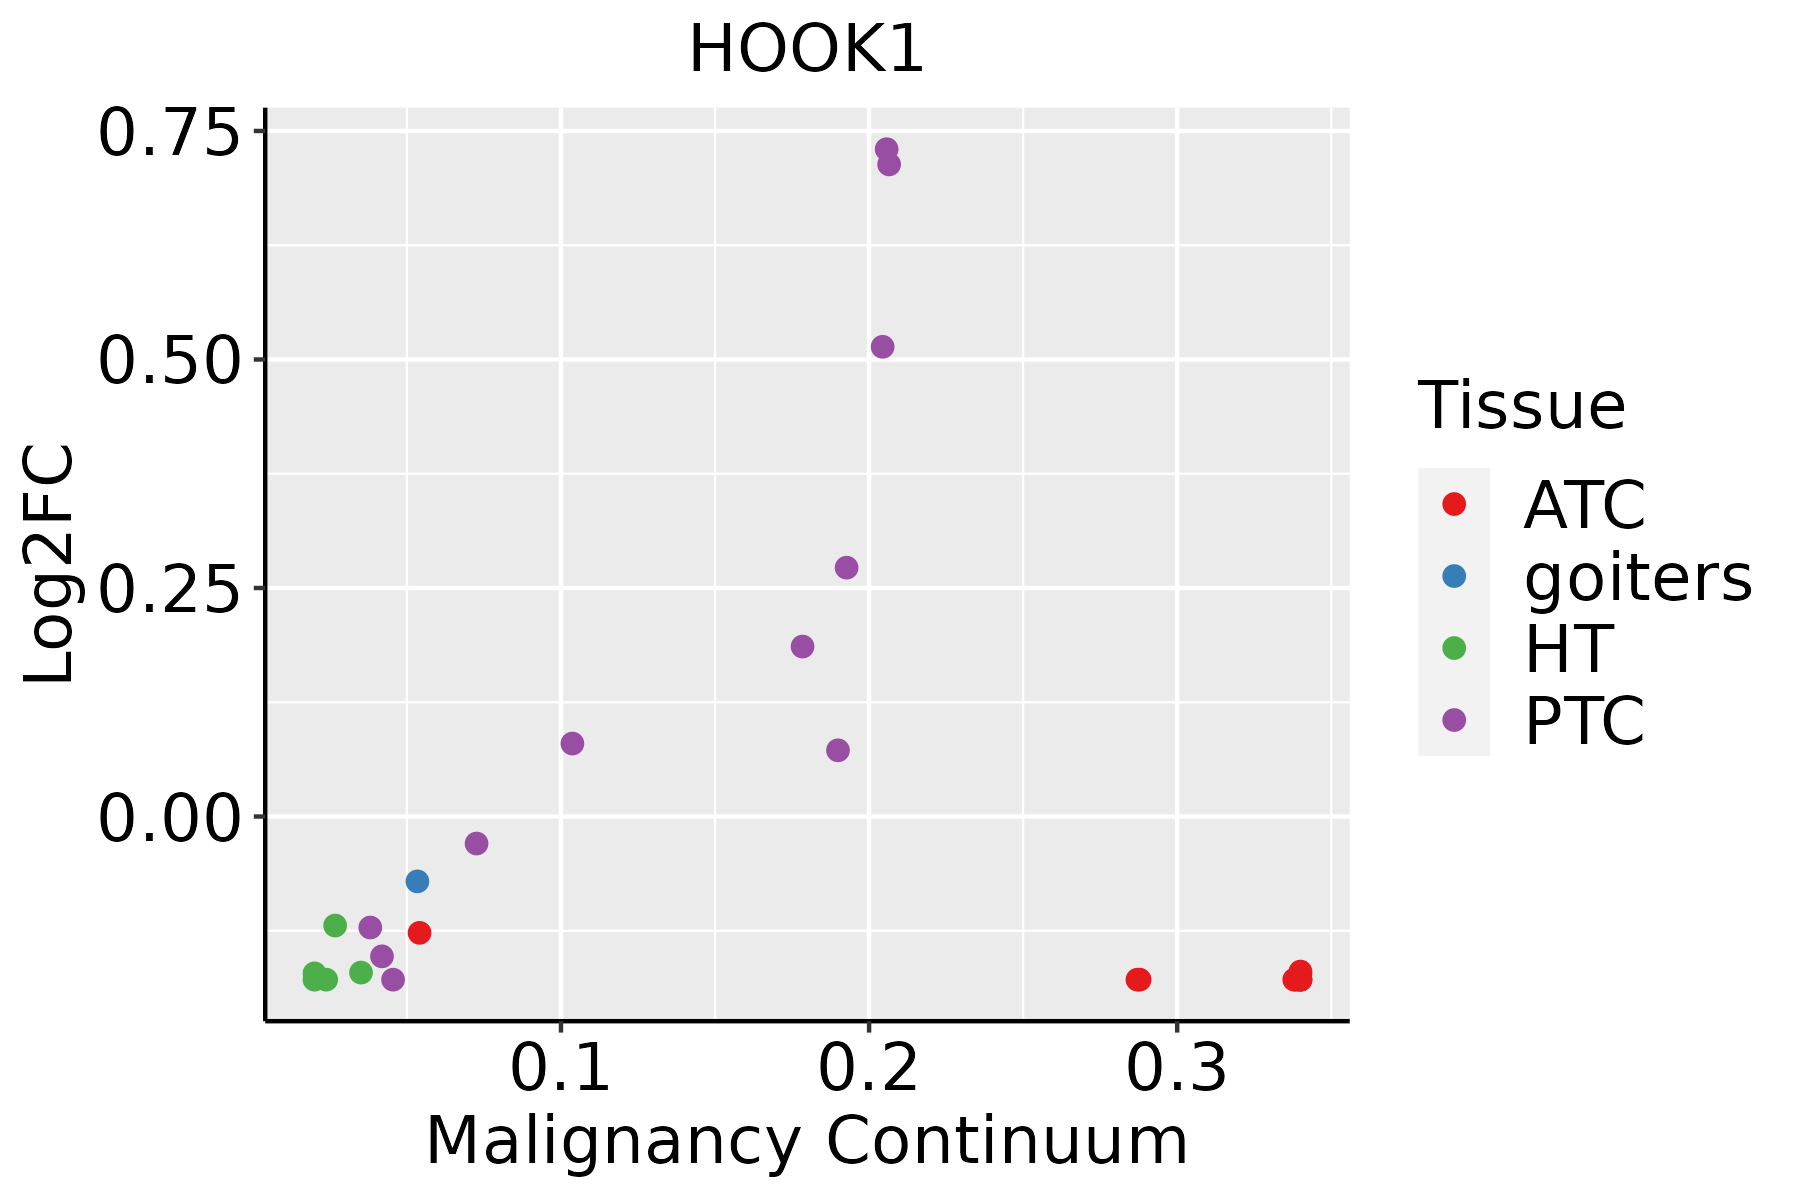 | ATC: Anaplastic thyroid cancer |
| HT: Hashimoto's thyroiditis | ||
| PTC: Papillary thyroid cancer |
| ∗log2FC in expression of this searched gene in stem-like cells from each diseased tissue sample relative to stem-like cells in normal samples in each tissue plotted against the malignancy continuum. Samples are colored based on if they are from different disease stage. |
Top |
Malignant transformation related pathway analysis |
| Find out the enriched GO biological processes and KEGG pathways involved in transition from healthy to precancer to cancer |
| Tissue | Disease Stage | Enriched GO biological Processes |
| Colorectum | AD |  |
| Colorectum | SER |  |
| Colorectum | MSS |  |
| Colorectum | MSI-H |  |
| Colorectum | FAP |  |
| ∗Top 15 enriched GO BP terms are showed in the bar plot of each disease state in each tissue. Each row represents a significant GO biological process which is colored according to the -log10(p.adjust). |
| Page: 1 2 3 4 5 6 7 8 9 |
| GO ID | Tissue | Disease Stage | Description | Gene Ratio | Bg Ratio | pvalue | p.adjust | Count |
| GO:001605014 | Esophagus | ESCC | vesicle organization | 211/8552 | 300/18723 | 2.85e-18 | 2.87e-16 | 211 |
| GO:000703417 | Esophagus | ESCC | vacuolar transport | 119/8552 | 157/18723 | 1.16e-14 | 6.30e-13 | 119 |
| GO:001648210 | Esophagus | ESCC | cytosolic transport | 124/8552 | 168/18723 | 9.69e-14 | 4.69e-12 | 124 |
| GO:000703314 | Esophagus | ESCC | vacuole organization | 127/8552 | 180/18723 | 1.04e-11 | 3.85e-10 | 127 |
| GO:003070518 | Esophagus | ESCC | cytoskeleton-dependent intracellular transport | 133/8552 | 195/18723 | 1.48e-10 | 4.27e-09 | 133 |
| GO:00070419 | Esophagus | ESCC | lysosomal transport | 83/8552 | 114/18723 | 3.52e-09 | 7.41e-08 | 83 |
| GO:000703214 | Esophagus | ESCC | endosome organization | 61/8552 | 82/18723 | 1.13e-07 | 1.85e-06 | 61 |
| GO:00989278 | Esophagus | ESCC | vesicle-mediated transport between endosomal compartments | 36/8552 | 43/18723 | 2.90e-07 | 4.20e-06 | 36 |
| GO:00070308 | Esophagus | ESCC | Golgi organization | 101/8552 | 157/18723 | 1.78e-06 | 2.10e-05 | 101 |
| GO:00450226 | Esophagus | ESCC | early endosome to late endosome transport | 33/8552 | 40/18723 | 1.80e-06 | 2.11e-05 | 33 |
| GO:00070403 | Esophagus | ESCC | lysosome organization | 53/8552 | 74/18723 | 5.34e-06 | 5.57e-05 | 53 |
| GO:00801713 | Esophagus | ESCC | lytic vacuole organization | 53/8552 | 74/18723 | 5.34e-06 | 5.57e-05 | 53 |
| GO:00083333 | Esophagus | ESCC | endosome to lysosome transport | 40/8552 | 55/18723 | 4.27e-05 | 3.42e-04 | 40 |
| GO:00311227 | Esophagus | ESCC | cytoplasmic microtubule organization | 38/8552 | 56/18723 | 6.60e-04 | 3.50e-03 | 38 |
| GO:001605011 | Liver | Cirrhotic | vesicle organization | 133/4634 | 300/18723 | 7.35e-14 | 6.41e-12 | 133 |
| GO:000703411 | Liver | Cirrhotic | vacuolar transport | 75/4634 | 157/18723 | 3.13e-10 | 1.53e-08 | 75 |
| GO:00070332 | Liver | Cirrhotic | vacuole organization | 80/4634 | 180/18723 | 5.73e-09 | 2.25e-07 | 80 |
| GO:001648211 | Liver | Cirrhotic | cytosolic transport | 74/4634 | 168/18723 | 3.34e-08 | 1.12e-06 | 74 |
| GO:00070301 | Liver | Cirrhotic | Golgi organization | 68/4634 | 157/18723 | 2.57e-07 | 6.41e-06 | 68 |
| GO:00070325 | Liver | Cirrhotic | endosome organization | 41/4634 | 82/18723 | 6.91e-07 | 1.47e-05 | 41 |
| Page: 1 2 3 4 5 |
| Pathway ID | Tissue | Disease Stage | Description | Gene Ratio | Bg Ratio | pvalue | p.adjust | qvalue | Count |
| Page: 1 |
Top |
Cell-cell communication analysis |
| Identification of potential cell-cell interactions between two cell types and their ligand-receptor pairs for different disease states |
| Ligand | Receptor | LRpair | Pathway | Tissue | Disease Stage |
| Page: 1 |
Top |
Single-cell gene regulatory network inference analysis |
| Find out the significant the regulons (TFs) and the target genes of each regulon across cell types for different disease states |
| TF | Cell Type | Tissue | Disease Stage | Target Gene | RSS | Regulon Activity |
| ∗The dot plots of a searched regulon are shown for all cell subpopulations in each disease state of each tissue based on the regulon specific score inferred using pySCENIC and by calculating the average expression. |
| Page: 1 |
Top |
Somatic mutation of malignant transformation related genes |
| Annotation of somatic variants for genes involved in malignant transformation |
| Hugo Symbol | Variant Class | Variant Classification | dbSNP RS | HGVSc | HGVSp | HGVSp Short | SWISSPROT | BIOTYPE | SIFT | PolyPhen | Tumor Sample Barcode | Tissue | Histology | Sex | Age | Stage | Therapy Types | Drugs | Outcome |
| HOOK1 | SNV | Missense_Mutation | novel | c.436N>A | p.Glu146Lys | p.E146K | Q9UJC3 | protein_coding | deleterious(0) | probably_damaging(1) | TCGA-5L-AAT0-01 | Breast | breast invasive carcinoma | Female | <65 | I/II | Hormone Therapy | tamoxiphen | SD |
| HOOK1 | SNV | Missense_Mutation | novel | c.97G>T | p.Asp33Tyr | p.D33Y | Q9UJC3 | protein_coding | deleterious(0) | possibly_damaging(0.616) | TCGA-AN-A046-01 | Breast | breast invasive carcinoma | Female | >=65 | I/II | Unknown | Unknown | SD |
| HOOK1 | SNV | Missense_Mutation | rs367708992 | c.850G>A | p.Glu284Lys | p.E284K | Q9UJC3 | protein_coding | deleterious(0) | probably_damaging(0.975) | TCGA-AN-A046-01 | Breast | breast invasive carcinoma | Female | >=65 | I/II | Unknown | Unknown | SD |
| HOOK1 | SNV | Missense_Mutation | c.1261G>C | p.Asp421His | p.D421H | Q9UJC3 | protein_coding | deleterious(0.02) | possibly_damaging(0.795) | TCGA-B6-A0IK-01 | Breast | breast invasive carcinoma | Female | <65 | III/IV | Unknown | Unknown | PD | |
| HOOK1 | SNV | Missense_Mutation | c.1951N>A | p.Glu651Lys | p.E651K | Q9UJC3 | protein_coding | deleterious(0.01) | possibly_damaging(0.826) | TCGA-BH-A0DZ-01 | Breast | breast invasive carcinoma | Female | <65 | I/II | Chemotherapy | docetaxel | SD | |
| HOOK1 | SNV | Missense_Mutation | rs746529091 | c.1621N>A | p.Glu541Lys | p.E541K | Q9UJC3 | protein_coding | tolerated(0.25) | benign(0.167) | TCGA-BH-A0H7-01 | Breast | breast invasive carcinoma | Female | >=65 | III/IV | Chemotherapy | doxorubicin | SD |
| HOOK1 | SNV | Missense_Mutation | c.213N>C | p.Trp71Cys | p.W71C | Q9UJC3 | protein_coding | deleterious(0.02) | benign(0.146) | TCGA-C8-A1HJ-01 | Breast | breast invasive carcinoma | Female | <65 | I/II | Unknown | Unknown | SD | |
| HOOK1 | SNV | Missense_Mutation | c.598A>G | p.Arg200Gly | p.R200G | Q9UJC3 | protein_coding | deleterious(0) | probably_damaging(0.978) | TCGA-EW-A1PH-01 | Breast | breast invasive carcinoma | Female | <65 | I/II | Chemotherapy | cyclophosphamide | SD | |
| HOOK1 | SNV | Missense_Mutation | novel | c.868N>C | p.Asp290His | p.D290H | Q9UJC3 | protein_coding | deleterious(0.04) | benign(0.178) | TCGA-C5-A1MH-01 | Cervix | cervical & endocervical cancer | Female | >=65 | III/IV | Chemotherapy | cisplatin | PD |
| HOOK1 | SNV | Missense_Mutation | rs370424578 | c.2105N>A | p.Arg702Gln | p.R702Q | Q9UJC3 | protein_coding | tolerated(1) | benign(0.021) | TCGA-C5-A905-01 | Cervix | cervical & endocervical cancer | Female | <65 | I/II | Unknown | Unknown | SD |
| Page: 1 2 3 4 5 6 7 8 9 |
Top |
Related drugs of malignant transformation related genes |
| Identification of chemicals and drugs interact with genes involved in malignant transfromation |
| (DGIdb 4.0) |
| Entrez ID | Symbol | Category | Interaction Types | Drug Claim Name | Drug Name | PMIDs |
| Page: 1 |

Copyright 2023-Present -The University of Texas Health Science Center at Houston |