
|
|||||
|
 | |
| |
| |
| |
| |
| |
|
Gene: HOMER3 |
Gene summary for HOMER3 |
| Gene information | Species | Human | Gene symbol | HOMER3 | Gene ID | 9454 |
| Gene name | homer scaffold protein 3 | |
| Gene Alias | HOMER-3 | |
| Cytomap | 19p13.11 | |
| Gene Type | protein-coding | GO ID | GO:0001816 | UniProtAcc | Q9NSC5 |
Top |
Malignant transformation analysis |
| Identification of the aberrant gene expression in precancerous and cancerous lesions by comparing the gene expression of stem-like cells in diseased tissues with normal stem cells |
| Entrez ID | Symbol | Replicates | Species | Organ | Tissue | Adj P-value | Log2FC | Malignancy |
| 9454 | HOMER3 | GSM4909287 | Human | Breast | IDC | 4.81e-05 | 3.71e-01 | 0.2057 |
| 9454 | HOMER3 | GSM4909293 | Human | Breast | IDC | 3.88e-03 | 2.06e-01 | 0.1581 |
| 9454 | HOMER3 | GSM4909295 | Human | Breast | IDC | 8.42e-11 | 6.10e-01 | 0.0898 |
| 9454 | HOMER3 | GSM4909296 | Human | Breast | IDC | 2.36e-02 | -8.80e-02 | 0.1524 |
| 9454 | HOMER3 | GSM4909311 | Human | Breast | IDC | 1.19e-02 | -8.23e-02 | 0.1534 |
| 9454 | HOMER3 | GSM4909319 | Human | Breast | IDC | 1.52e-05 | -3.36e-02 | 0.1563 |
| 9454 | HOMER3 | GSM4909321 | Human | Breast | IDC | 4.72e-02 | -8.69e-02 | 0.1559 |
| 9454 | HOMER3 | M2 | Human | Breast | IDC | 2.35e-04 | 5.37e-01 | 0.21 |
| 9454 | HOMER3 | NCCBC5 | Human | Breast | DCIS | 8.76e-04 | 2.92e-01 | 0.2046 |
| 9454 | HOMER3 | DCIS2 | Human | Breast | DCIS | 9.35e-25 | 4.06e-02 | 0.0085 |
| 9454 | HOMER3 | LZE7T | Human | Esophagus | ESCC | 1.44e-03 | 4.29e-01 | 0.0667 |
| 9454 | HOMER3 | LZE22T | Human | Esophagus | ESCC | 4.11e-03 | 2.45e-01 | 0.068 |
| 9454 | HOMER3 | LZE24T | Human | Esophagus | ESCC | 2.16e-05 | 1.36e-01 | 0.0596 |
| 9454 | HOMER3 | P1T-E | Human | Esophagus | ESCC | 1.44e-07 | 3.19e-01 | 0.0875 |
| 9454 | HOMER3 | P2T-E | Human | Esophagus | ESCC | 3.99e-14 | 1.79e-01 | 0.1177 |
| 9454 | HOMER3 | P4T-E | Human | Esophagus | ESCC | 4.17e-12 | 3.18e-01 | 0.1323 |
| 9454 | HOMER3 | P5T-E | Human | Esophagus | ESCC | 3.90e-15 | 3.35e-01 | 0.1327 |
| 9454 | HOMER3 | P8T-E | Human | Esophagus | ESCC | 6.83e-09 | 1.01e-01 | 0.0889 |
| 9454 | HOMER3 | P9T-E | Human | Esophagus | ESCC | 2.36e-11 | 2.93e-01 | 0.1131 |
| 9454 | HOMER3 | P10T-E | Human | Esophagus | ESCC | 7.69e-20 | 3.83e-01 | 0.116 |
| Page: 1 2 3 4 5 6 |
| Tissue | Expression Dynamics | Abbreviation |
| Breast |  | IDC: Invasive ductal carcinoma |
| DCIS: Ductal carcinoma in situ | ||
| Precancer(BRCA1-mut): Precancerous lesion from BRCA1 mutation carriers | ||
| Esophagus |  | ESCC: Esophageal squamous cell carcinoma |
| HGIN: High-grade intraepithelial neoplasias | ||
| LGIN: Low-grade intraepithelial neoplasias | ||
| Liver | 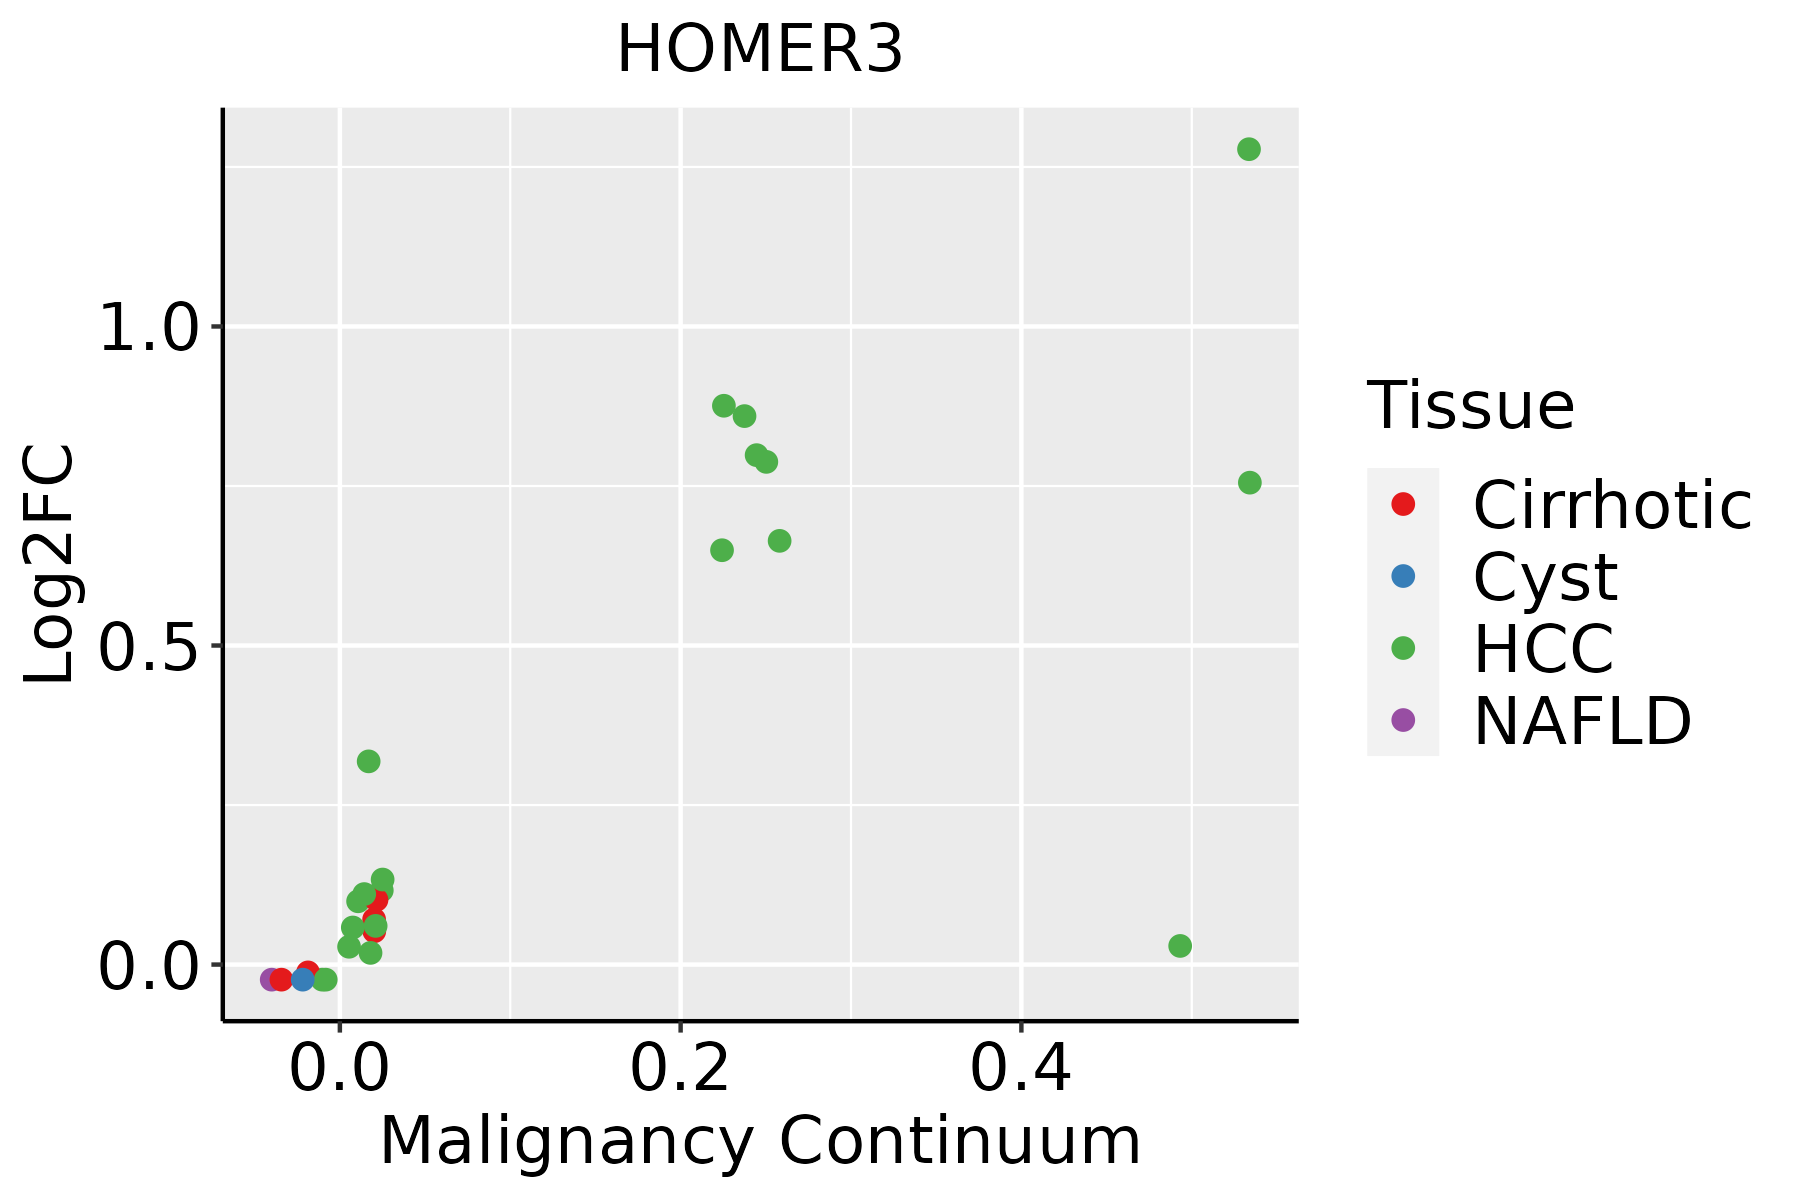 | HCC: Hepatocellular carcinoma |
| NAFLD: Non-alcoholic fatty liver disease | ||
| Oral Cavity | 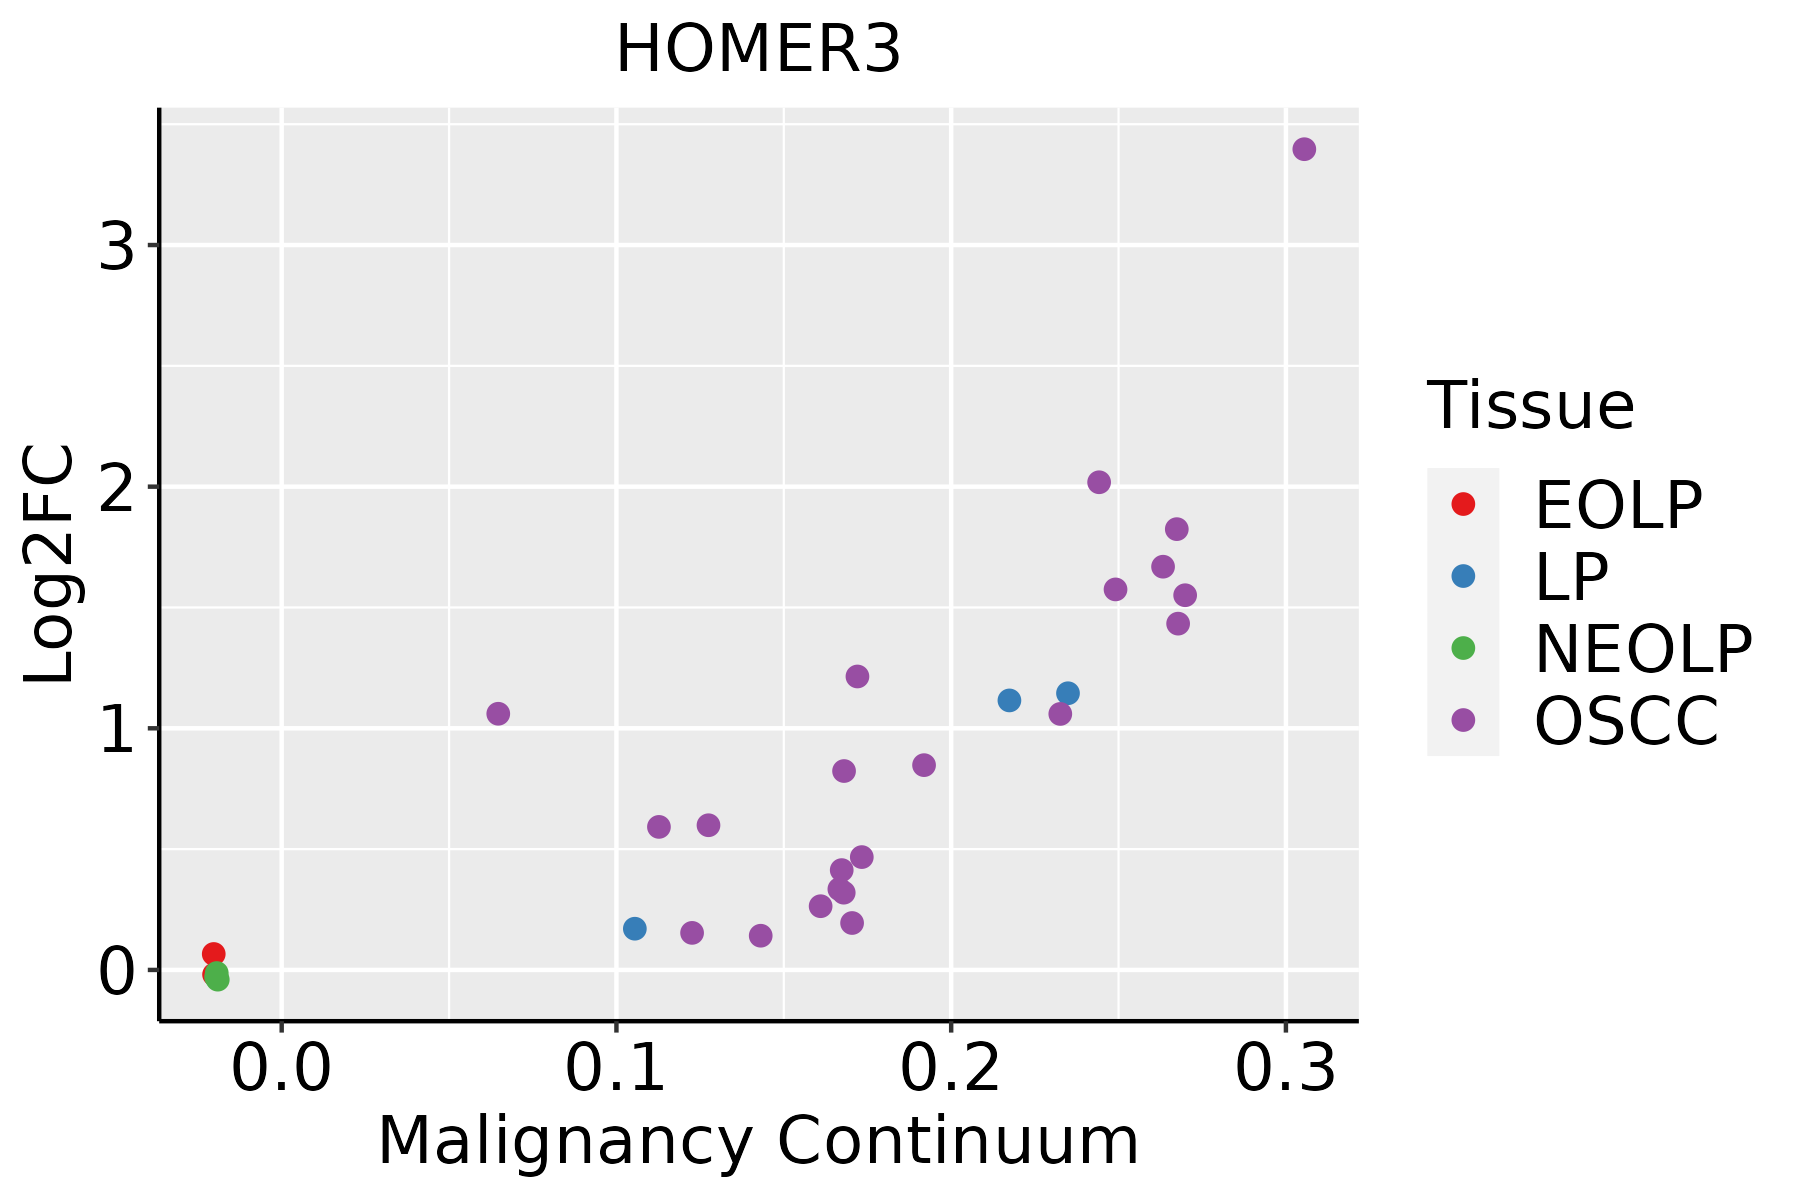 | EOLP: Erosive Oral lichen planus |
| LP: leukoplakia | ||
| NEOLP: Non-erosive oral lichen planus | ||
| OSCC: Oral squamous cell carcinoma | ||
| Skin | 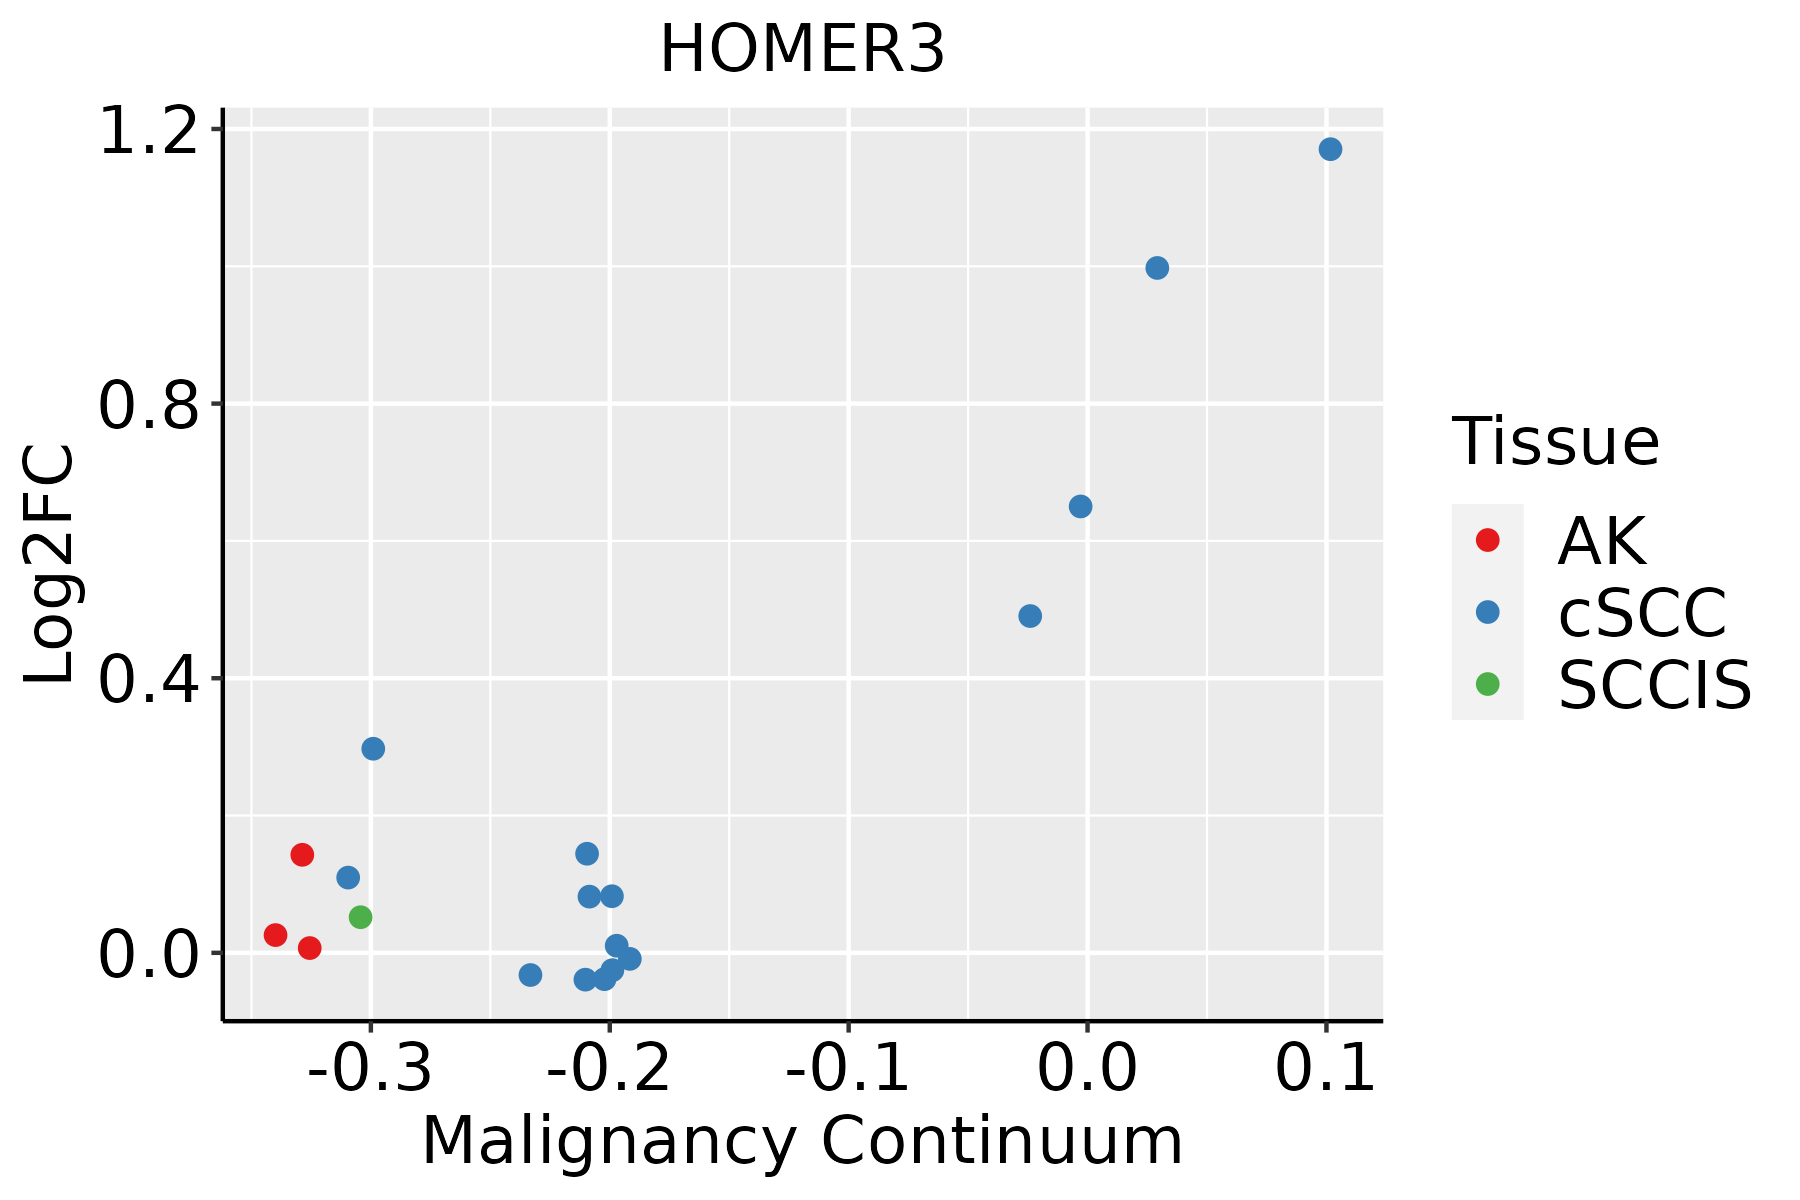 | AK: Actinic keratosis |
| cSCC: Cutaneous squamous cell carcinoma | ||
| SCCIS:squamous cell carcinoma in situ | ||
| Thyroid | 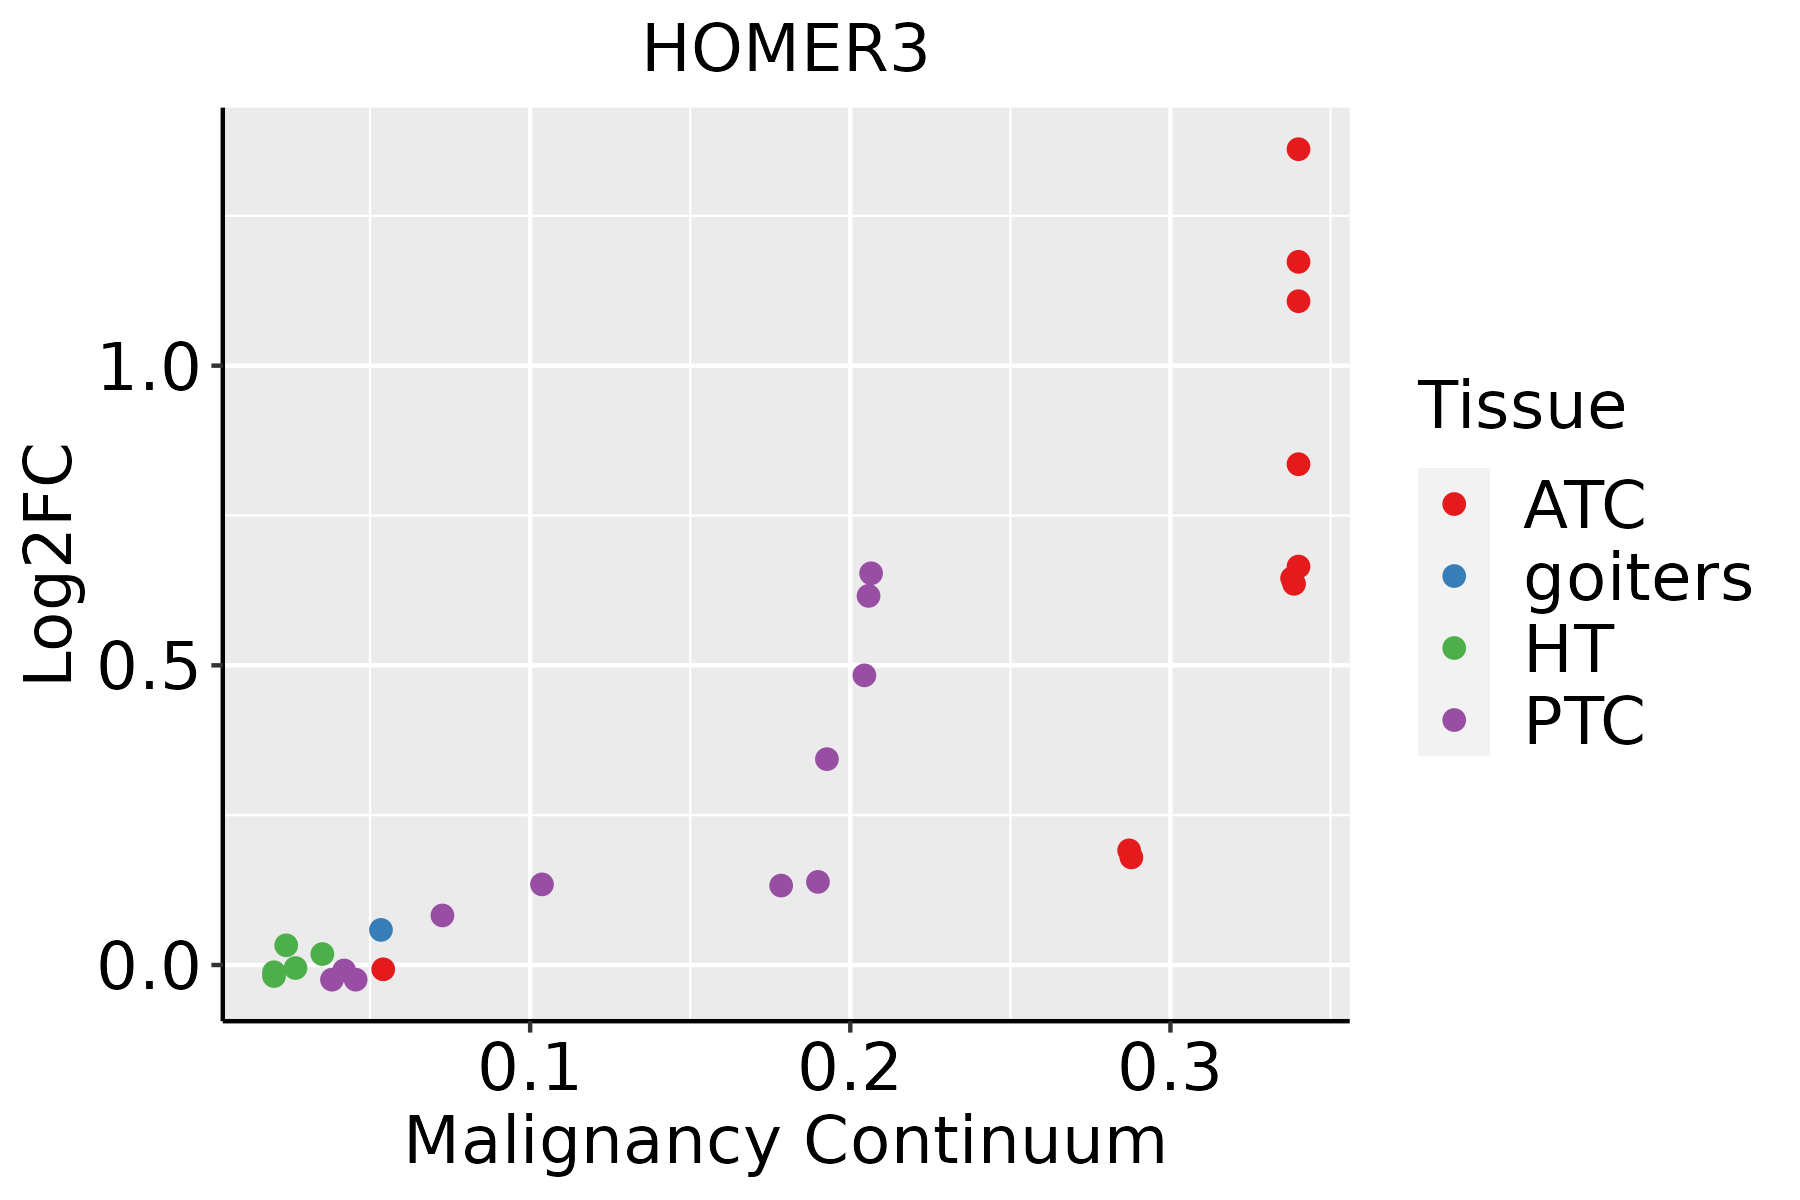 | ATC: Anaplastic thyroid cancer |
| HT: Hashimoto's thyroiditis | ||
| PTC: Papillary thyroid cancer |
| ∗log2FC in expression of this searched gene in stem-like cells from each diseased tissue sample relative to stem-like cells in normal samples in each tissue plotted against the malignancy continuum. Samples are colored based on if they are from different disease stage. |
Top |
Malignant transformation related pathway analysis |
| Find out the enriched GO biological processes and KEGG pathways involved in transition from healthy to precancer to cancer |
| Tissue | Disease Stage | Enriched GO biological Processes |
| Colorectum | AD |  |
| Colorectum | SER |  |
| Colorectum | MSS |  |
| Colorectum | MSI-H |  |
| Colorectum | FAP |  |
| ∗Top 15 enriched GO BP terms are showed in the bar plot of each disease state in each tissue. Each row represents a significant GO biological process which is colored according to the -log10(p.adjust). |
| Page: 1 2 3 4 5 6 7 8 9 |
| GO ID | Tissue | Disease Stage | Description | Gene Ratio | Bg Ratio | pvalue | p.adjust | Count |
| GO:000660514 | Breast | IDC | protein targeting | 43/1434 | 314/18723 | 1.44e-04 | 2.53e-03 | 43 |
| GO:001095913 | Breast | IDC | regulation of metal ion transport | 52/1434 | 406/18723 | 1.76e-04 | 2.97e-03 | 52 |
| GO:0032623 | Breast | IDC | interleukin-2 production | 12/1434 | 62/18723 | 2.32e-03 | 2.10e-02 | 12 |
| GO:0032663 | Breast | IDC | regulation of interleukin-2 production | 12/1434 | 62/18723 | 2.32e-03 | 2.10e-02 | 12 |
| GO:0032703 | Breast | IDC | negative regulation of interleukin-2 production | 7/1434 | 27/18723 | 3.46e-03 | 2.87e-02 | 7 |
| GO:0051924 | Breast | IDC | regulation of calcium ion transport | 32/1434 | 255/18723 | 3.94e-03 | 3.22e-02 | 32 |
| GO:000660523 | Breast | DCIS | protein targeting | 43/1390 | 314/18723 | 7.17e-05 | 1.41e-03 | 43 |
| GO:001095921 | Breast | DCIS | regulation of metal ion transport | 50/1390 | 406/18723 | 2.86e-04 | 4.22e-03 | 50 |
| GO:00326231 | Breast | DCIS | interleukin-2 production | 12/1390 | 62/18723 | 1.79e-03 | 1.73e-02 | 12 |
| GO:00326631 | Breast | DCIS | regulation of interleukin-2 production | 12/1390 | 62/18723 | 1.79e-03 | 1.73e-02 | 12 |
| GO:00327031 | Breast | DCIS | negative regulation of interleukin-2 production | 7/1390 | 27/18723 | 2.90e-03 | 2.50e-02 | 7 |
| GO:00508481 | Breast | DCIS | regulation of calcium-mediated signaling | 12/1390 | 73/18723 | 7.17e-03 | 4.85e-02 | 12 |
| GO:0006605111 | Esophagus | ESCC | protein targeting | 229/8552 | 314/18723 | 4.93e-23 | 1.01e-20 | 229 |
| GO:000660512 | Liver | HCC | protein targeting | 219/7958 | 314/18723 | 7.74e-23 | 1.49e-20 | 219 |
| GO:000660520 | Oral cavity | OSCC | protein targeting | 204/7305 | 314/18723 | 6.78e-21 | 1.13e-18 | 204 |
| GO:00331733 | Oral cavity | OSCC | calcineurin-NFAT signaling cascade | 26/7305 | 43/18723 | 3.55e-03 | 1.49e-02 | 26 |
| GO:00480164 | Oral cavity | OSCC | inositol phosphate-mediated signaling | 30/7305 | 55/18723 | 1.39e-02 | 4.59e-02 | 30 |
| GO:00708843 | Oral cavity | OSCC | regulation of calcineurin-NFAT signaling cascade | 20/7305 | 34/18723 | 1.51e-02 | 4.91e-02 | 20 |
| GO:0006605110 | Oral cavity | LP | protein targeting | 156/4623 | 314/18723 | 5.43e-22 | 1.62e-19 | 156 |
| GO:000660527 | Skin | cSCC | protein targeting | 153/4864 | 314/18723 | 2.62e-18 | 3.36e-16 | 153 |
| Page: 1 2 |
| Pathway ID | Tissue | Disease Stage | Description | Gene Ratio | Bg Ratio | pvalue | p.adjust | qvalue | Count |
| hsa040689 | Esophagus | ESCC | FoxO signaling pathway | 89/4205 | 131/8465 | 1.56e-05 | 7.98e-05 | 4.09e-05 | 89 |
| hsa0406814 | Esophagus | ESCC | FoxO signaling pathway | 89/4205 | 131/8465 | 1.56e-05 | 7.98e-05 | 4.09e-05 | 89 |
| hsa040684 | Liver | HCC | FoxO signaling pathway | 85/4020 | 131/8465 | 3.99e-05 | 2.16e-04 | 1.20e-04 | 85 |
| hsa040685 | Liver | HCC | FoxO signaling pathway | 85/4020 | 131/8465 | 3.99e-05 | 2.16e-04 | 1.20e-04 | 85 |
| hsa040688 | Oral cavity | OSCC | FoxO signaling pathway | 85/3704 | 131/8465 | 7.50e-07 | 4.33e-06 | 2.21e-06 | 85 |
| hsa0406813 | Oral cavity | OSCC | FoxO signaling pathway | 85/3704 | 131/8465 | 7.50e-07 | 4.33e-06 | 2.21e-06 | 85 |
| Page: 1 |
Top |
Cell-cell communication analysis |
| Identification of potential cell-cell interactions between two cell types and their ligand-receptor pairs for different disease states |
| Ligand | Receptor | LRpair | Pathway | Tissue | Disease Stage |
| Page: 1 |
Top |
Single-cell gene regulatory network inference analysis |
| Find out the significant the regulons (TFs) and the target genes of each regulon across cell types for different disease states |
| TF | Cell Type | Tissue | Disease Stage | Target Gene | RSS | Regulon Activity |
| ∗The dot plots of a searched regulon are shown for all cell subpopulations in each disease state of each tissue based on the regulon specific score inferred using pySCENIC and by calculating the average expression. |
| Page: 1 |
Top |
Somatic mutation of malignant transformation related genes |
| Annotation of somatic variants for genes involved in malignant transformation |
| Hugo Symbol | Variant Class | Variant Classification | dbSNP RS | HGVSc | HGVSp | HGVSp Short | SWISSPROT | BIOTYPE | SIFT | PolyPhen | Tumor Sample Barcode | Tissue | Histology | Sex | Age | Stage | Therapy Types | Drugs | Outcome |
| HOMER3 | SNV | Missense_Mutation | rs763487122 | c.166N>A | p.Ala56Thr | p.A56T | Q9NSC5 | protein_coding | tolerated(0.93) | benign(0.001) | TCGA-E9-A244-01 | Breast | breast invasive carcinoma | Female | <65 | I/II | Chemotherapy | cyclophosphamide | SD |
| HOMER3 | SNV | Missense_Mutation | c.27N>G | p.Ile9Met | p.I9M | Q9NSC5 | protein_coding | deleterious(0) | possibly_damaging(0.803) | TCGA-IR-A3LL-01 | Cervix | cervical & endocervical cancer | Female | <65 | I/II | Chemotherapy | cisplatin | CR | |
| HOMER3 | SNV | Missense_Mutation | novel | c.418C>A | p.Pro140Thr | p.P140T | Q9NSC5 | protein_coding | tolerated(0.06) | benign(0.344) | TCGA-AA-A010-01 | Colorectum | colon adenocarcinoma | Female | <65 | I/II | Chemotherapy | folinic | CR |
| HOMER3 | SNV | Missense_Mutation | c.364N>A | p.Asp122Asn | p.D122N | Q9NSC5 | protein_coding | deleterious(0) | possibly_damaging(0.859) | TCGA-CK-4951-01 | Colorectum | colon adenocarcinoma | Female | >=65 | I/II | Unknown | Unknown | PD | |
| HOMER3 | SNV | Missense_Mutation | rs751165867 | c.1063N>T | p.Arg355Cys | p.R355C | Q9NSC5 | protein_coding | deleterious(0.01) | possibly_damaging(0.63) | TCGA-NH-A5IV-01 | Colorectum | colon adenocarcinoma | Female | >=65 | I/II | Unknown | Unknown | SD |
| HOMER3 | SNV | Missense_Mutation | novel | c.884A>G | p.Gln295Arg | p.Q295R | Q9NSC5 | protein_coding | deleterious(0.01) | possibly_damaging(0.554) | TCGA-A5-A0G2-01 | Endometrium | uterine corpus endometrioid carcinoma | Female | <65 | III/IV | Unknown | Unknown | SD |
| HOMER3 | SNV | Missense_Mutation | novel | c.368N>A | p.Gly123Asp | p.G123D | Q9NSC5 | protein_coding | deleterious(0.01) | possibly_damaging(0.649) | TCGA-A5-A2K3-01 | Endometrium | uterine corpus endometrioid carcinoma | Female | >=65 | I/II | Chemotherapy | carboplatin | SD |
| HOMER3 | SNV | Missense_Mutation | rs753159724 | c.847G>A | p.Glu283Lys | p.E283K | Q9NSC5 | protein_coding | deleterious(0.01) | possibly_damaging(0.73) | TCGA-AP-A056-01 | Endometrium | uterine corpus endometrioid carcinoma | Female | <65 | I/II | Unknown | Unknown | SD |
| HOMER3 | SNV | Missense_Mutation | novel | c.359N>A | p.Ser120Tyr | p.S120Y | Q9NSC5 | protein_coding | deleterious(0) | probably_damaging(0.999) | TCGA-AP-A1DV-01 | Endometrium | uterine corpus endometrioid carcinoma | Female | <65 | I/II | Unknown | Unknown | SD |
| HOMER3 | SNV | Missense_Mutation | novel | c.16N>A | p.Glu6Lys | p.E6K | Q9NSC5 | protein_coding | deleterious(0) | probably_damaging(0.999) | TCGA-AX-A2HC-01 | Endometrium | uterine corpus endometrioid carcinoma | Female | <65 | III/IV | Chemotherapy | paclitaxel | PD |
| Page: 1 2 3 |
Top |
Related drugs of malignant transformation related genes |
| Identification of chemicals and drugs interact with genes involved in malignant transfromation |
| (DGIdb 4.0) |
| Entrez ID | Symbol | Category | Interaction Types | Drug Claim Name | Drug Name | PMIDs |
| Page: 1 |

Copyright 2023-Present -The University of Texas Health Science Center at Houston |