
|
|||||
|
 | |
| |
| |
| |
| |
| |
|
Gene: HOMER2 |
Gene summary for HOMER2 |
| Gene information | Species | Human | Gene symbol | HOMER2 | Gene ID | 9455 |
| Gene name | homer scaffold protein 2 | |
| Gene Alias | ACPD | |
| Cytomap | 15q25.2 | |
| Gene Type | protein-coding | GO ID | GO:0001816 | UniProtAcc | Q9NSB8 |
Top |
Malignant transformation analysis |
| Identification of the aberrant gene expression in precancerous and cancerous lesions by comparing the gene expression of stem-like cells in diseased tissues with normal stem cells |
| Entrez ID | Symbol | Replicates | Species | Organ | Tissue | Adj P-value | Log2FC | Malignancy |
| 9455 | HOMER2 | AEH-subject3 | Human | Endometrium | AEH | 6.65e-05 | 4.10e-01 | -0.2576 |
| 9455 | HOMER2 | AEH-subject5 | Human | Endometrium | AEH | 4.41e-20 | 7.32e-01 | -0.2953 |
| 9455 | HOMER2 | EEC-subject1 | Human | Endometrium | EEC | 4.66e-03 | 3.94e-01 | -0.2682 |
| 9455 | HOMER2 | EEC-subject3 | Human | Endometrium | EEC | 3.94e-06 | 1.43e-01 | -0.2525 |
| 9455 | HOMER2 | EEC-subject4 | Human | Endometrium | EEC | 8.79e-29 | 8.02e-01 | -0.2571 |
| 9455 | HOMER2 | GSM5276934 | Human | Endometrium | EEC | 1.69e-03 | -2.25e-01 | -0.0913 |
| 9455 | HOMER2 | GSM5276937 | Human | Endometrium | EEC | 1.30e-02 | -2.41e-01 | -0.0897 |
| 9455 | HOMER2 | GSM6177620_NYU_UCEC1_lib1_lib1 | Human | Endometrium | EEC | 2.21e-09 | 1.89e-01 | -0.1869 |
| 9455 | HOMER2 | GSM6177620_NYU_UCEC1_lib2_lib2 | Human | Endometrium | EEC | 1.88e-10 | 4.26e-02 | -0.1875 |
| 9455 | HOMER2 | GSM6177620_NYU_UCEC1_lib3_lib3 | Human | Endometrium | EEC | 1.94e-10 | 1.51e-01 | -0.1883 |
| 9455 | HOMER2 | GSM6177621_NYU_UCEC2_lib1_lib1 | Human | Endometrium | EEC | 3.45e-24 | 7.09e-01 | -0.1934 |
| 9455 | HOMER2 | GSM6177622_NYU_UCEC3_lib1_lib1 | Human | Endometrium | EEC | 1.37e-15 | -5.15e-02 | -0.1917 |
| 9455 | HOMER2 | GSM6177622_NYU_UCEC3_lib2_lib2 | Human | Endometrium | EEC | 1.08e-14 | -1.00e-01 | -0.1916 |
| 9455 | HOMER2 | LZE7T | Human | Esophagus | ESCC | 4.08e-02 | 1.48e-01 | 0.0667 |
| 9455 | HOMER2 | P2T-E | Human | Esophagus | ESCC | 3.48e-06 | 2.53e-02 | 0.1177 |
| 9455 | HOMER2 | P4T-E | Human | Esophagus | ESCC | 4.57e-14 | 4.44e-01 | 0.1323 |
| 9455 | HOMER2 | P5T-E | Human | Esophagus | ESCC | 7.25e-11 | 2.25e-01 | 0.1327 |
| 9455 | HOMER2 | P8T-E | Human | Esophagus | ESCC | 9.63e-11 | 1.19e-01 | 0.0889 |
| 9455 | HOMER2 | P11T-E | Human | Esophagus | ESCC | 2.16e-02 | 7.68e-02 | 0.1426 |
| 9455 | HOMER2 | P16T-E | Human | Esophagus | ESCC | 2.48e-14 | 8.88e-02 | 0.1153 |
| Page: 1 2 3 4 |
| Tissue | Expression Dynamics | Abbreviation |
| Endometrium |  | AEH: Atypical endometrial hyperplasia |
| EEC: Endometrioid Cancer | ||
| Esophagus |  | ESCC: Esophageal squamous cell carcinoma |
| HGIN: High-grade intraepithelial neoplasias | ||
| LGIN: Low-grade intraepithelial neoplasias | ||
| Liver | 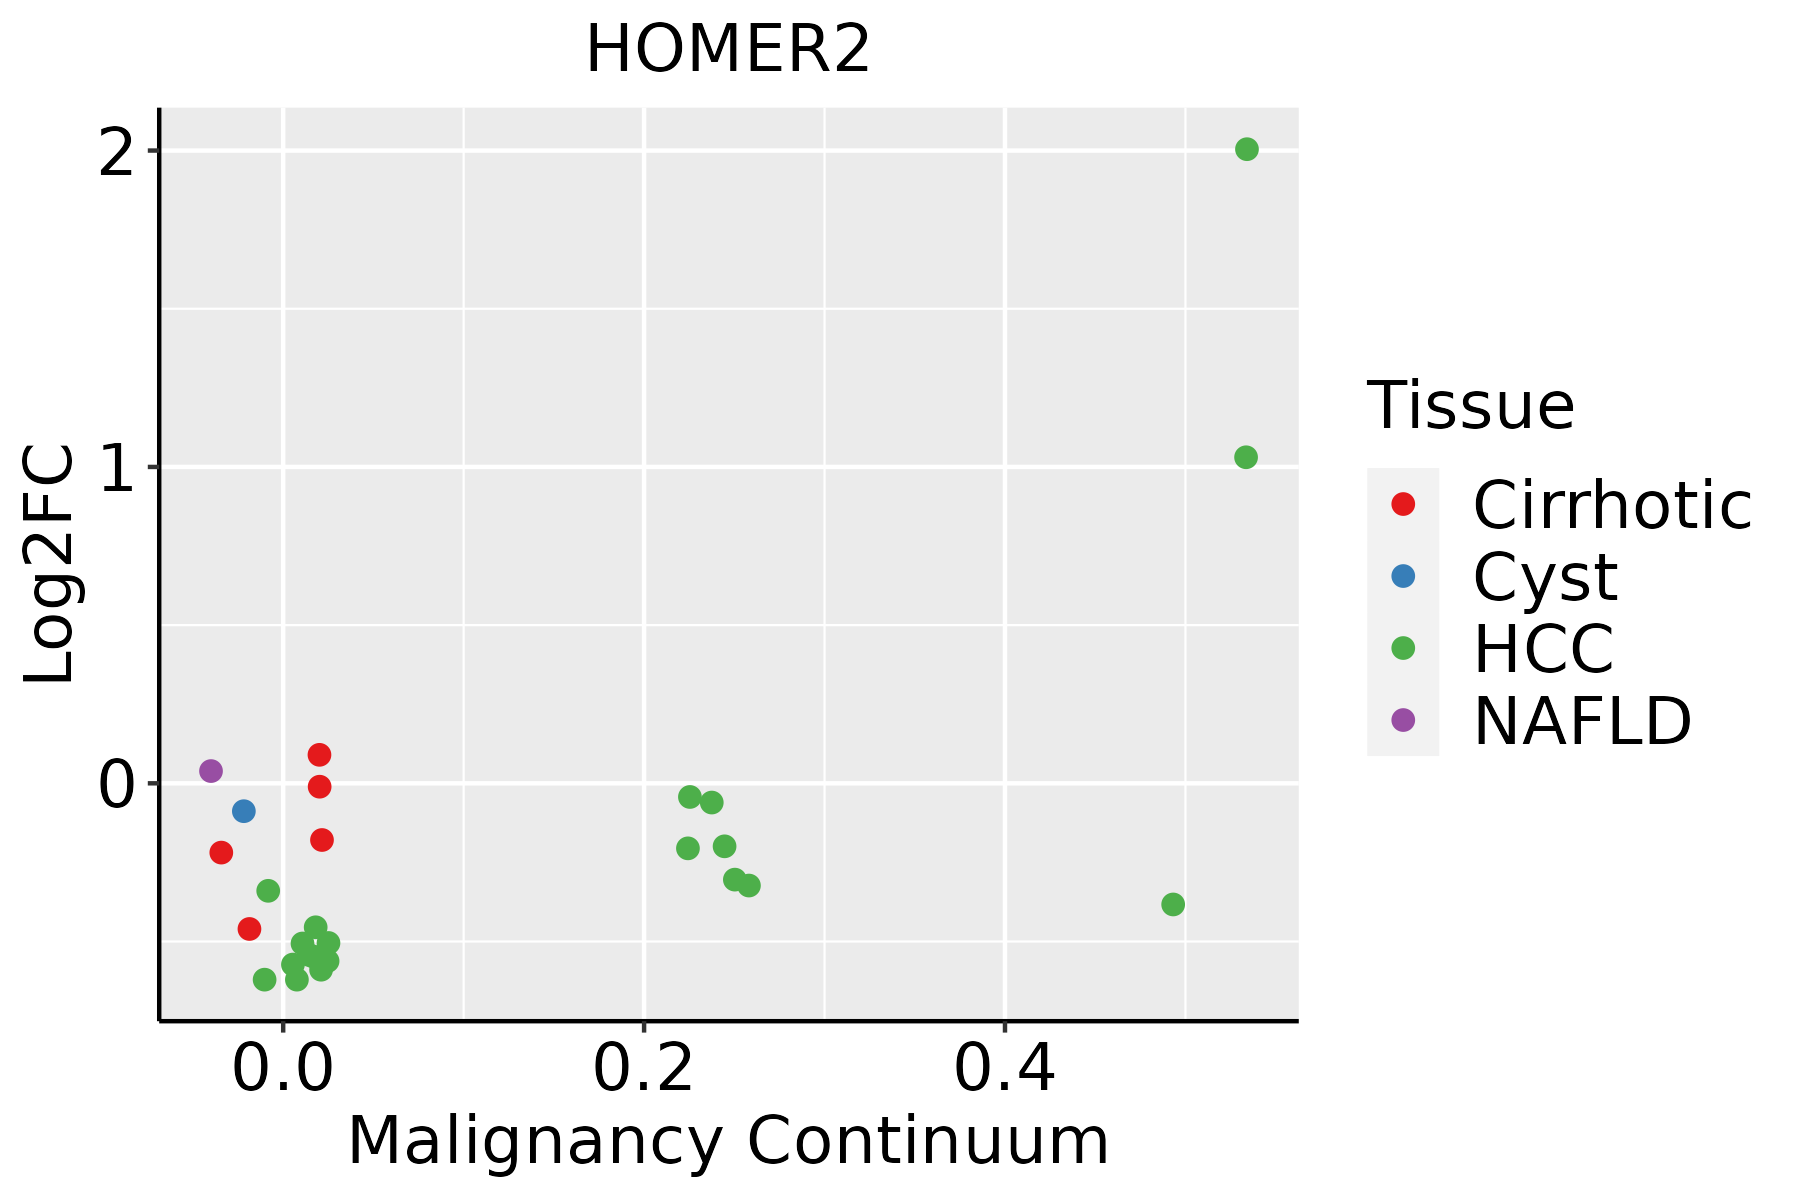 | HCC: Hepatocellular carcinoma |
| NAFLD: Non-alcoholic fatty liver disease | ||
| Prostate | 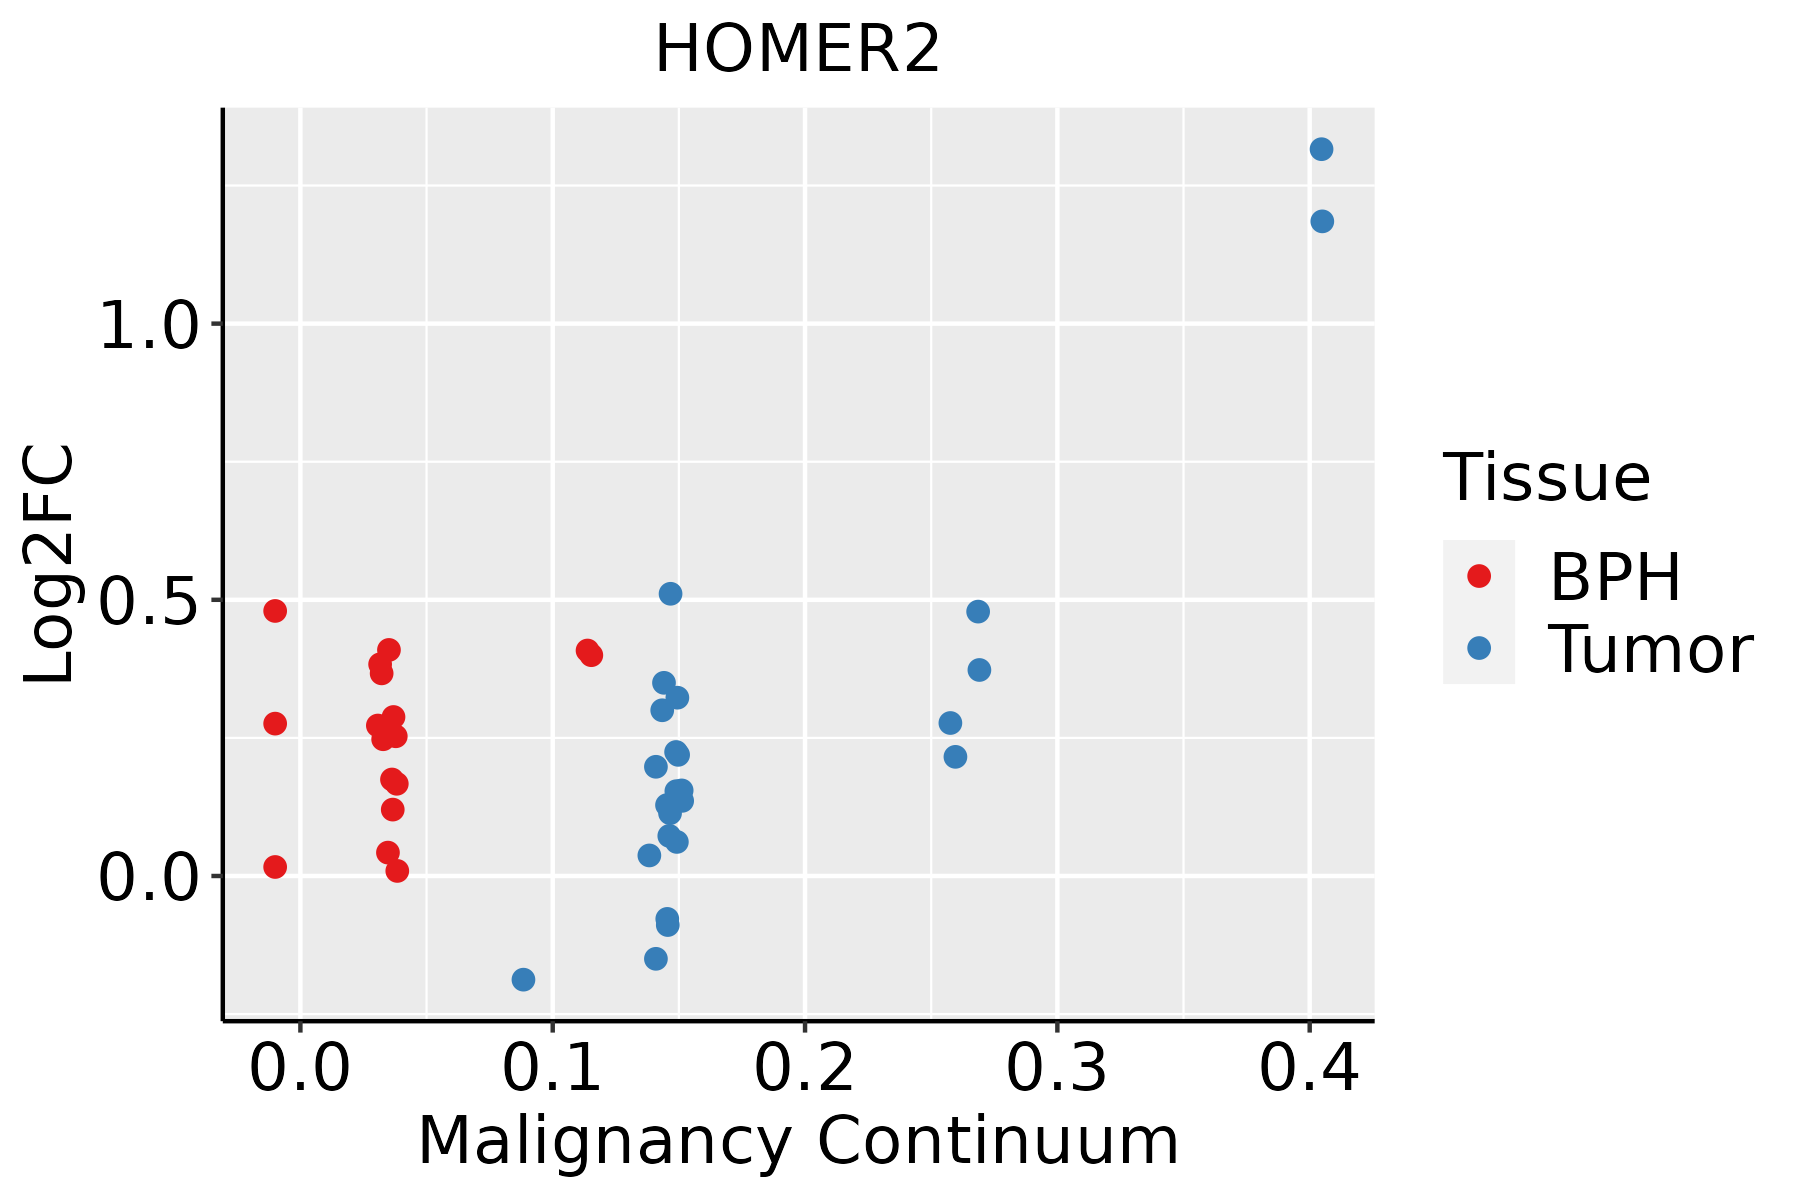 | BPH: Benign Prostatic Hyperplasia |
| Thyroid | 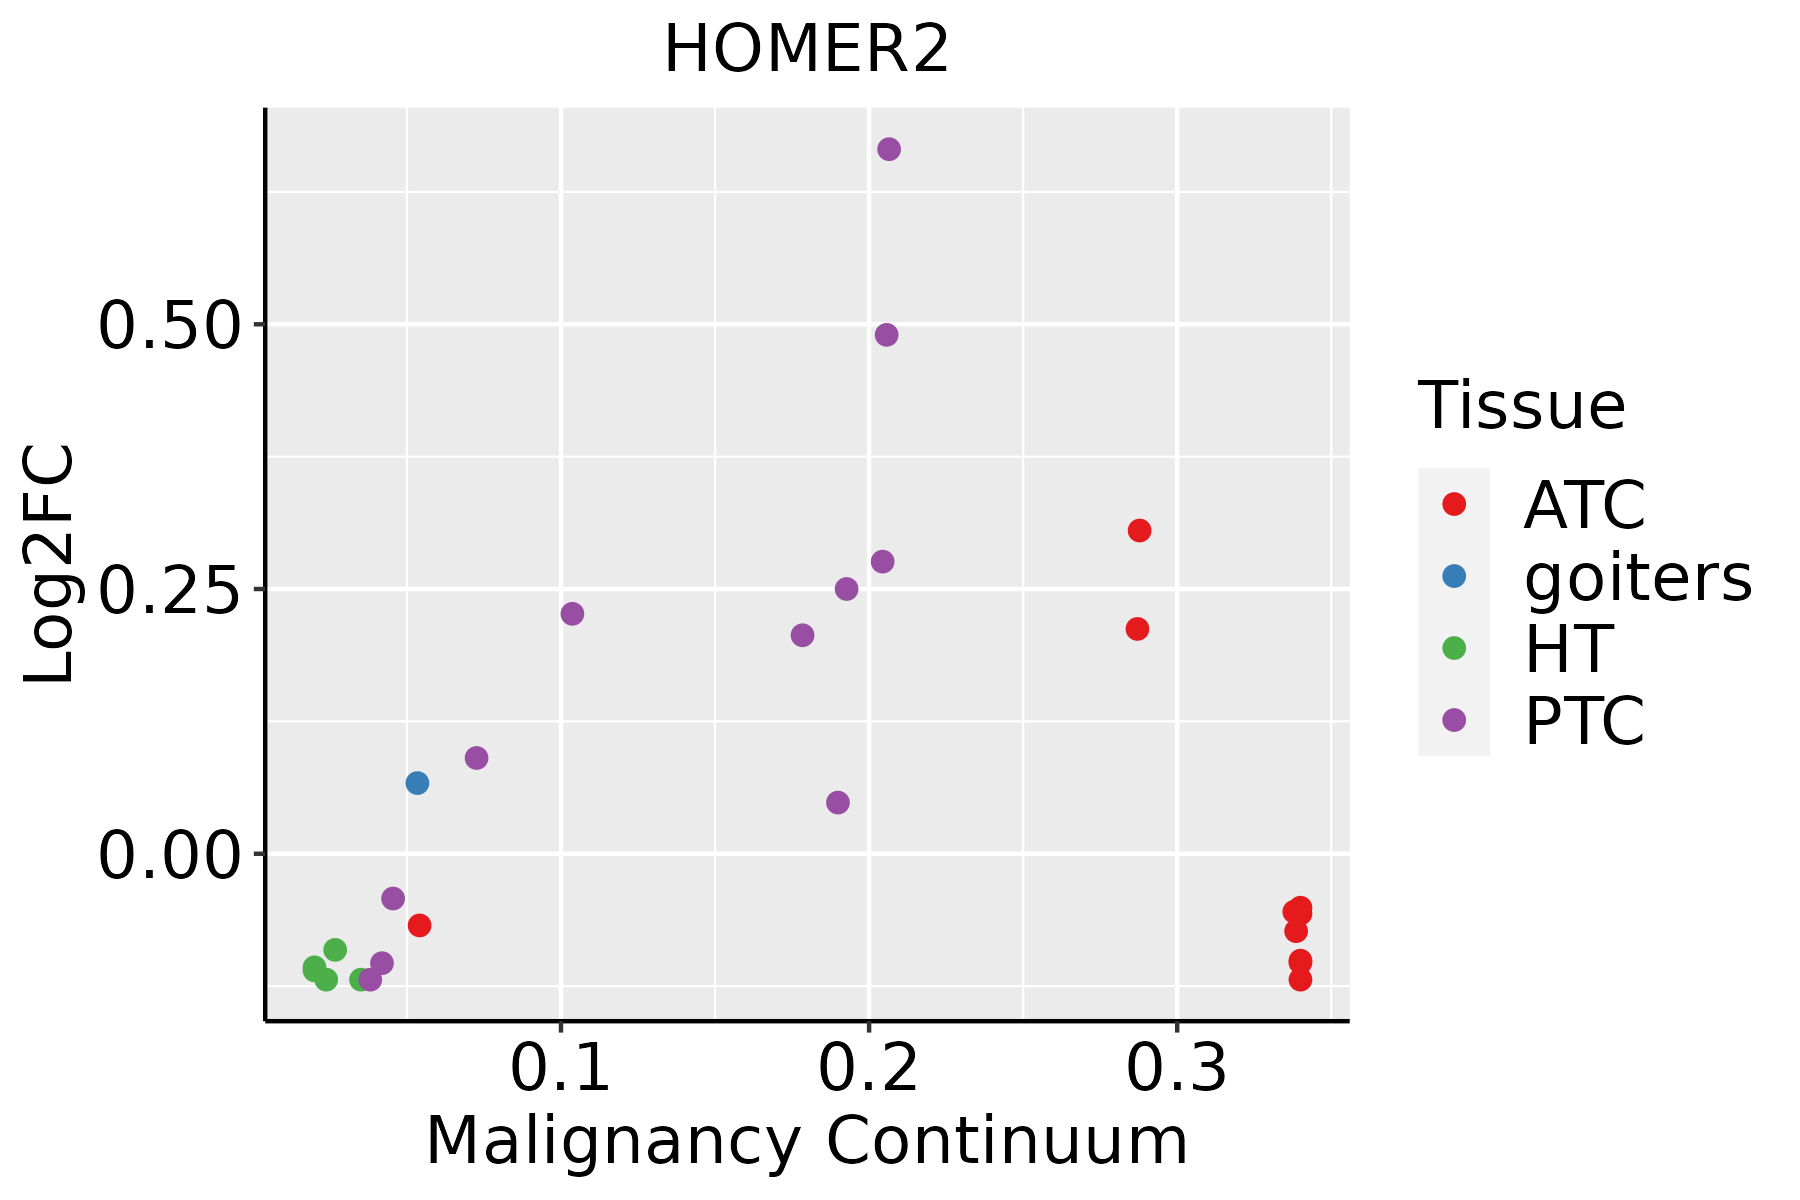 | ATC: Anaplastic thyroid cancer |
| HT: Hashimoto's thyroiditis | ||
| PTC: Papillary thyroid cancer |
| ∗log2FC in expression of this searched gene in stem-like cells from each diseased tissue sample relative to stem-like cells in normal samples in each tissue plotted against the malignancy continuum. Samples are colored based on if they are from different disease stage. |
Top |
Malignant transformation related pathway analysis |
| Find out the enriched GO biological processes and KEGG pathways involved in transition from healthy to precancer to cancer |
| Tissue | Disease Stage | Enriched GO biological Processes |
| Colorectum | AD |  |
| Colorectum | SER |  |
| Colorectum | MSS |  |
| Colorectum | MSI-H |  |
| Colorectum | FAP |  |
| ∗Top 15 enriched GO BP terms are showed in the bar plot of each disease state in each tissue. Each row represents a significant GO biological process which is colored according to the -log10(p.adjust). |
| Page: 1 2 3 4 5 6 7 8 9 |
| GO ID | Tissue | Disease Stage | Description | Gene Ratio | Bg Ratio | pvalue | p.adjust | Count |
| GO:000189410 | Endometrium | AEH | tissue homeostasis | 50/2100 | 268/18723 | 2.04e-04 | 2.54e-03 | 50 |
| GO:00602499 | Endometrium | AEH | anatomical structure homeostasis | 55/2100 | 314/18723 | 5.27e-04 | 5.32e-03 | 55 |
| GO:00109597 | Endometrium | AEH | regulation of metal ion transport | 66/2100 | 406/18723 | 1.24e-03 | 1.07e-02 | 66 |
| GO:000189415 | Endometrium | EEC | tissue homeostasis | 51/2168 | 268/18723 | 2.34e-04 | 2.75e-03 | 51 |
| GO:001095914 | Endometrium | EEC | regulation of metal ion transport | 70/2168 | 406/18723 | 4.12e-04 | 4.35e-03 | 70 |
| GO:006024914 | Endometrium | EEC | anatomical structure homeostasis | 56/2168 | 314/18723 | 6.52e-04 | 6.35e-03 | 56 |
| GO:0042220 | Liver | NAFLD | response to cocaine | 13/1882 | 55/18723 | 2.64e-03 | 2.42e-02 | 13 |
| GO:00432791 | Liver | HCC | response to alkaloid | 62/7958 | 115/18723 | 8.79e-03 | 3.42e-02 | 62 |
| GO:00331732 | Prostate | BPH | calcineurin-NFAT signaling cascade | 16/3107 | 43/18723 | 9.26e-04 | 5.91e-03 | 16 |
| GO:00708842 | Prostate | BPH | regulation of calcineurin-NFAT signaling cascade | 13/3107 | 34/18723 | 2.06e-03 | 1.16e-02 | 13 |
| GO:00480163 | Prostate | BPH | inositol phosphate-mediated signaling | 18/3107 | 55/18723 | 2.50e-03 | 1.34e-02 | 18 |
| GO:01060562 | Prostate | BPH | regulation of calcineurin-mediated signaling | 13/3107 | 35/18723 | 2.79e-03 | 1.47e-02 | 13 |
| GO:00977202 | Prostate | BPH | calcineurin-mediated signaling | 16/3107 | 48/18723 | 3.45e-03 | 1.77e-02 | 16 |
| GO:00326232 | Prostate | BPH | interleukin-2 production | 19/3107 | 62/18723 | 4.41e-03 | 2.16e-02 | 19 |
| GO:00326632 | Prostate | BPH | regulation of interleukin-2 production | 19/3107 | 62/18723 | 4.41e-03 | 2.16e-02 | 19 |
| GO:006024910 | Prostate | BPH | anatomical structure homeostasis | 68/3107 | 314/18723 | 1.10e-02 | 4.53e-02 | 68 |
| GO:00331731 | Prostate | Tumor | calcineurin-NFAT signaling cascade | 16/3246 | 43/18723 | 1.50e-03 | 9.27e-03 | 16 |
| GO:000189416 | Prostate | Tumor | tissue homeostasis | 65/3246 | 268/18723 | 2.39e-03 | 1.35e-02 | 65 |
| GO:006024915 | Prostate | Tumor | anatomical structure homeostasis | 74/3246 | 314/18723 | 2.82e-03 | 1.54e-02 | 74 |
| GO:00708841 | Prostate | Tumor | regulation of calcineurin-NFAT signaling cascade | 13/3246 | 34/18723 | 3.09e-03 | 1.63e-02 | 13 |
| Page: 1 2 |
| Pathway ID | Tissue | Disease Stage | Description | Gene Ratio | Bg Ratio | pvalue | p.adjust | qvalue | Count |
| hsa040689 | Esophagus | ESCC | FoxO signaling pathway | 89/4205 | 131/8465 | 1.56e-05 | 7.98e-05 | 4.09e-05 | 89 |
| hsa0406814 | Esophagus | ESCC | FoxO signaling pathway | 89/4205 | 131/8465 | 1.56e-05 | 7.98e-05 | 4.09e-05 | 89 |
| hsa04068 | Liver | NAFLD | FoxO signaling pathway | 30/1043 | 131/8465 | 4.91e-04 | 8.05e-03 | 6.49e-03 | 30 |
| hsa040681 | Liver | NAFLD | FoxO signaling pathway | 30/1043 | 131/8465 | 4.91e-04 | 8.05e-03 | 6.49e-03 | 30 |
| hsa040682 | Liver | Cirrhotic | FoxO signaling pathway | 52/2530 | 131/8465 | 9.98e-03 | 3.32e-02 | 2.05e-02 | 52 |
| hsa040683 | Liver | Cirrhotic | FoxO signaling pathway | 52/2530 | 131/8465 | 9.98e-03 | 3.32e-02 | 2.05e-02 | 52 |
| hsa040684 | Liver | HCC | FoxO signaling pathway | 85/4020 | 131/8465 | 3.99e-05 | 2.16e-04 | 1.20e-04 | 85 |
| hsa040685 | Liver | HCC | FoxO signaling pathway | 85/4020 | 131/8465 | 3.99e-05 | 2.16e-04 | 1.20e-04 | 85 |
| hsa040687 | Prostate | BPH | FoxO signaling pathway | 54/1718 | 131/8465 | 3.05e-08 | 3.59e-07 | 2.22e-07 | 54 |
| hsa0406812 | Prostate | BPH | FoxO signaling pathway | 54/1718 | 131/8465 | 3.05e-08 | 3.59e-07 | 2.22e-07 | 54 |
| hsa0406822 | Prostate | Tumor | FoxO signaling pathway | 54/1791 | 131/8465 | 1.32e-07 | 1.51e-06 | 9.36e-07 | 54 |
| hsa0406832 | Prostate | Tumor | FoxO signaling pathway | 54/1791 | 131/8465 | 1.32e-07 | 1.51e-06 | 9.36e-07 | 54 |
| Page: 1 |
Top |
Cell-cell communication analysis |
| Identification of potential cell-cell interactions between two cell types and their ligand-receptor pairs for different disease states |
| Ligand | Receptor | LRpair | Pathway | Tissue | Disease Stage |
| Page: 1 |
Top |
Single-cell gene regulatory network inference analysis |
| Find out the significant the regulons (TFs) and the target genes of each regulon across cell types for different disease states |
| TF | Cell Type | Tissue | Disease Stage | Target Gene | RSS | Regulon Activity |
| ∗The dot plots of a searched regulon are shown for all cell subpopulations in each disease state of each tissue based on the regulon specific score inferred using pySCENIC and by calculating the average expression. |
| Page: 1 |
Top |
Somatic mutation of malignant transformation related genes |
| Annotation of somatic variants for genes involved in malignant transformation |
| Hugo Symbol | Variant Class | Variant Classification | dbSNP RS | HGVSc | HGVSp | HGVSp Short | SWISSPROT | BIOTYPE | SIFT | PolyPhen | Tumor Sample Barcode | Tissue | Histology | Sex | Age | Stage | Therapy Types | Drugs | Outcome |
| HOMER2 | SNV | Missense_Mutation | rs372825300 | c.1000N>A | p.Asp334Asn | p.D334N | Q9NSB8 | protein_coding | deleterious(0) | probably_damaging(1) | TCGA-A2-A0SY-01 | Breast | breast invasive carcinoma | Female | <65 | III/IV | Hormone Therapy | arimidex | SD |
| HOMER2 | SNV | Missense_Mutation | rs752308964 | c.568N>T | p.Leu190Phe | p.L190F | Q9NSB8 | protein_coding | deleterious(0) | probably_damaging(0.938) | TCGA-AO-A03P-01 | Breast | breast invasive carcinoma | Female | <65 | I/II | Hormone Therapy | letrozole | PD |
| HOMER2 | SNV | Missense_Mutation | c.883G>A | p.Glu295Lys | p.E295K | Q9NSB8 | protein_coding | deleterious(0) | benign(0.355) | TCGA-C8-A1HM-01 | Breast | breast invasive carcinoma | Female | >=65 | I/II | Chemotherapy | doxorubicin | CR | |
| HOMER2 | SNV | Missense_Mutation | c.614N>A | p.Ala205Glu | p.A205E | Q9NSB8 | protein_coding | tolerated(0.06) | benign(0.001) | TCGA-E2-A14R-01 | Breast | breast invasive carcinoma | Female | <65 | I/II | Chemotherapy | doxorubicin | PD | |
| HOMER2 | SNV | Missense_Mutation | c.661N>A | p.Glu221Lys | p.E221K | Q9NSB8 | protein_coding | deleterious(0.01) | probably_damaging(0.997) | TCGA-EW-A1PB-01 | Breast | breast invasive carcinoma | Female | >=65 | III/IV | Unknown | Unknown | SD | |
| HOMER2 | SNV | Missense_Mutation | novel | c.1057N>A | p.Asp353Asn | p.D353N | Q9NSB8 | protein_coding | deleterious(0.03) | possibly_damaging(0.635) | TCGA-DS-A1OB-01 | Cervix | cervical & endocervical cancer | Female | <65 | I/II | Chemotherapy | carboplatin | PD |
| HOMER2 | SNV | Missense_Mutation | c.303N>C | p.Glu101Asp | p.E101D | Q9NSB8 | protein_coding | tolerated(0.11) | benign(0.007) | TCGA-FU-A23K-01 | Cervix | cervical & endocervical cancer | Female | <65 | III/IV | Unknown | Unknown | SD | |
| HOMER2 | SNV | Missense_Mutation | c.637N>G | p.Arg213Gly | p.R213G | Q9NSB8 | protein_coding | deleterious(0) | benign(0.02) | TCGA-AA-3842-01 | Colorectum | colon adenocarcinoma | Male | <65 | III/IV | Chemotherapy | folinic | PD | |
| HOMER2 | SNV | Missense_Mutation | c.808C>A | p.Leu270Ile | p.L270I | Q9NSB8 | protein_coding | deleterious(0.02) | benign(0.343) | TCGA-AA-A010-01 | Colorectum | colon adenocarcinoma | Female | <65 | I/II | Chemotherapy | folinic | CR | |
| HOMER2 | SNV | Missense_Mutation | rs201320170 | c.136N>T | p.Arg46Trp | p.R46W | Q9NSB8 | protein_coding | deleterious(0) | probably_damaging(0.995) | TCGA-AZ-4315-01 | Colorectum | colon adenocarcinoma | Male | <65 | I/II | Unknown | Unknown | SD |
| Page: 1 2 3 4 |
Top |
Related drugs of malignant transformation related genes |
| Identification of chemicals and drugs interact with genes involved in malignant transfromation |
| (DGIdb 4.0) |
| Entrez ID | Symbol | Category | Interaction Types | Drug Claim Name | Drug Name | PMIDs |
| Page: 1 |

Copyright 2023-Present -The University of Texas Health Science Center at Houston |