
|
|||||
|
 | |
| |
| |
| |
| |
| |
|
Gene: HOMER1 |
Gene summary for HOMER1 |
| Gene information | Species | Human | Gene symbol | HOMER1 | Gene ID | 9456 |
| Gene name | homer scaffold protein 1 | |
| Gene Alias | HOMER | |
| Cytomap | 5q14.1 | |
| Gene Type | protein-coding | GO ID | GO:0001894 | UniProtAcc | Q86YM7 |
Top |
Malignant transformation analysis |
| Identification of the aberrant gene expression in precancerous and cancerous lesions by comparing the gene expression of stem-like cells in diseased tissues with normal stem cells |
| Entrez ID | Symbol | Replicates | Species | Organ | Tissue | Adj P-value | Log2FC | Malignancy |
| 9456 | HOMER1 | AEH-subject1 | Human | Endometrium | AEH | 7.63e-05 | 3.37e-01 | -0.3059 |
| 9456 | HOMER1 | AEH-subject2 | Human | Endometrium | AEH | 6.87e-07 | 3.47e-01 | -0.2525 |
| 9456 | HOMER1 | AEH-subject3 | Human | Endometrium | AEH | 2.08e-04 | 3.08e-01 | -0.2576 |
| 9456 | HOMER1 | AEH-subject5 | Human | Endometrium | AEH | 2.50e-07 | 3.32e-01 | -0.2953 |
| 9456 | HOMER1 | EEC-subject1 | Human | Endometrium | EEC | 1.82e-23 | 7.24e-01 | -0.2682 |
| 9456 | HOMER1 | EEC-subject3 | Human | Endometrium | EEC | 4.72e-13 | 5.05e-01 | -0.2525 |
| 9456 | HOMER1 | EEC-subject4 | Human | Endometrium | EEC | 5.58e-05 | 2.44e-01 | -0.2571 |
| 9456 | HOMER1 | GSM6177620_NYU_UCEC1_lib1_lib1 | Human | Endometrium | EEC | 3.03e-06 | 1.06e-01 | -0.1869 |
| 9456 | HOMER1 | GSM6177620_NYU_UCEC1_lib2_lib2 | Human | Endometrium | EEC | 1.15e-02 | 3.82e-02 | -0.1875 |
| 9456 | HOMER1 | GSM6177620_NYU_UCEC1_lib3_lib3 | Human | Endometrium | EEC | 8.19e-05 | 3.78e-02 | -0.1883 |
| 9456 | HOMER1 | GSM6177621_NYU_UCEC2_lib1_lib1 | Human | Endometrium | EEC | 3.32e-02 | 1.57e-01 | -0.1934 |
| 9456 | HOMER1 | GSM6177622_NYU_UCEC3_lib1_lib1 | Human | Endometrium | EEC | 2.48e-02 | -2.82e-02 | -0.1917 |
| 9456 | HOMER1 | GSM6177622_NYU_UCEC3_lib2_lib2 | Human | Endometrium | EEC | 5.06e-04 | -4.75e-02 | -0.1916 |
| 9456 | HOMER1 | LZE4T | Human | Esophagus | ESCC | 6.77e-04 | -3.48e-02 | 0.0811 |
| 9456 | HOMER1 | LZE24T | Human | Esophagus | ESCC | 2.31e-08 | 3.46e-01 | 0.0596 |
| 9456 | HOMER1 | P2T-E | Human | Esophagus | ESCC | 1.84e-11 | 2.73e-01 | 0.1177 |
| 9456 | HOMER1 | P4T-E | Human | Esophagus | ESCC | 9.56e-13 | 6.68e-02 | 0.1323 |
| 9456 | HOMER1 | P5T-E | Human | Esophagus | ESCC | 7.35e-06 | -5.20e-02 | 0.1327 |
| 9456 | HOMER1 | P8T-E | Human | Esophagus | ESCC | 6.04e-03 | -5.18e-02 | 0.0889 |
| 9456 | HOMER1 | P9T-E | Human | Esophagus | ESCC | 4.38e-07 | 9.75e-02 | 0.1131 |
| Page: 1 2 3 4 5 |
| Tissue | Expression Dynamics | Abbreviation |
| Endometrium | 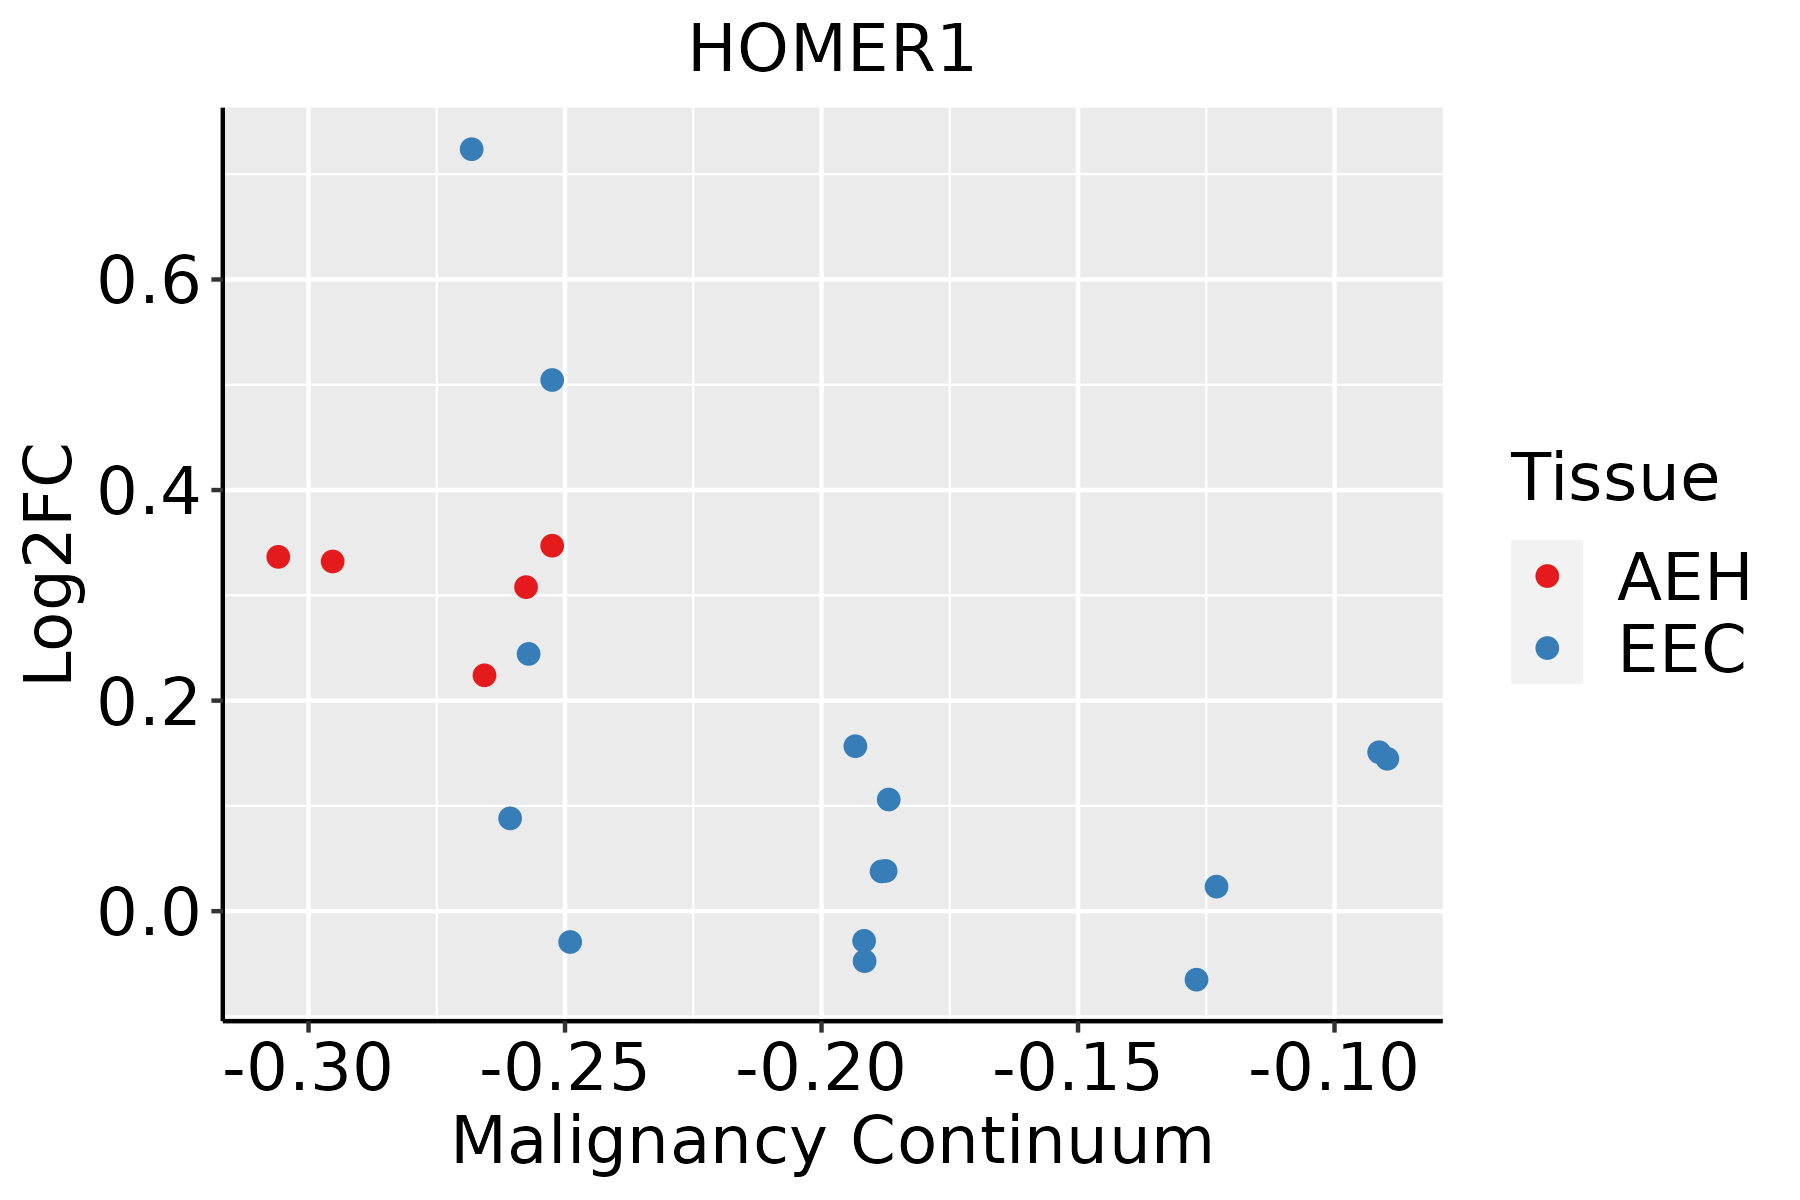 | AEH: Atypical endometrial hyperplasia |
| EEC: Endometrioid Cancer | ||
| Esophagus | 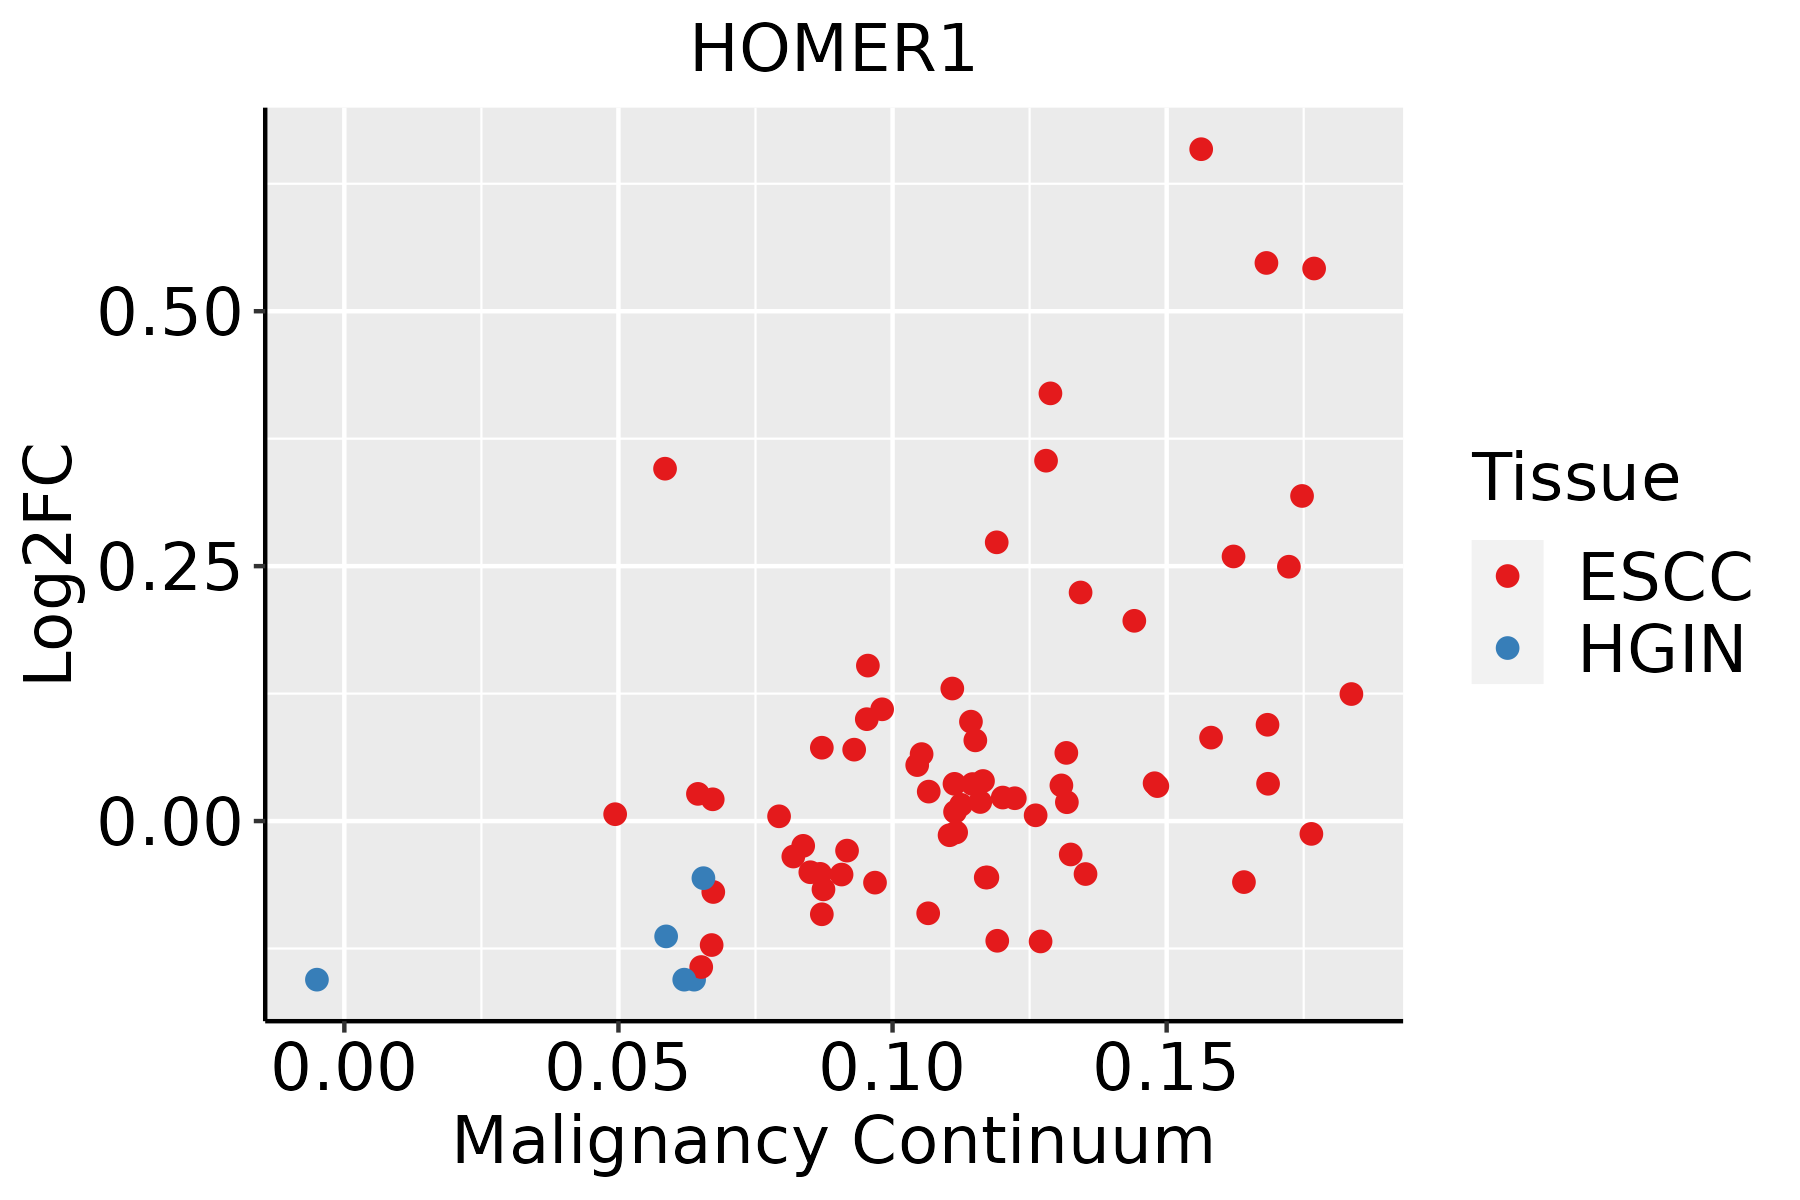 | ESCC: Esophageal squamous cell carcinoma |
| HGIN: High-grade intraepithelial neoplasias | ||
| LGIN: Low-grade intraepithelial neoplasias | ||
| Lung |  | AAH: Atypical adenomatous hyperplasia |
| AIS: Adenocarcinoma in situ | ||
| IAC: Invasive lung adenocarcinoma | ||
| MIA: Minimally invasive adenocarcinoma | ||
| Prostate | 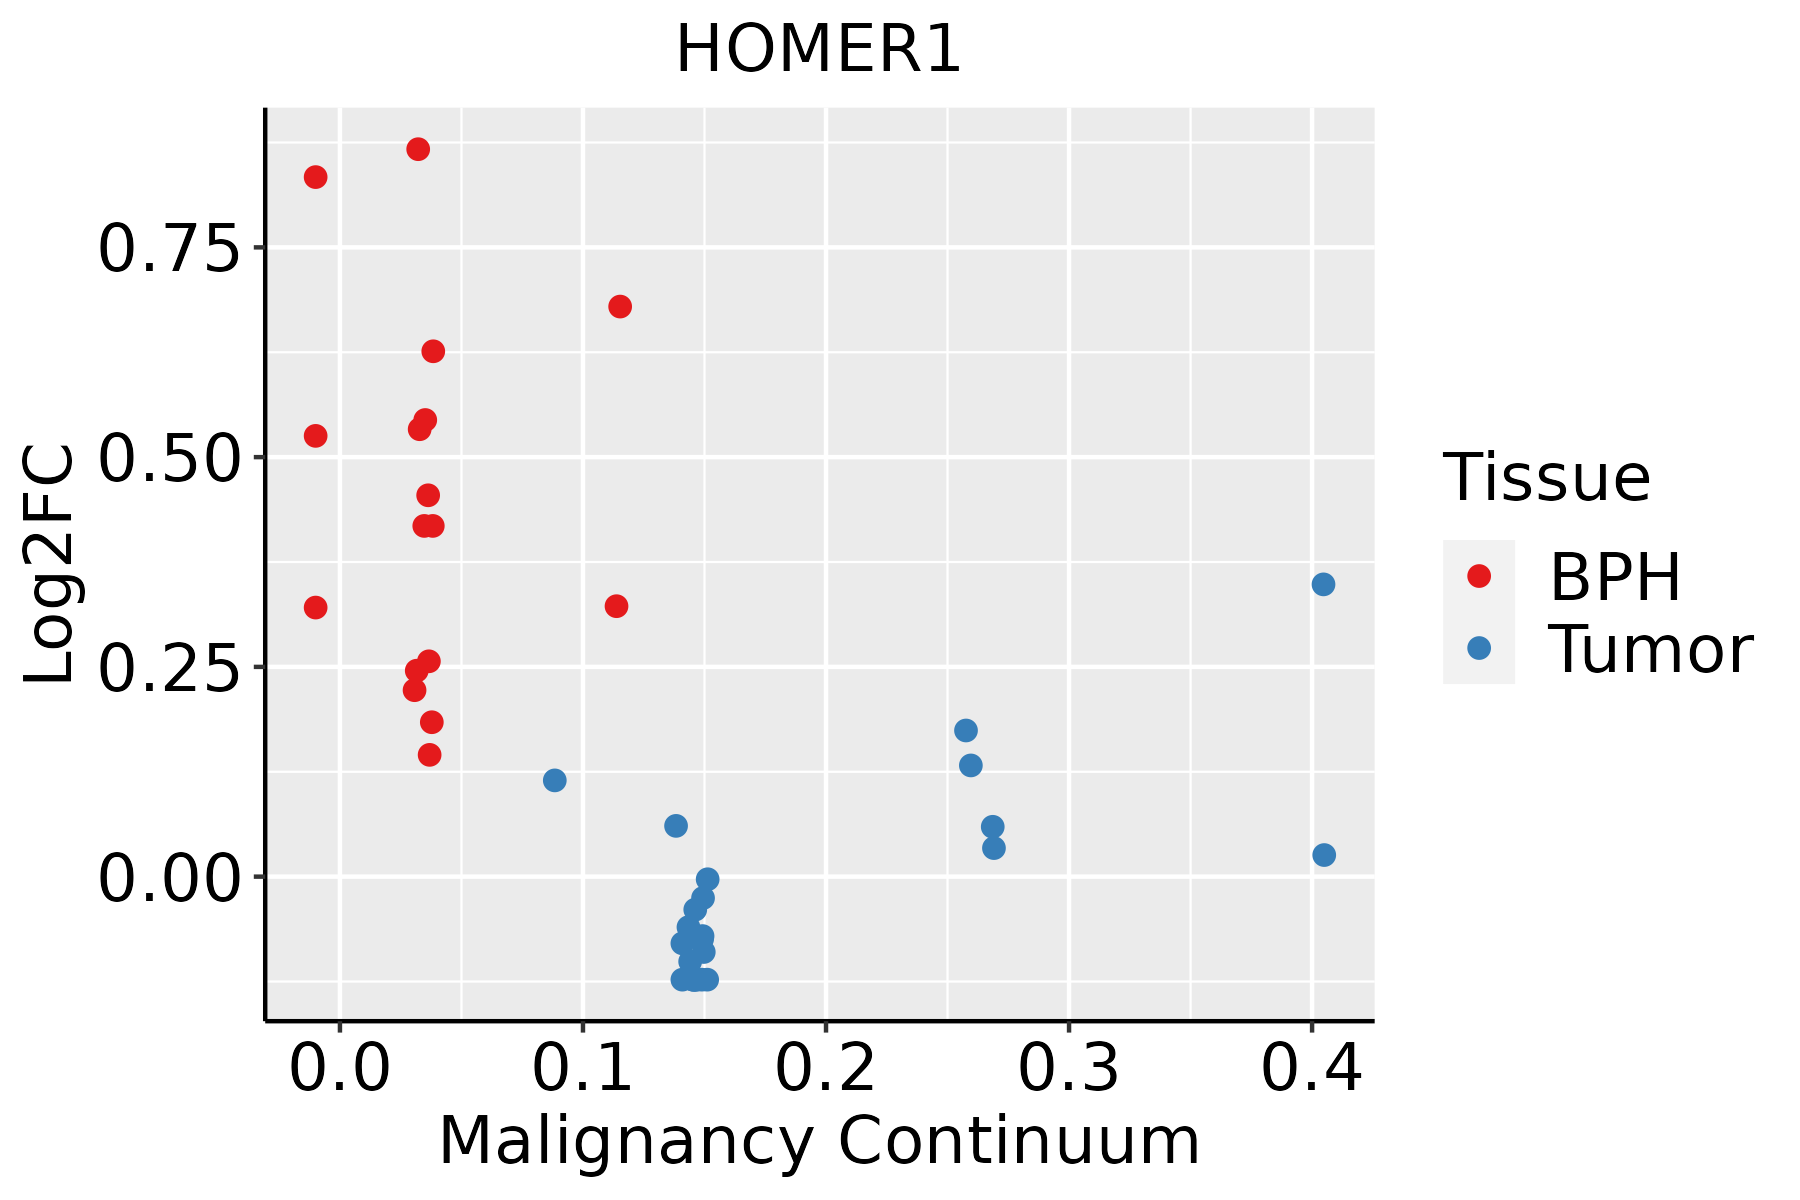 | BPH: Benign Prostatic Hyperplasia |
| ∗log2FC in expression of this searched gene in stem-like cells from each diseased tissue sample relative to stem-like cells in normal samples in each tissue plotted against the malignancy continuum. Samples are colored based on if they are from different disease stage. |
Top |
Malignant transformation related pathway analysis |
| Find out the enriched GO biological processes and KEGG pathways involved in transition from healthy to precancer to cancer |
| Tissue | Disease Stage | Enriched GO biological Processes |
| Colorectum | AD |  |
| Colorectum | SER |  |
| Colorectum | MSS |  |
| Colorectum | MSI-H |  |
| Colorectum | FAP |  |
| ∗Top 15 enriched GO BP terms are showed in the bar plot of each disease state in each tissue. Each row represents a significant GO biological process which is colored according to the -log10(p.adjust). |
| Page: 1 2 3 4 5 6 7 8 9 |
| GO ID | Tissue | Disease Stage | Description | Gene Ratio | Bg Ratio | pvalue | p.adjust | Count |
| GO:00605376 | Endometrium | AEH | muscle tissue development | 83/2100 | 403/18723 | 2.57e-08 | 1.50e-06 | 83 |
| GO:00147065 | Endometrium | AEH | striated muscle tissue development | 75/2100 | 384/18723 | 1.06e-06 | 3.62e-05 | 75 |
| GO:00030126 | Endometrium | AEH | muscle system process | 78/2100 | 452/18723 | 6.89e-05 | 1.06e-03 | 78 |
| GO:00075174 | Endometrium | AEH | muscle organ development | 60/2100 | 327/18723 | 8.19e-05 | 1.22e-03 | 60 |
| GO:00426925 | Endometrium | AEH | muscle cell differentiation | 68/2100 | 384/18723 | 8.88e-05 | 1.30e-03 | 68 |
| GO:001003816 | Endometrium | AEH | response to metal ion | 65/2100 | 373/18723 | 2.02e-04 | 2.54e-03 | 65 |
| GO:000189410 | Endometrium | AEH | tissue homeostasis | 50/2100 | 268/18723 | 2.04e-04 | 2.54e-03 | 50 |
| GO:00511465 | Endometrium | AEH | striated muscle cell differentiation | 51/2100 | 283/18723 | 4.20e-04 | 4.46e-03 | 51 |
| GO:00602499 | Endometrium | AEH | anatomical structure homeostasis | 55/2100 | 314/18723 | 5.27e-04 | 5.32e-03 | 55 |
| GO:0006936 | Endometrium | AEH | muscle contraction | 59/2100 | 347/18723 | 7.32e-04 | 6.99e-03 | 59 |
| GO:00439546 | Endometrium | AEH | cellular component maintenance | 16/2100 | 61/18723 | 8.71e-04 | 8.04e-03 | 16 |
| GO:00109597 | Endometrium | AEH | regulation of metal ion transport | 66/2100 | 406/18723 | 1.24e-03 | 1.07e-02 | 66 |
| GO:00508086 | Endometrium | AEH | synapse organization | 67/2100 | 426/18723 | 2.67e-03 | 1.94e-02 | 67 |
| GO:00515927 | Endometrium | AEH | response to calcium ion | 28/2100 | 149/18723 | 4.22e-03 | 2.79e-02 | 28 |
| GO:00605382 | Endometrium | AEH | skeletal muscle organ development | 30/2100 | 166/18723 | 5.64e-03 | 3.46e-02 | 30 |
| GO:00228986 | Endometrium | AEH | regulation of transmembrane transporter activity | 45/2100 | 278/18723 | 7.34e-03 | 4.18e-02 | 45 |
| GO:00075193 | Endometrium | AEH | skeletal muscle tissue development | 28/2100 | 155/18723 | 7.35e-03 | 4.19e-02 | 28 |
| GO:19040623 | Endometrium | AEH | regulation of cation transmembrane transport | 55/2100 | 357/18723 | 9.18e-03 | 4.96e-02 | 55 |
| GO:006053713 | Endometrium | EEC | muscle tissue development | 82/2168 | 403/18723 | 2.14e-07 | 9.38e-06 | 82 |
| GO:001470612 | Endometrium | EEC | striated muscle tissue development | 74/2168 | 384/18723 | 6.64e-06 | 1.57e-04 | 74 |
| Page: 1 2 3 4 5 6 7 |
| Pathway ID | Tissue | Disease Stage | Description | Gene Ratio | Bg Ratio | pvalue | p.adjust | qvalue | Count |
| hsa040689 | Esophagus | ESCC | FoxO signaling pathway | 89/4205 | 131/8465 | 1.56e-05 | 7.98e-05 | 4.09e-05 | 89 |
| hsa0406814 | Esophagus | ESCC | FoxO signaling pathway | 89/4205 | 131/8465 | 1.56e-05 | 7.98e-05 | 4.09e-05 | 89 |
| hsa040686 | Lung | IAC | FoxO signaling pathway | 29/1053 | 131/8465 | 1.25e-03 | 8.24e-03 | 5.47e-03 | 29 |
| hsa0406811 | Lung | IAC | FoxO signaling pathway | 29/1053 | 131/8465 | 1.25e-03 | 8.24e-03 | 5.47e-03 | 29 |
| hsa0406821 | Lung | AIS | FoxO signaling pathway | 25/961 | 131/8465 | 6.07e-03 | 2.94e-02 | 1.88e-02 | 25 |
| hsa0406831 | Lung | AIS | FoxO signaling pathway | 25/961 | 131/8465 | 6.07e-03 | 2.94e-02 | 1.88e-02 | 25 |
| hsa040687 | Prostate | BPH | FoxO signaling pathway | 54/1718 | 131/8465 | 3.05e-08 | 3.59e-07 | 2.22e-07 | 54 |
| hsa0406812 | Prostate | BPH | FoxO signaling pathway | 54/1718 | 131/8465 | 3.05e-08 | 3.59e-07 | 2.22e-07 | 54 |
| hsa0406822 | Prostate | Tumor | FoxO signaling pathway | 54/1791 | 131/8465 | 1.32e-07 | 1.51e-06 | 9.36e-07 | 54 |
| hsa0406832 | Prostate | Tumor | FoxO signaling pathway | 54/1791 | 131/8465 | 1.32e-07 | 1.51e-06 | 9.36e-07 | 54 |
| Page: 1 |
Top |
Cell-cell communication analysis |
| Identification of potential cell-cell interactions between two cell types and their ligand-receptor pairs for different disease states |
| Ligand | Receptor | LRpair | Pathway | Tissue | Disease Stage |
| Page: 1 |
Top |
Single-cell gene regulatory network inference analysis |
| Find out the significant the regulons (TFs) and the target genes of each regulon across cell types for different disease states |
| TF | Cell Type | Tissue | Disease Stage | Target Gene | RSS | Regulon Activity |
| ∗The dot plots of a searched regulon are shown for all cell subpopulations in each disease state of each tissue based on the regulon specific score inferred using pySCENIC and by calculating the average expression. |
| Page: 1 |
Top |
Somatic mutation of malignant transformation related genes |
| Annotation of somatic variants for genes involved in malignant transformation |
| Hugo Symbol | Variant Class | Variant Classification | dbSNP RS | HGVSc | HGVSp | HGVSp Short | SWISSPROT | BIOTYPE | SIFT | PolyPhen | Tumor Sample Barcode | Tissue | Histology | Sex | Age | Stage | Therapy Types | Drugs | Outcome |
| HOMER1 | SNV | Missense_Mutation | rs775050034 | c.29N>A | p.Arg10Gln | p.R10Q | Q86YM7 | protein_coding | deleterious(0) | probably_damaging(0.964) | TCGA-AN-A046-01 | Breast | breast invasive carcinoma | Female | >=65 | I/II | Unknown | Unknown | SD |
| HOMER1 | SNV | Missense_Mutation | rs764225948 | c.566N>A | p.Thr189Asn | p.T189N | Q86YM7 | protein_coding | deleterious(0.03) | possibly_damaging(0.557) | TCGA-BH-A0BG-01 | Breast | breast invasive carcinoma | Female | >=65 | I/II | Unknown | Unknown | SD |
| HOMER1 | SNV | Missense_Mutation | c.379C>G | p.Pro127Ala | p.P127A | Q86YM7 | protein_coding | tolerated(1) | benign(0) | TCGA-BH-A0H7-01 | Breast | breast invasive carcinoma | Female | >=65 | III/IV | Chemotherapy | doxorubicin | SD | |
| HOMER1 | SNV | Missense_Mutation | rs781650763 | c.967C>T | p.Arg323Cys | p.R323C | Q86YM7 | protein_coding | deleterious(0) | possibly_damaging(0.836) | TCGA-D8-A1XV-01 | Breast | breast invasive carcinoma | Female | >=65 | I/II | Unknown | Unknown | SD |
| HOMER1 | SNV | Missense_Mutation | c.350N>T | p.Ser117Leu | p.S117L | Q86YM7 | protein_coding | deleterious(0) | benign(0.301) | TCGA-EK-A2R7-01 | Cervix | cervical & endocervical cancer | Female | <65 | I/II | Unknown | Unknown | SD | |
| HOMER1 | SNV | Missense_Mutation | c.270N>A | p.Phe90Leu | p.F90L | Q86YM7 | protein_coding | deleterious(0) | possibly_damaging(0.832) | TCGA-AA-3510-01 | Colorectum | colon adenocarcinoma | Male | >=65 | I/II | Unknown | Unknown | SD | |
| HOMER1 | SNV | Missense_Mutation | c.538N>G | p.Ser180Gly | p.S180G | Q86YM7 | protein_coding | tolerated(0.3) | benign(0) | TCGA-AA-3672-01 | Colorectum | colon adenocarcinoma | Female | >=65 | III/IV | Unknown | Unknown | SD | |
| HOMER1 | SNV | Missense_Mutation | c.76C>T | p.Pro26Ser | p.P26S | Q86YM7 | protein_coding | deleterious(0.01) | probably_damaging(1) | TCGA-AA-A01R-01 | Colorectum | colon adenocarcinoma | Male | <65 | III/IV | Chemotherapy | 5-fluorouracil | PD | |
| HOMER1 | SNV | Missense_Mutation | c.380N>A | p.Pro127His | p.P127H | Q86YM7 | protein_coding | tolerated(0.59) | benign(0.001) | TCGA-G4-6309-01 | Colorectum | colon adenocarcinoma | Female | <65 | III/IV | Chemotherapy | xeloda | PD | |
| HOMER1 | SNV | Missense_Mutation | c.316T>G | p.Phe106Val | p.F106V | Q86YM7 | protein_coding | tolerated(1) | benign(0.058) | TCGA-AG-A002-01 | Colorectum | rectum adenocarcinoma | Male | <65 | I/II | Unknown | Unknown | SD |
| Page: 1 2 3 4 |
Top |
Related drugs of malignant transformation related genes |
| Identification of chemicals and drugs interact with genes involved in malignant transfromation |
| (DGIdb 4.0) |
| Entrez ID | Symbol | Category | Interaction Types | Drug Claim Name | Drug Name | PMIDs |
| 9456 | HOMER1 | KINASE | levodopa | LEVODOPA | 24126708 | |
| 9456 | HOMER1 | KINASE | haloperidol | HALOPERIDOL | 27023437 |
| Page: 1 |

Copyright 2023-Present -The University of Texas Health Science Center at Houston |