Schematic overview of the cellular and molecular mechanisms involved in the cancer progression, including the proposed cellular and molecular mechanisms in cancer cells trajectory. AT1: alveolar type 1 cells; AT2: alveolar type 2 cells; AAH: atypical adenomatous hyperplasia; AIS: adenocarcinoma in situ; MIA: minimally invasive adenocarcinoma; IA: invasive adenocarcinoma; EMT: epithelial-mesenchymal transition

Home

Download

Statistics

Help

Contact

Center for Computational Systems Medicine
leaf

Gene summary

leaf

Malignant transformation analysis

leaf

Malignant transformation related pathway analysis

leaf

Cell-cell communication analysis

leaf

Single-cell gene regulatory network inference analysis

leaf

Somatic mutation of malignant transformation related genes

leaf

Related drugs of malignant transformation related genes

Gene: HNRNPR

Gene summary for HNRNPR

check button Gene summary.

Gene informationSpeciesHuman
Gene symbol

HNRNPR

Gene ID

10236

Gene nameheterogeneous nuclear ribonucleoprotein R
Gene AliasHNRPR
Cytomap1p36.12
Gene Typeprotein-coding
GO ID

GO:0000375

UniProtAcc

Q0VGD6


Top

Malignant transformation analysis

check button Identification of the aberrant gene expression in precancerous and cancerous lesions by comparing the gene expression of stem-like cells in diseased tissues with normal stem cells
check button Malignant transformation involving gene list.
Entrez IDSymbolReplicatesSpeciesOrganTissueAdj P-valueLog2FCMalignancy
10236HNRNPRHTA11_3410_2000001011HumanColorectumAD4.73e-04-3.71e-010.0155
10236HNRNPRHTA11_99999965104_69814HumanColorectumMSS1.42e-097.10e-010.281
10236HNRNPRA015-C-203HumanColorectumFAP2.58e-25-2.22e-01-0.1294
10236HNRNPRA015-C-204HumanColorectumFAP2.33e-03-1.27e-01-0.0228
10236HNRNPRA002-C-201HumanColorectumFAP2.57e-06-1.68e-010.0324
10236HNRNPRA002-C-203HumanColorectumFAP4.98e-03-1.23e-010.2786
10236HNRNPRA001-C-108HumanColorectumFAP2.34e-15-8.93e-02-0.0272
10236HNRNPRA002-C-205HumanColorectumFAP2.20e-14-1.34e-01-0.1236
10236HNRNPRA015-C-006HumanColorectumFAP4.75e-131.81e-01-0.0994
10236HNRNPRA015-C-106HumanColorectumFAP3.26e-09-1.42e-01-0.0511
10236HNRNPRA002-C-114HumanColorectumFAP1.62e-11-2.18e-01-0.1561
10236HNRNPRA015-C-104HumanColorectumFAP3.76e-27-1.00e-01-0.1899
10236HNRNPRA001-C-014HumanColorectumFAP4.05e-11-6.85e-020.0135
10236HNRNPRA002-C-016HumanColorectumFAP7.47e-16-1.93e-010.0521
10236HNRNPRA015-C-002HumanColorectumFAP2.27e-07-1.95e-01-0.0763
10236HNRNPRA001-C-203HumanColorectumFAP1.05e-052.28e-02-0.0481
10236HNRNPRA002-C-116HumanColorectumFAP4.47e-24-1.35e-01-0.0452
10236HNRNPRA014-C-008HumanColorectumFAP3.30e-093.21e-02-0.191
10236HNRNPRA018-E-020HumanColorectumFAP7.97e-13-2.10e-01-0.2034
10236HNRNPRF034HumanColorectumFAP3.61e-139.08e-03-0.0665
Page: 1 2 3 4 5 6 7 8 9 10 11 

check button Transcriptomic changes along malignancy continuum.
TissueExpression DynamicsAbbreviation
Colorectum (GSE201348)The image shows the transcriptomic changes along malignancy continuum.log2FC in expression of this searched gene in stem-like cells from each diseased tissue sample relative to stem-like cells in normal samples in each tissue plotted against the malignancy continuum. Samples are colored based on if they are from different disease stage.FAP: Familial adenomatous polyposis
CRC: Colorectal cancer
Colorectum (HTA11)The image shows the transcriptomic changes along malignancy continuum.log2FC in expression of this searched gene in stem-like cells from each diseased tissue sample relative to stem-like cells in normal samples in each tissue plotted against the malignancy continuum. Samples are colored based on if they are from different disease stage.AD: Adenomas
SER: Sessile serrated lesions
MSI-H: Microsatellite-high colorectal cancer
MSS: Microsatellite stable colorectal cancer
EndometriumThe image shows the transcriptomic changes along malignancy continuum.log2FC in expression of this searched gene in stem-like cells from each diseased tissue sample relative to stem-like cells in normal samples in each tissue plotted against the malignancy continuum. Samples are colored based on if they are from different disease stage.
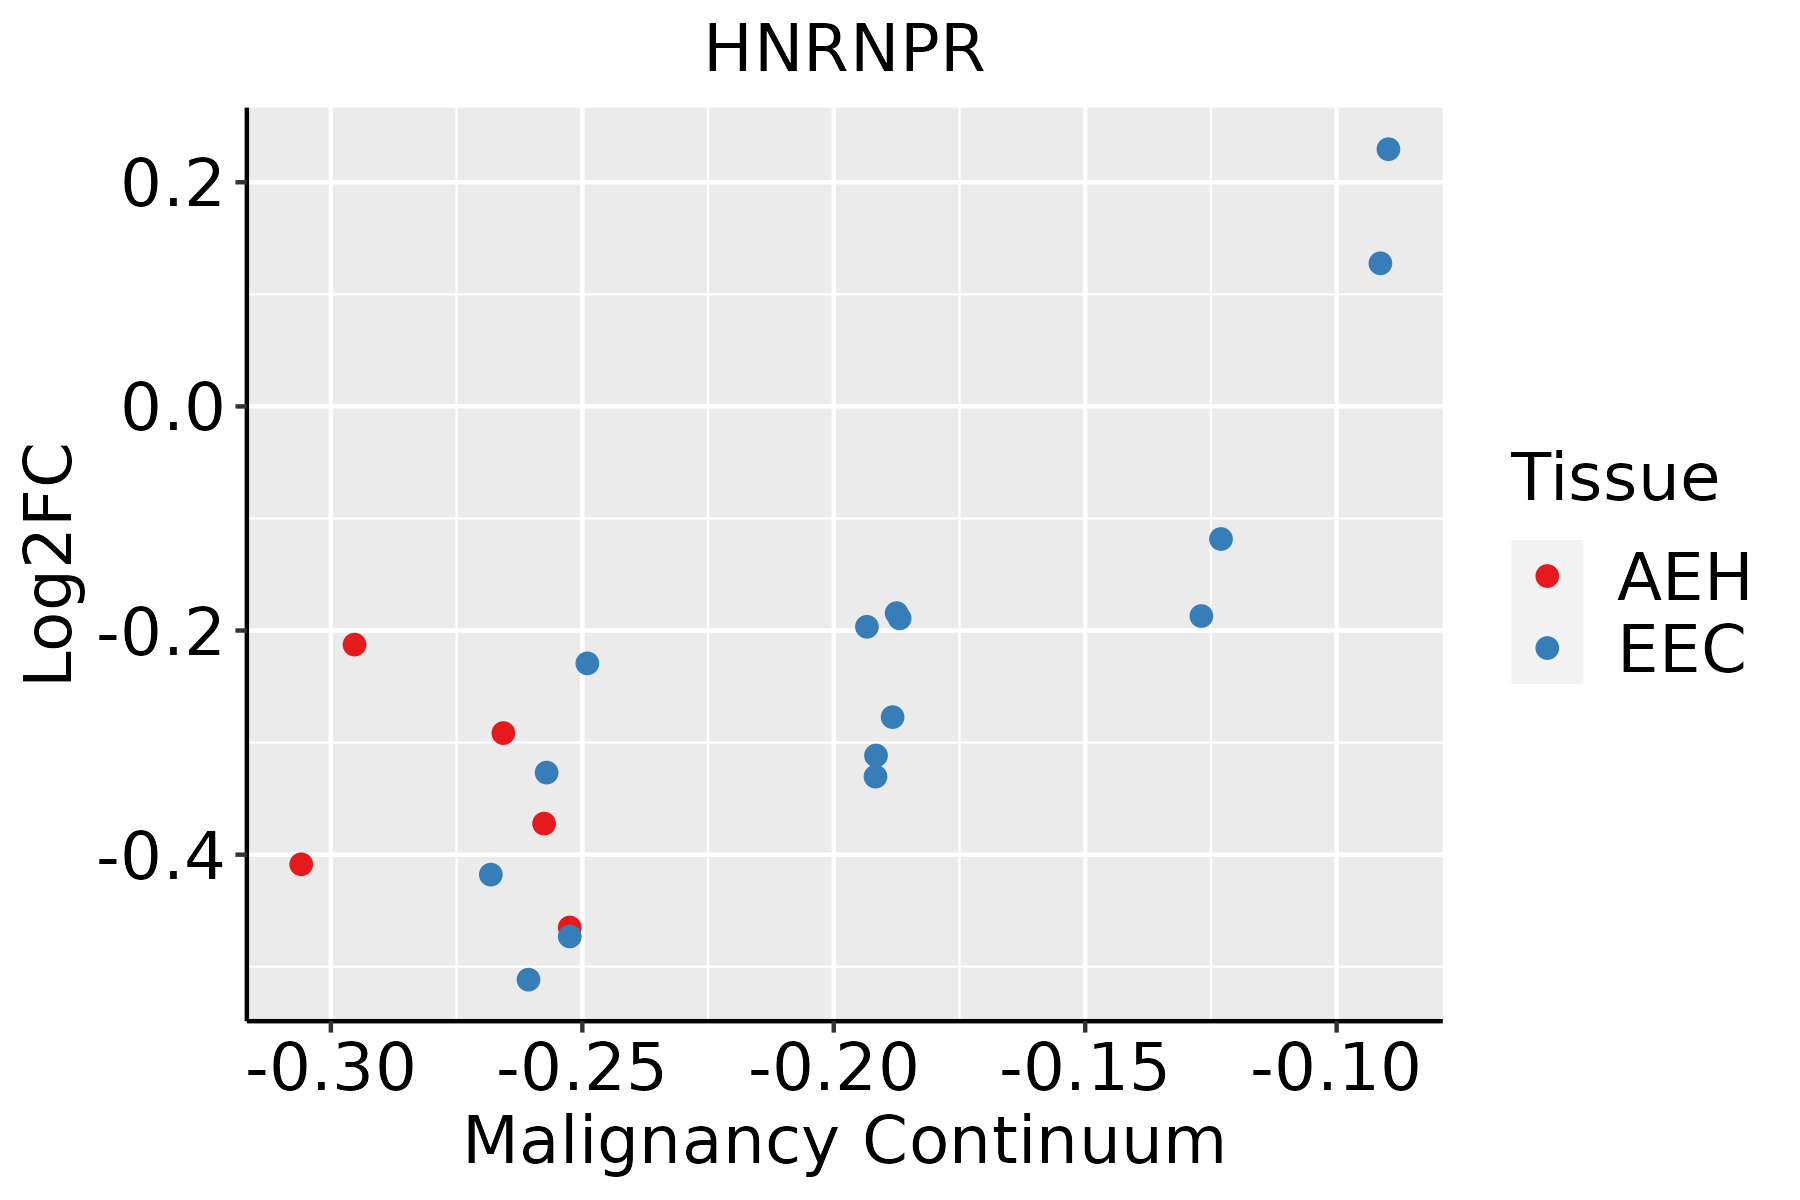
AEH: Atypical endometrial hyperplasia
EEC: Endometrioid Cancer
EsophagusThe image shows the transcriptomic changes along malignancy continuum.log2FC in expression of this searched gene in stem-like cells from each diseased tissue sample relative to stem-like cells in normal samples in each tissue plotted against the malignancy continuum. Samples are colored based on if they are from different disease stage.
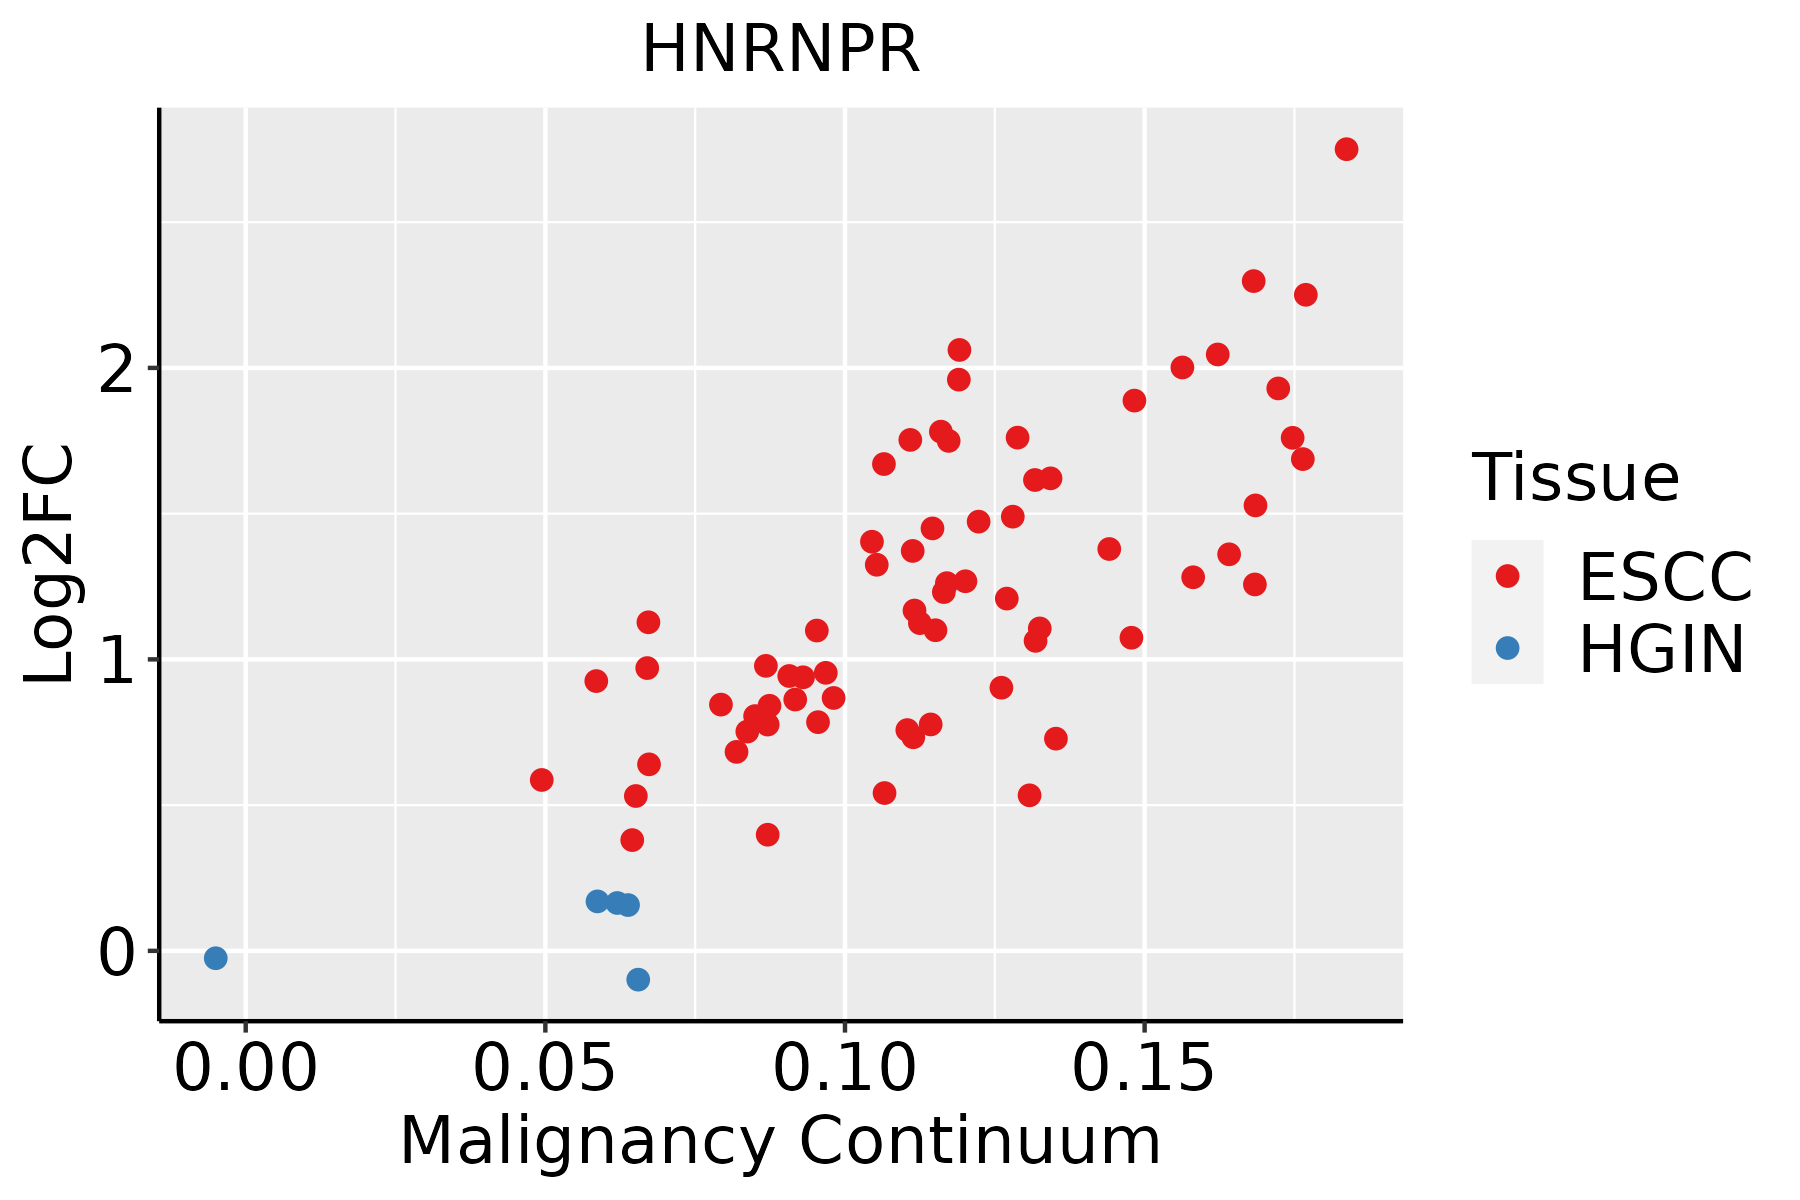
ESCC: Esophageal squamous cell carcinoma
HGIN: High-grade intraepithelial neoplasias
LGIN: Low-grade intraepithelial neoplasias
LiverThe image shows the transcriptomic changes along malignancy continuum.log2FC in expression of this searched gene in stem-like cells from each diseased tissue sample relative to stem-like cells in normal samples in each tissue plotted against the malignancy continuum. Samples are colored based on if they are from different disease stage.
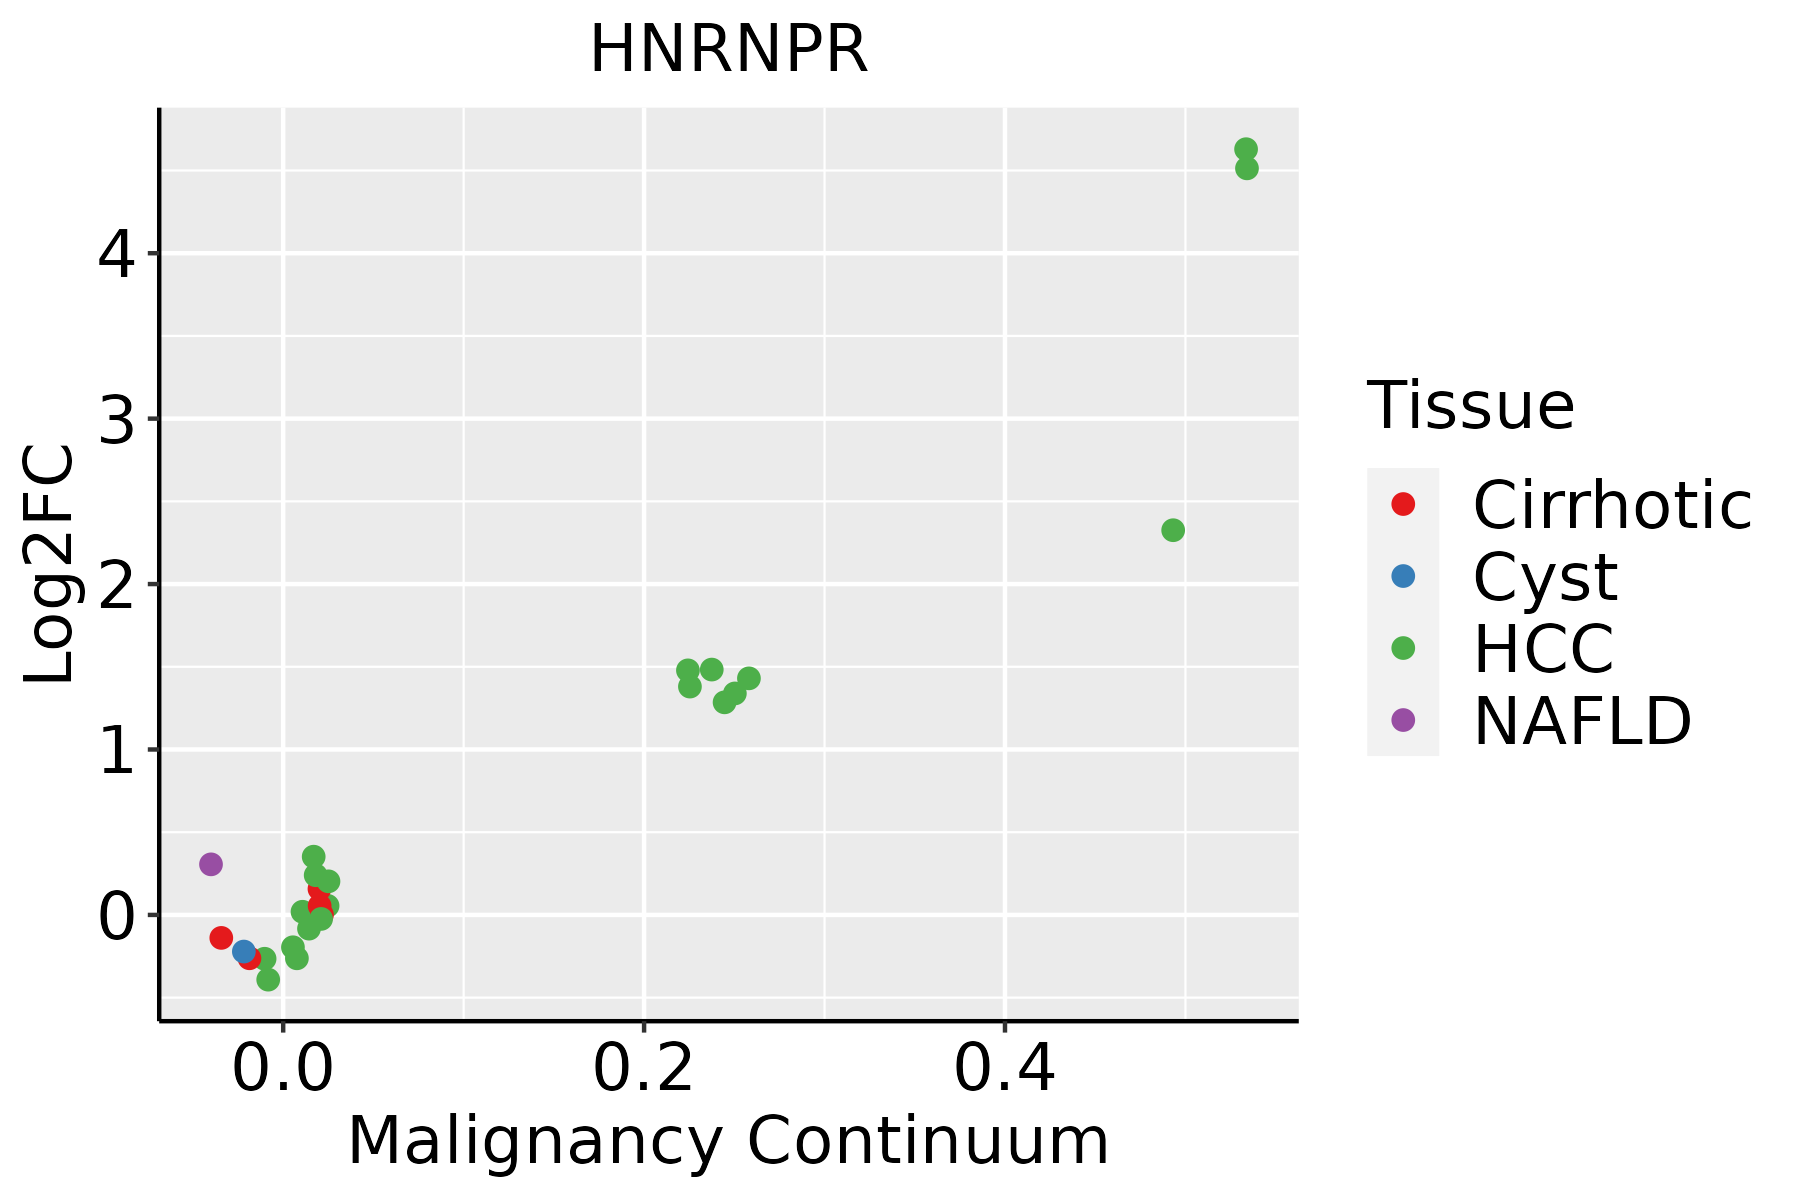
HCC: Hepatocellular carcinoma
NAFLD: Non-alcoholic fatty liver disease
Oral CavityThe image shows the transcriptomic changes along malignancy continuum.log2FC in expression of this searched gene in stem-like cells from each diseased tissue sample relative to stem-like cells in normal samples in each tissue plotted against the malignancy continuum. Samples are colored based on if they are from different disease stage.
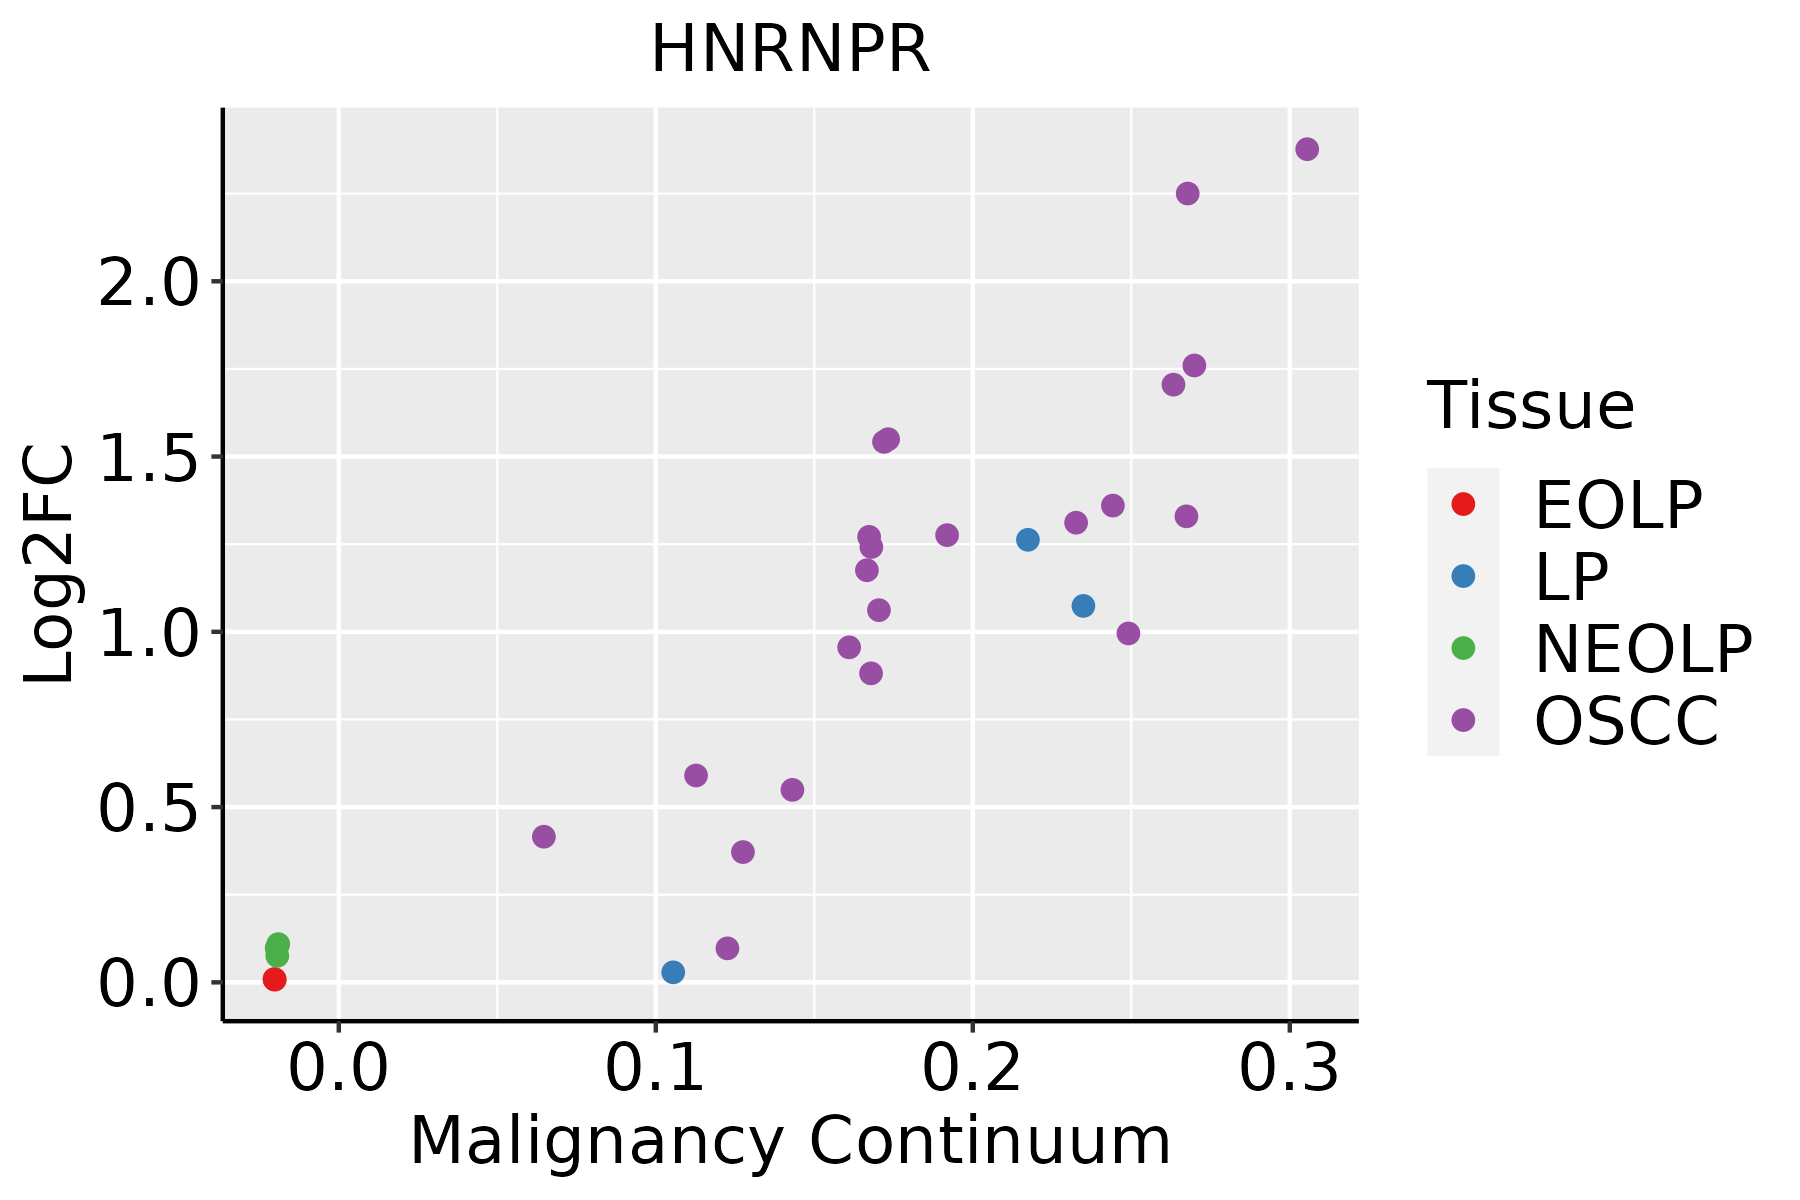
EOLP: Erosive Oral lichen planus
LP: leukoplakia
NEOLP: Non-erosive oral lichen planus
OSCC: Oral squamous cell carcinoma
ProstateThe image shows the transcriptomic changes along malignancy continuum.log2FC in expression of this searched gene in stem-like cells from each diseased tissue sample relative to stem-like cells in normal samples in each tissue plotted against the malignancy continuum. Samples are colored based on if they are from different disease stage.
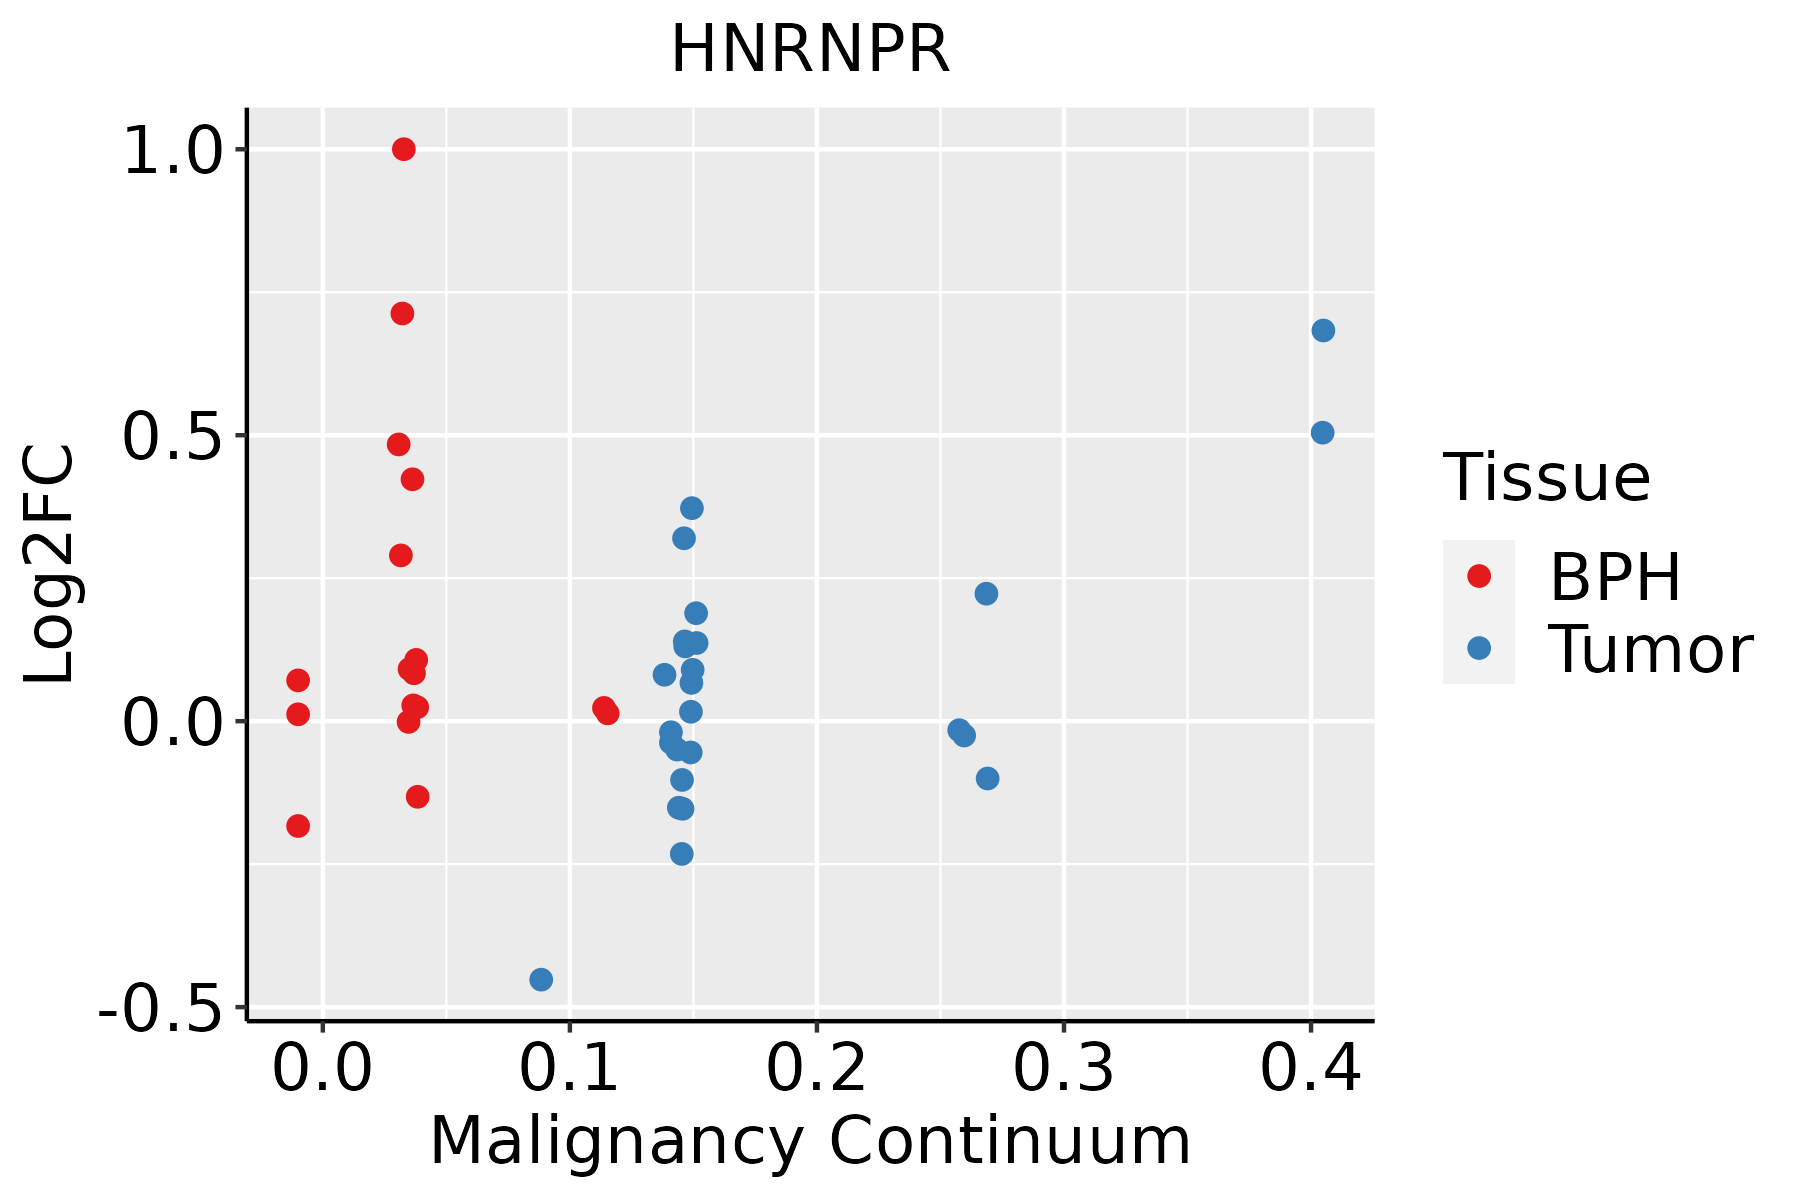
BPH: Benign Prostatic Hyperplasia
SkinThe image shows the transcriptomic changes along malignancy continuum.log2FC in expression of this searched gene in stem-like cells from each diseased tissue sample relative to stem-like cells in normal samples in each tissue plotted against the malignancy continuum. Samples are colored based on if they are from different disease stage.
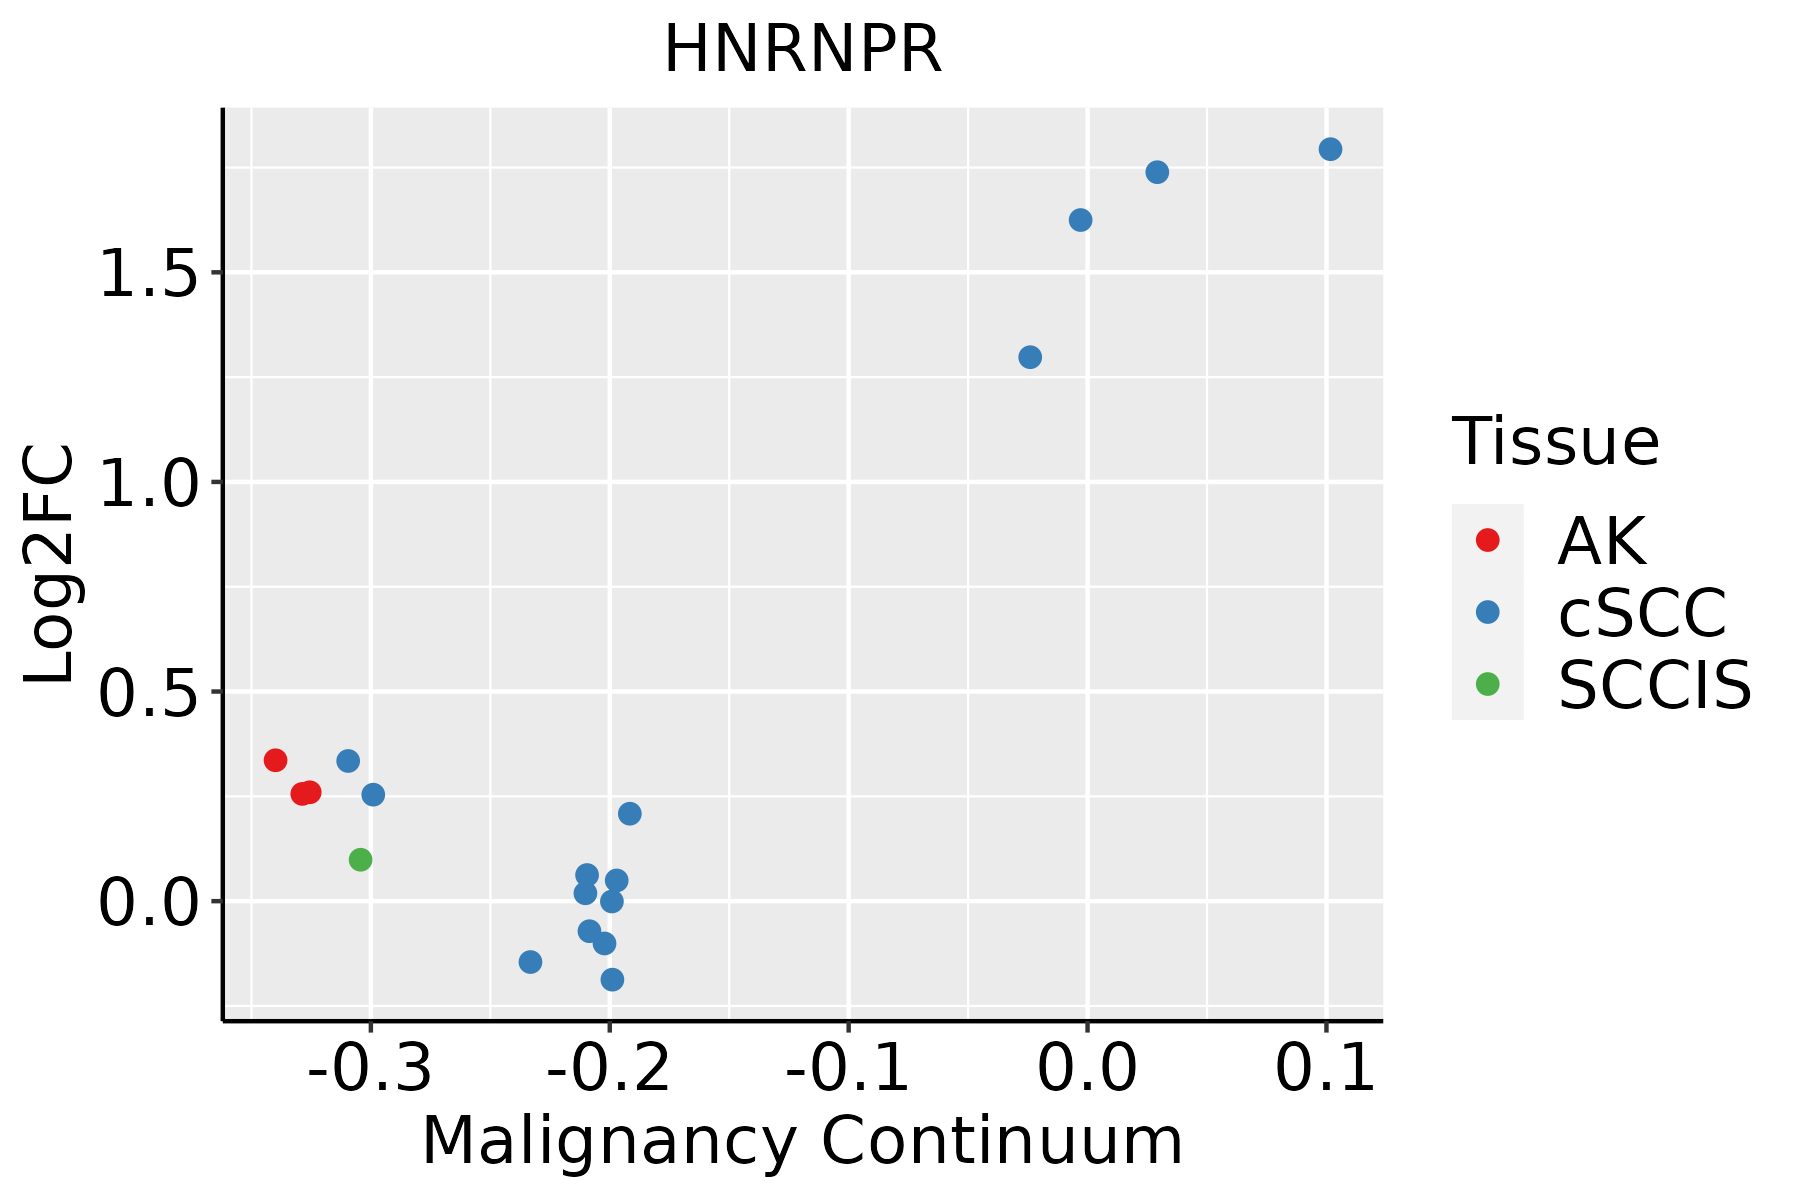
AK: Actinic keratosis
cSCC: Cutaneous squamous cell carcinoma
SCCIS:squamous cell carcinoma in situ
ThyroidThe image shows the transcriptomic changes along malignancy continuum.log2FC in expression of this searched gene in stem-like cells from each diseased tissue sample relative to stem-like cells in normal samples in each tissue plotted against the malignancy continuum. Samples are colored based on if they are from different disease stage.
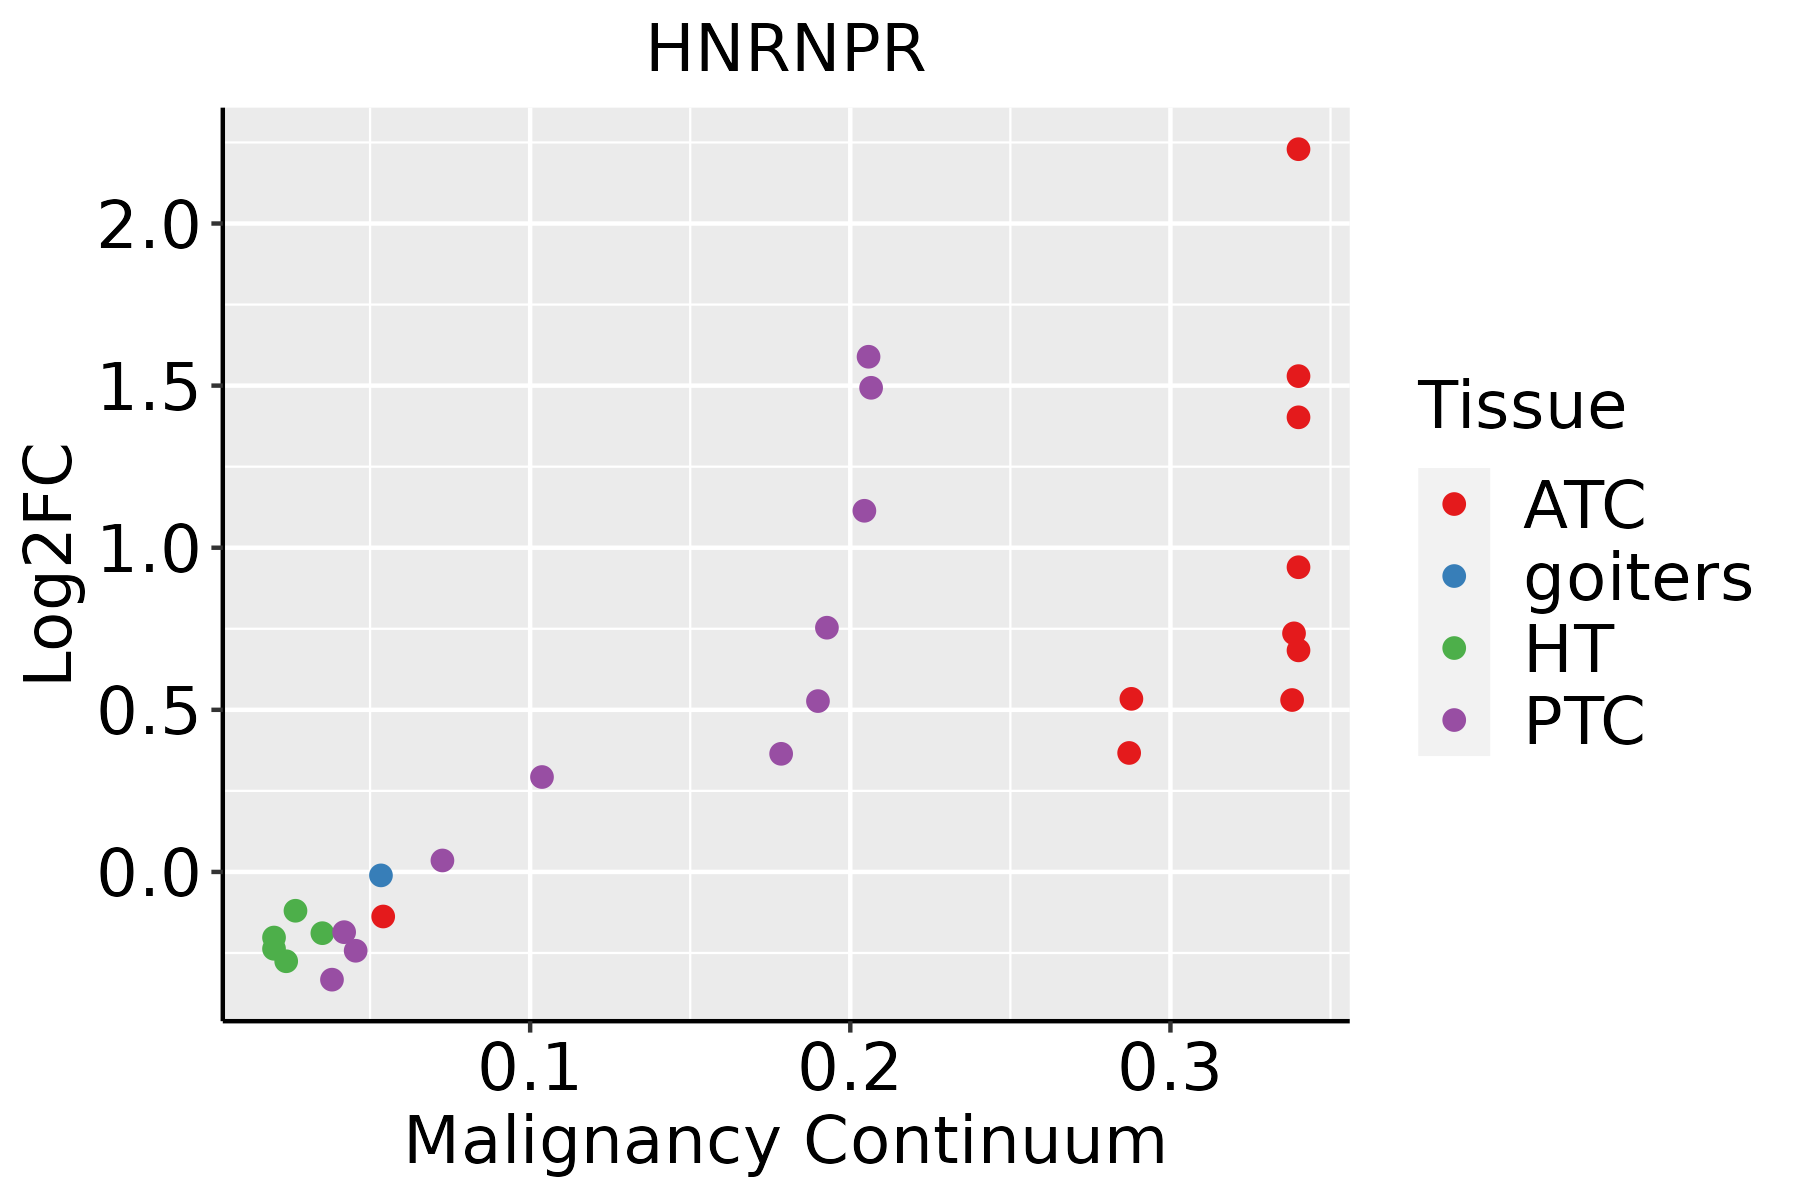
ATC: Anaplastic thyroid cancer
HT: Hashimoto's thyroiditis
PTC: Papillary thyroid cancer
∗log2FC in expression of this searched gene in stem-like cells from each diseased tissue sample relative to stem-like cells in normal samples in each tissue plotted against the malignancy continuum. Samples are colored based on if they are from different disease stage.

Top

Malignant transformation related pathway analysis

check buttonFind out the enriched GO biological processes and KEGG pathways involved in transition from healthy to precancer to cancer
check button Figure of enriched GO biological processes.
TissueDisease StageEnriched GO biological Processes
ColorectumADGO analysis - Figure of enriched GO biological processes: Top 15 enriched GO BP terms are showed in the bar plot of each disease state in each tissue. Each row represents a significant GO biological process which is colored according to the -log10(p.adjust).
ColorectumSERGO analysis - Figure of enriched GO biological processes: Top 15 enriched GO BP terms are showed in the bar plot of each disease state in each tissue. Each row represents a significant GO biological process which is colored according to the -log10(p.adjust).
ColorectumMSSGO analysis - Figure of enriched GO biological processes: Top 15 enriched GO BP terms are showed in the bar plot of each disease state in each tissue. Each row represents a significant GO biological process which is colored according to the -log10(p.adjust).
ColorectumMSI-HGO analysis - Figure of enriched GO biological processes: Top 15 enriched GO BP terms are showed in the bar plot of each disease state in each tissue. Each row represents a significant GO biological process which is colored according to the -log10(p.adjust).
ColorectumFAPGO analysis - Figure of enriched GO biological processes: Top 15 enriched GO BP terms are showed in the bar plot of each disease state in each tissue. Each row represents a significant GO biological process which is colored according to the -log10(p.adjust).
∗Top 15 enriched GO BP terms are showed in the bar plot of each disease state in each tissue. Each row represents a significant GO biological process which is colored according to the -log10(p.adjust).
Page: 1 2 3 4 5 6 7 8 9 

check button Enriched GO biological processes.
GO IDTissueDisease StageDescriptionGene RatioBg Ratiopvaluep.adjustCount
GO:0008380ColorectumADRNA splicing169/3918434/187233.59e-182.04e-15169
GO:0009896ColorectumADpositive regulation of catabolic process180/3918492/187234.33e-161.94e-13180
GO:0000377ColorectumADRNA splicing, via transesterification reactions with bulged adenosine as nucleophile130/3918320/187235.88e-162.16e-13130
GO:0000398ColorectumADmRNA splicing, via spliceosome130/3918320/187235.88e-162.16e-13130
GO:0000375ColorectumADRNA splicing, via transesterification reactions131/3918324/187237.11e-162.22e-13131
GO:1903311ColorectumADregulation of mRNA metabolic process117/3918288/187231.69e-144.23e-12117
GO:0031331ColorectumADpositive regulation of cellular catabolic process156/3918427/187234.68e-141.05e-11156
GO:0006401ColorectumADRNA catabolic process102/3918278/187238.64e-106.76e-08102
GO:0044270ColorectumADcellular nitrogen compound catabolic process147/3918451/187233.35e-092.23e-07147
GO:0046700ColorectumADheterocycle catabolic process145/3918445/187234.37e-092.84e-07145
GO:0006402ColorectumADmRNA catabolic process87/3918232/187234.40e-092.84e-0787
GO:0034655ColorectumADnucleobase-containing compound catabolic process133/3918407/187231.56e-089.12e-07133
GO:0019439ColorectumADaromatic compound catabolic process146/3918467/187237.48e-083.84e-06146
GO:1901361ColorectumADorganic cyclic compound catabolic process153/3918495/187238.23e-084.18e-06153
GO:0061013ColorectumADregulation of mRNA catabolic process64/3918166/187231.44e-076.59e-0664
GO:0043487ColorectumADregulation of RNA stability63/3918170/187239.17e-073.12e-0563
GO:0006417ColorectumADregulation of translation141/3918468/187231.32e-064.22e-05141
GO:0043488ColorectumADregulation of mRNA stability59/3918158/187231.50e-064.66e-0559
GO:0007623ColorectumADcircadian rhythm72/3918210/187234.50e-061.21e-0472
GO:0048511ColorectumADrhythmic process94/3918298/187231.00e-052.34e-0494
Page: 1 2 3 4 5 6 7 8 9 10 11 12 13 14 15 16 17 18 19 20 21 22 23 24 25 26 

check button Enriched KEGG pathways.
Pathway IDTissueDisease StageDescriptionGene RatioBg Ratiopvaluep.adjustqvalueCount
Page: 1 

Top

Cell-cell communication analysis

check buttonIdentification of potential cell-cell interactions between two cell types and their ligand-receptor pairs for different disease states
LigandReceptorLRpairPathwayTissueDisease Stage
Page: 1 

Top

Single-cell gene regulatory network inference analysis

check buttonFind out the significant the regulons (TFs) and the target genes of each regulon across cell types for different disease states
TFCell TypeTissueDisease StageTarget GeneRSSRegulon Activity
∗The dot plots of a searched regulon are shown for all cell subpopulations in each disease state of each tissue based on the regulon specific score inferred using pySCENIC and by calculating the average expression.
Page: 1 

Top

Somatic mutation of malignant transformation related genes

check buttonAnnotation of somatic variants for genes involved in malignant transformation
Hugo SymbolVariant ClassVariant ClassificationdbSNP RSHGVScHGVSpHGVSp ShortSWISSPROTBIOTYPESIFTPolyPhenTumor Sample BarcodeTissueHistologySexAgeStageTherapy TypesDrugsOutcome
HNRNPRSNVMissense_Mutationnovelc.565G>Ap.Gly189Argp.G189RO43390protein_codingdeleterious(0)probably_damaging(1)TCGA-AN-A046-01Breastbreast invasive carcinomaFemale>=65I/IIUnknownUnknownSD
HNRNPRSNVMissense_Mutationrs754424759c.694N>Tp.Arg232Cysp.R232CO43390protein_codingdeleterious(0.02)probably_damaging(0.997)TCGA-AN-A0AK-01Breastbreast invasive carcinomaFemale>=65I/IIUnknownUnknownSD
HNRNPRSNVMissense_Mutationc.511N>Cp.Lys171Glnp.K171QO43390protein_codingdeleterious(0)probably_damaging(0.991)TCGA-BH-A0C3-01Breastbreast invasive carcinomaFemale<65I/IIChemotherapyadriamycinPD
HNRNPRSNVMissense_Mutationc.1366N>Tp.Gly456Trpp.G456WO43390protein_codingtolerated(0.12)probably_damaging(0.943)TCGA-E2-A15J-01Breastbreast invasive carcinomaFemale<65I/IIChemotherapydocetaxelSD
HNRNPRinsertionFrame_Shift_Insnovelc.271_272insACCGGAAGGAGGCAGACATCATGATCTTTTTTGCTTCTGGTp.Val91AspfsTer26p.V91Dfs*26O43390protein_codingTCGA-A7-A0CE-01Breastbreast invasive carcinomaFemale<65I/IIChemotherapyadriamycinSD
HNRNPRSNVMissense_Mutationc.139N>Cp.Asp47Hisp.D47HO43390protein_codingdeleterious(0.03)possibly_damaging(0.614)TCGA-EK-A2H0-01Cervixcervical & endocervical cancerFemale<65I/IIChemotherapycisplatinCR
HNRNPRSNVMissense_Mutationc.1096N>Ap.Glu366Lysp.E366KO43390protein_codingtolerated(0.25)benign(0.219)TCGA-FU-A3HY-01Cervixcervical & endocervical cancerFemale<65I/IIChemotherapycisplatinCR
HNRNPRSNVMissense_Mutationnovelc.790N>Ap.Glu264Lysp.E264KO43390protein_codingtolerated(0.07)probably_damaging(0.967)TCGA-JW-A5VL-01Cervixcervical & endocervical cancerFemale<65I/IIUnknownUnknownSD
HNRNPRSNVMissense_Mutationc.610N>Gp.Gln204Glup.Q204EO43390protein_codingtolerated(0.85)possibly_damaging(0.693)TCGA-JW-A5VL-01Cervixcervical & endocervical cancerFemale<65I/IIUnknownUnknownSD
HNRNPRSNVMissense_Mutationnovelc.454C>Tp.Pro152Serp.P152SO43390protein_codingdeleterious(0)probably_damaging(0.999)TCGA-MA-AA42-01Cervixcervical & endocervical cancerFemale>=65I/IIUnknownUnknownSD
Page: 1 2 3 4 5 6 7 

Top

Related drugs of malignant transformation related genes

check buttonIdentification of chemicals and drugs interact with genes involved in malignant transfromation
(DGIdb 4.0)
Entrez IDSymbolCategoryInteraction TypesDrug Claim NameDrug NamePMIDs
Page: 1