
|
|||||
|
 | |
| |
| |
| |
| |
| |
|
Gene: HNRNPM |
Gene summary for HNRNPM |
| Gene information | Species | Human | Gene symbol | HNRNPM | Gene ID | 4670 |
| Gene name | heterogeneous nuclear ribonucleoprotein M | |
| Gene Alias | CEAR | |
| Cytomap | 19p13.2 | |
| Gene Type | protein-coding | GO ID | GO:0000375 | UniProtAcc | Q59ES8 |
Top |
Malignant transformation analysis |
| Identification of the aberrant gene expression in precancerous and cancerous lesions by comparing the gene expression of stem-like cells in diseased tissues with normal stem cells |
| Entrez ID | Symbol | Replicates | Species | Organ | Tissue | Adj P-value | Log2FC | Malignancy |
| 4670 | HNRNPM | HTA11_3410_2000001011 | Human | Colorectum | AD | 1.37e-02 | 3.01e-01 | 0.0155 |
| 4670 | HNRNPM | HTA11_2487_2000001011 | Human | Colorectum | SER | 2.61e-02 | 4.34e-01 | -0.1808 |
| 4670 | HNRNPM | HTA11_1938_2000001011 | Human | Colorectum | AD | 2.80e-07 | 7.25e-01 | -0.0811 |
| 4670 | HNRNPM | HTA11_78_2000001011 | Human | Colorectum | AD | 9.21e-03 | 4.92e-01 | -0.1088 |
| 4670 | HNRNPM | HTA11_347_2000001011 | Human | Colorectum | AD | 9.04e-12 | 5.86e-01 | -0.1954 |
| 4670 | HNRNPM | HTA11_411_2000001011 | Human | Colorectum | SER | 1.08e-05 | 1.01e+00 | -0.2602 |
| 4670 | HNRNPM | HTA11_83_2000001011 | Human | Colorectum | SER | 1.57e-04 | 5.60e-01 | -0.1526 |
| 4670 | HNRNPM | HTA11_696_2000001011 | Human | Colorectum | AD | 8.71e-13 | 7.54e-01 | -0.1464 |
| 4670 | HNRNPM | HTA11_1391_2000001011 | Human | Colorectum | AD | 5.93e-13 | 9.68e-01 | -0.059 |
| 4670 | HNRNPM | HTA11_7862_2000001011 | Human | Colorectum | AD | 2.97e-08 | 7.68e-01 | -0.0179 |
| 4670 | HNRNPM | HTA11_866_3004761011 | Human | Colorectum | AD | 9.08e-18 | 1.03e+00 | 0.096 |
| 4670 | HNRNPM | HTA11_7663_2000001011 | Human | Colorectum | SER | 5.14e-07 | 9.86e-01 | 0.0131 |
| 4670 | HNRNPM | HTA11_10623_2000001011 | Human | Colorectum | AD | 1.53e-06 | 7.90e-01 | -0.0177 |
| 4670 | HNRNPM | HTA11_6801_2000001011 | Human | Colorectum | SER | 6.04e-08 | 1.08e+00 | 0.0171 |
| 4670 | HNRNPM | HTA11_10711_2000001011 | Human | Colorectum | AD | 3.71e-06 | 6.23e-01 | 0.0338 |
| 4670 | HNRNPM | HTA11_7696_3000711011 | Human | Colorectum | AD | 3.51e-28 | 1.19e+00 | 0.0674 |
| 4670 | HNRNPM | HTA11_7469_2000001011 | Human | Colorectum | AD | 5.81e-06 | 1.07e+00 | -0.0124 |
| 4670 | HNRNPM | HTA11_6818_2000001021 | Human | Colorectum | AD | 7.86e-04 | 5.81e-01 | 0.0588 |
| 4670 | HNRNPM | HTA11_99999970781_79442 | Human | Colorectum | MSS | 4.92e-32 | 1.34e+00 | 0.294 |
| 4670 | HNRNPM | HTA11_99999965062_69753 | Human | Colorectum | MSI-H | 1.07e-17 | 1.79e+00 | 0.3487 |
| Page: 1 2 3 4 5 6 7 8 9 10 11 12 13 |
| Tissue | Expression Dynamics | Abbreviation |
| Colorectum (GSE201348) |  | FAP: Familial adenomatous polyposis |
| CRC: Colorectal cancer | ||
| Colorectum (HTA11) |  | AD: Adenomas |
| SER: Sessile serrated lesions | ||
| MSI-H: Microsatellite-high colorectal cancer | ||
| MSS: Microsatellite stable colorectal cancer | ||
| Endometrium |  | AEH: Atypical endometrial hyperplasia |
| EEC: Endometrioid Cancer | ||
| Esophagus |  | ESCC: Esophageal squamous cell carcinoma |
| HGIN: High-grade intraepithelial neoplasias | ||
| LGIN: Low-grade intraepithelial neoplasias | ||
| GC | 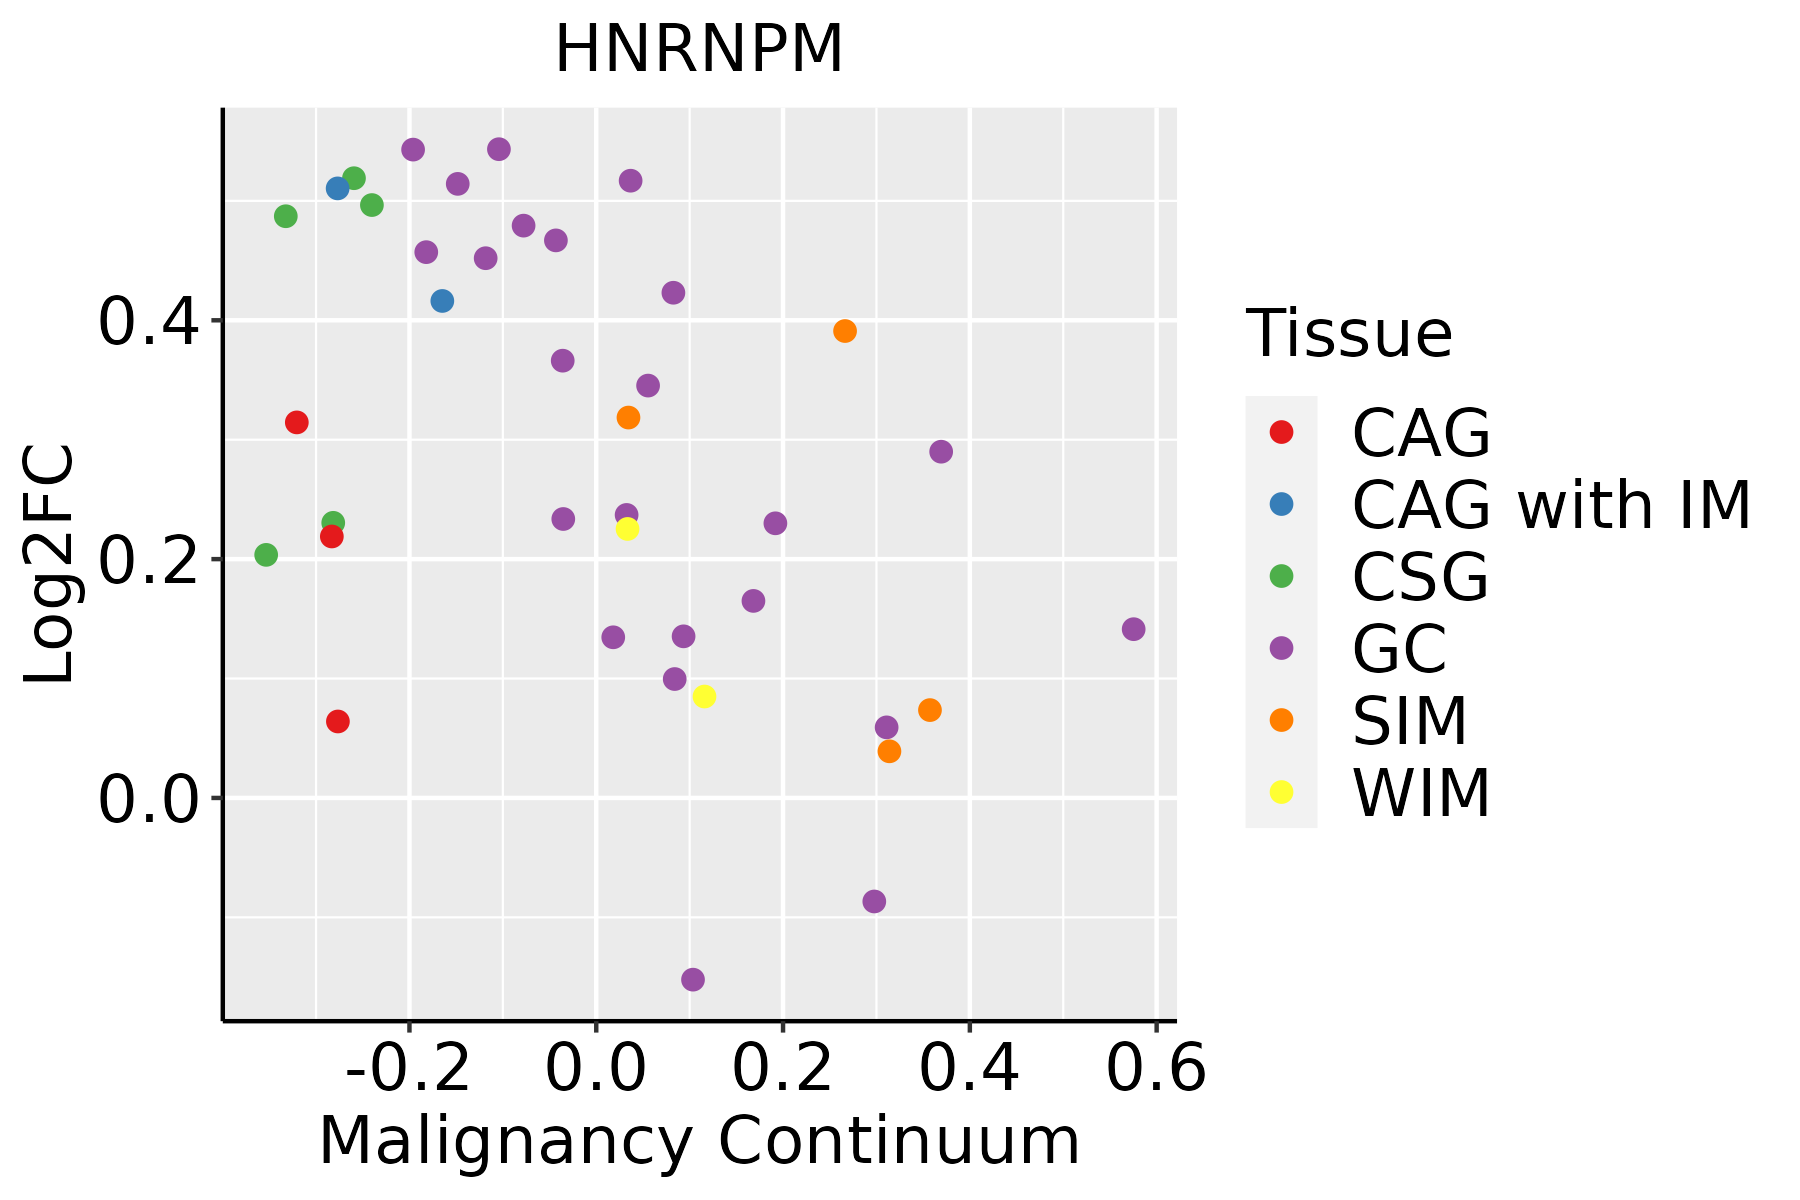 | CAG: Chronic atrophic gastritis |
| CAG with IM: Chronic atrophic gastritis with intestinal metaplasia | ||
| CSG: Chronic superficial gastritis | ||
| GC: Gastric cancer | ||
| SIM: Severe intestinal metaplasia | ||
| WIM: Wild intestinal metaplasia | ||
| Liver | 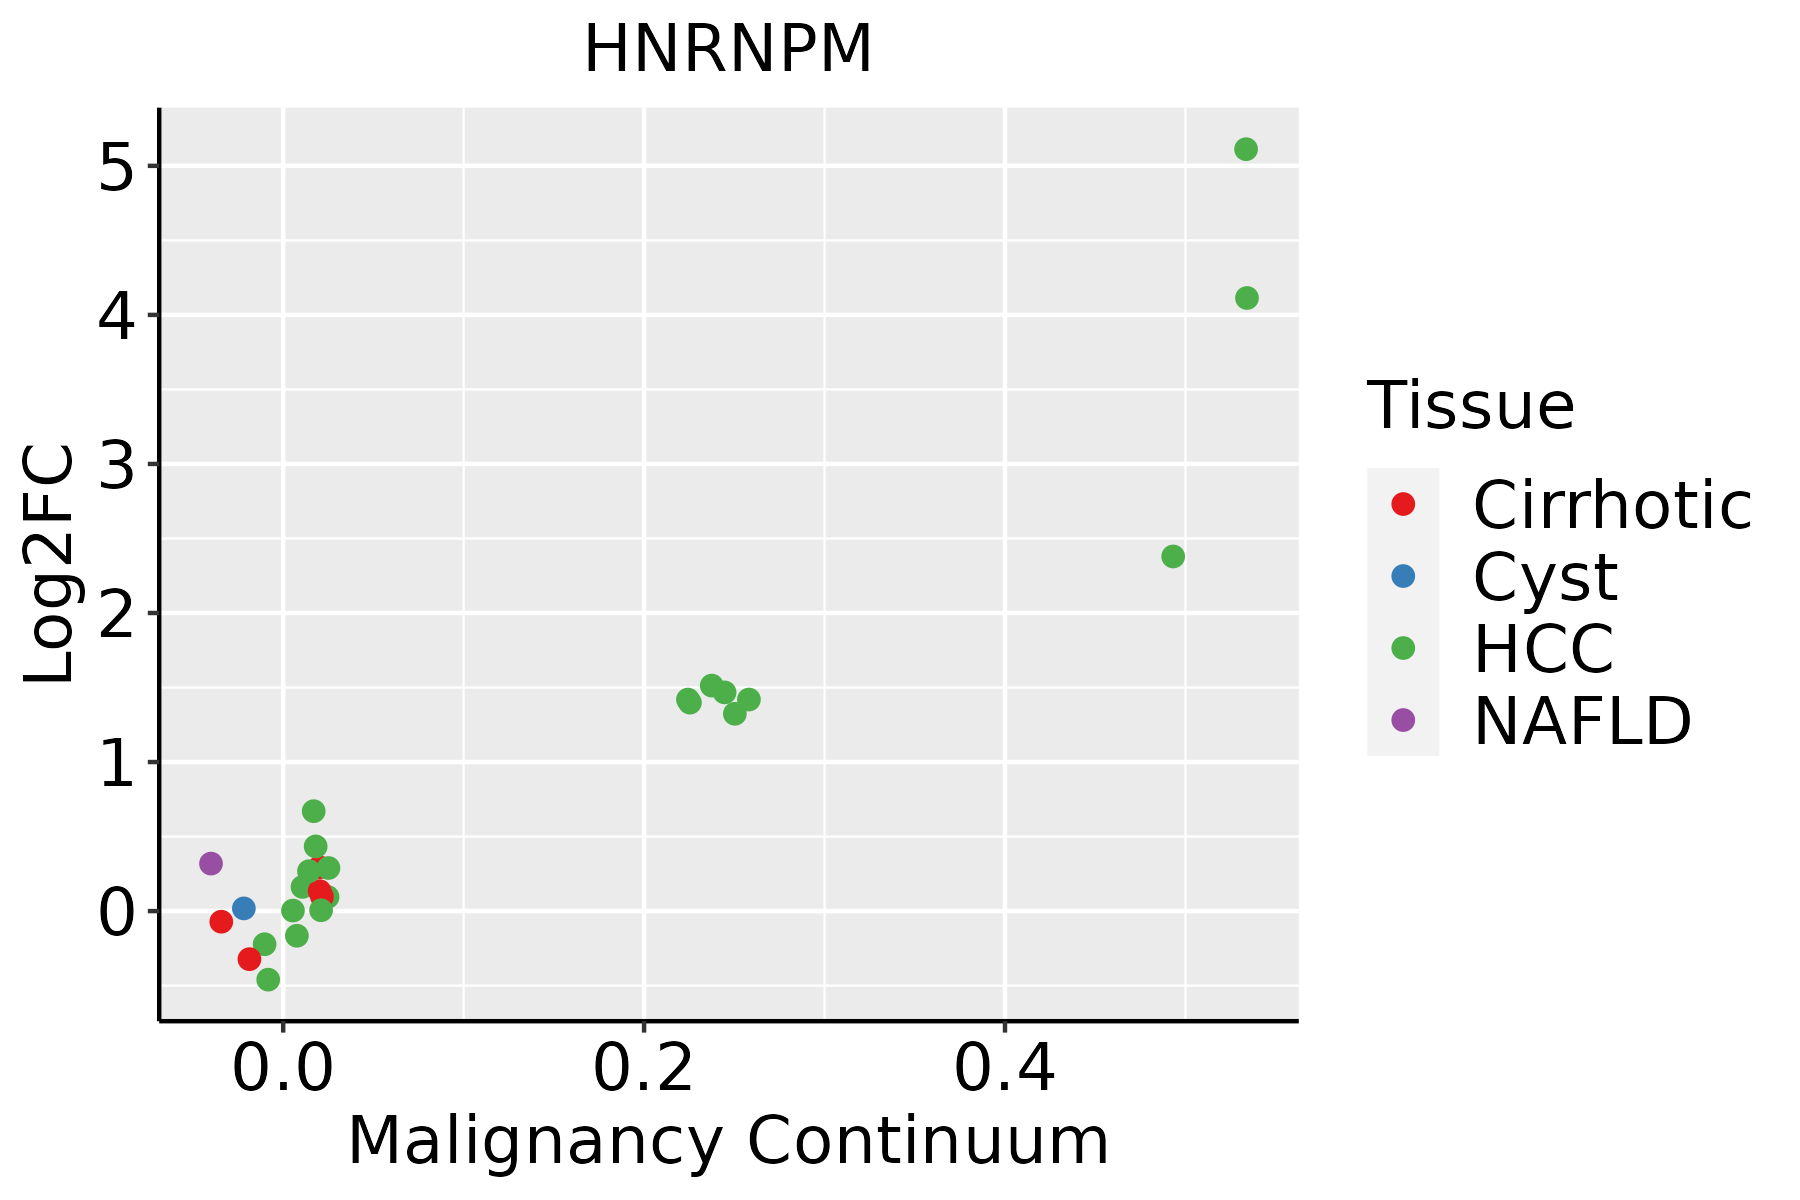 | HCC: Hepatocellular carcinoma |
| NAFLD: Non-alcoholic fatty liver disease | ||
| Oral Cavity | 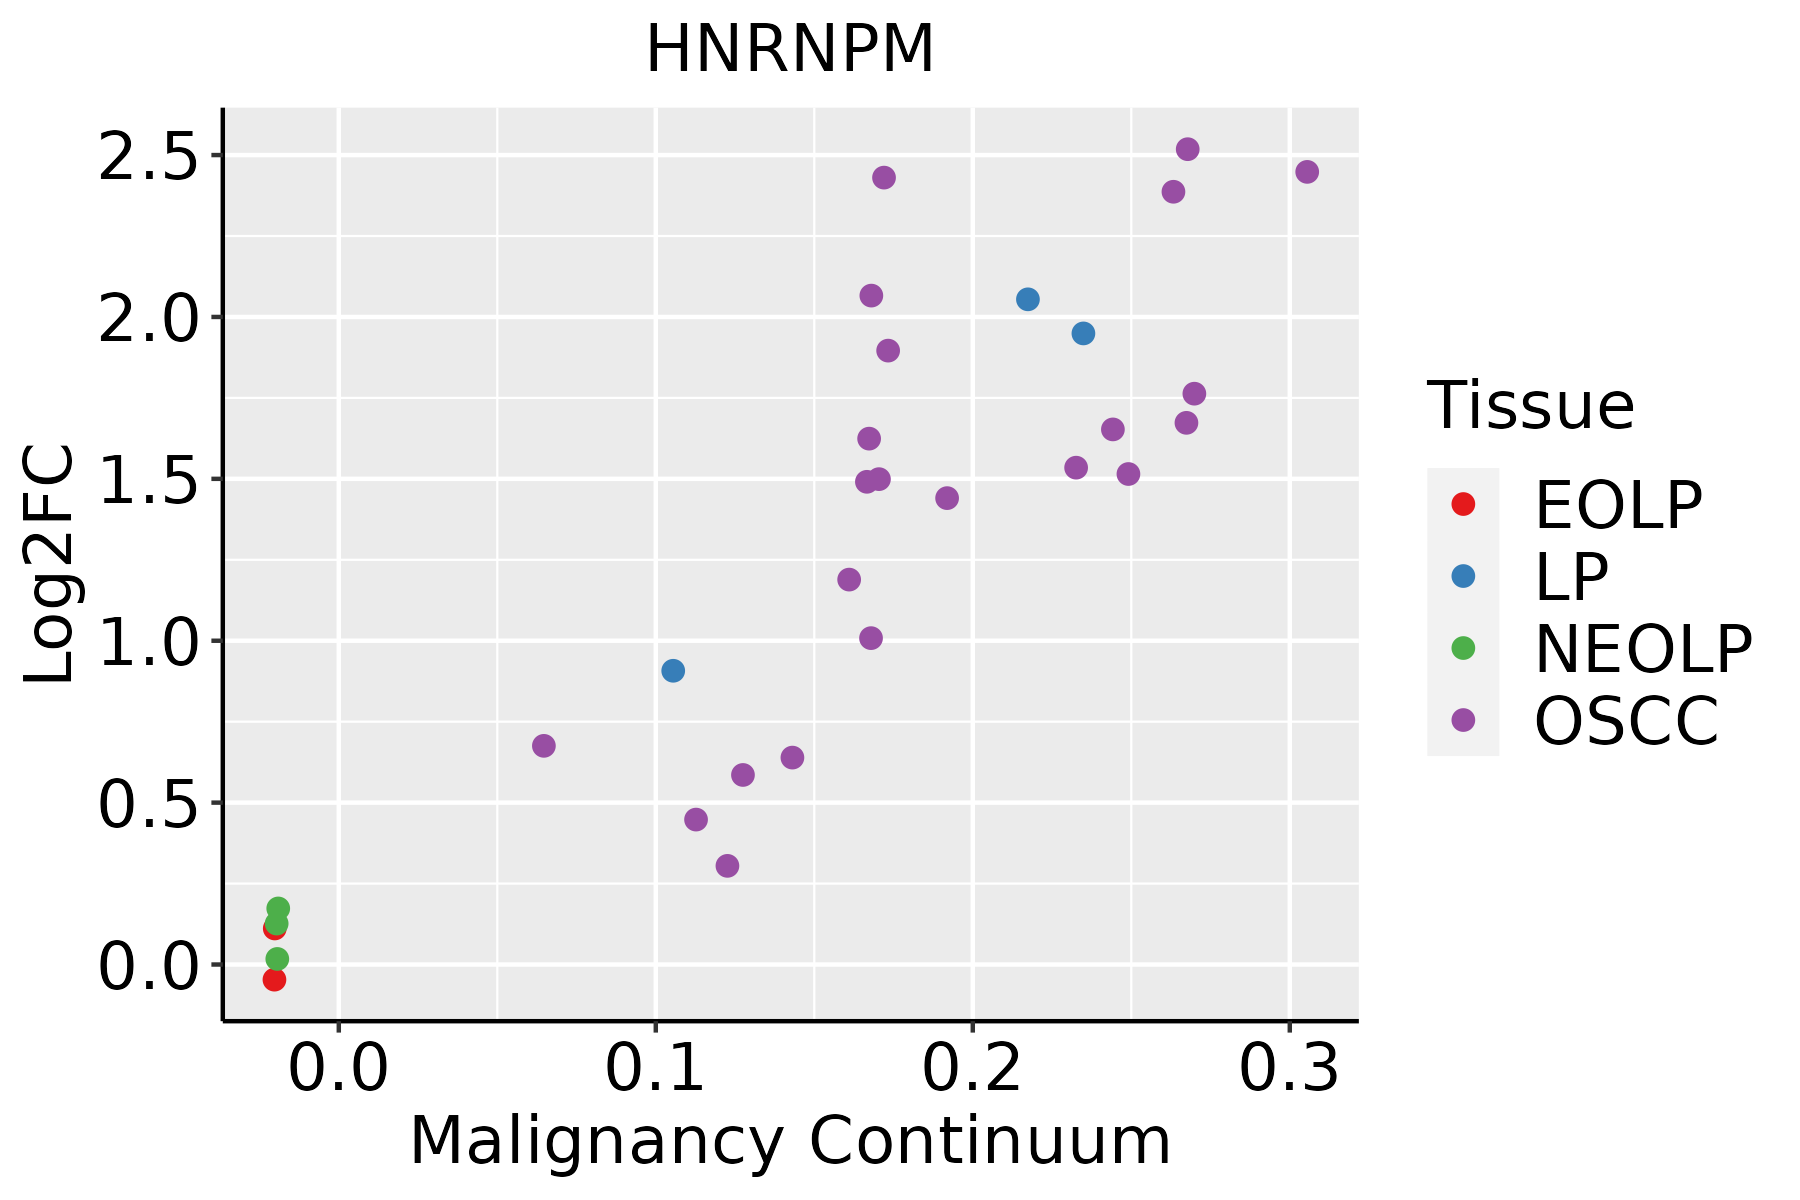 | EOLP: Erosive Oral lichen planus |
| LP: leukoplakia | ||
| NEOLP: Non-erosive oral lichen planus | ||
| OSCC: Oral squamous cell carcinoma | ||
| Prostate |  | BPH: Benign Prostatic Hyperplasia |
| Skin | 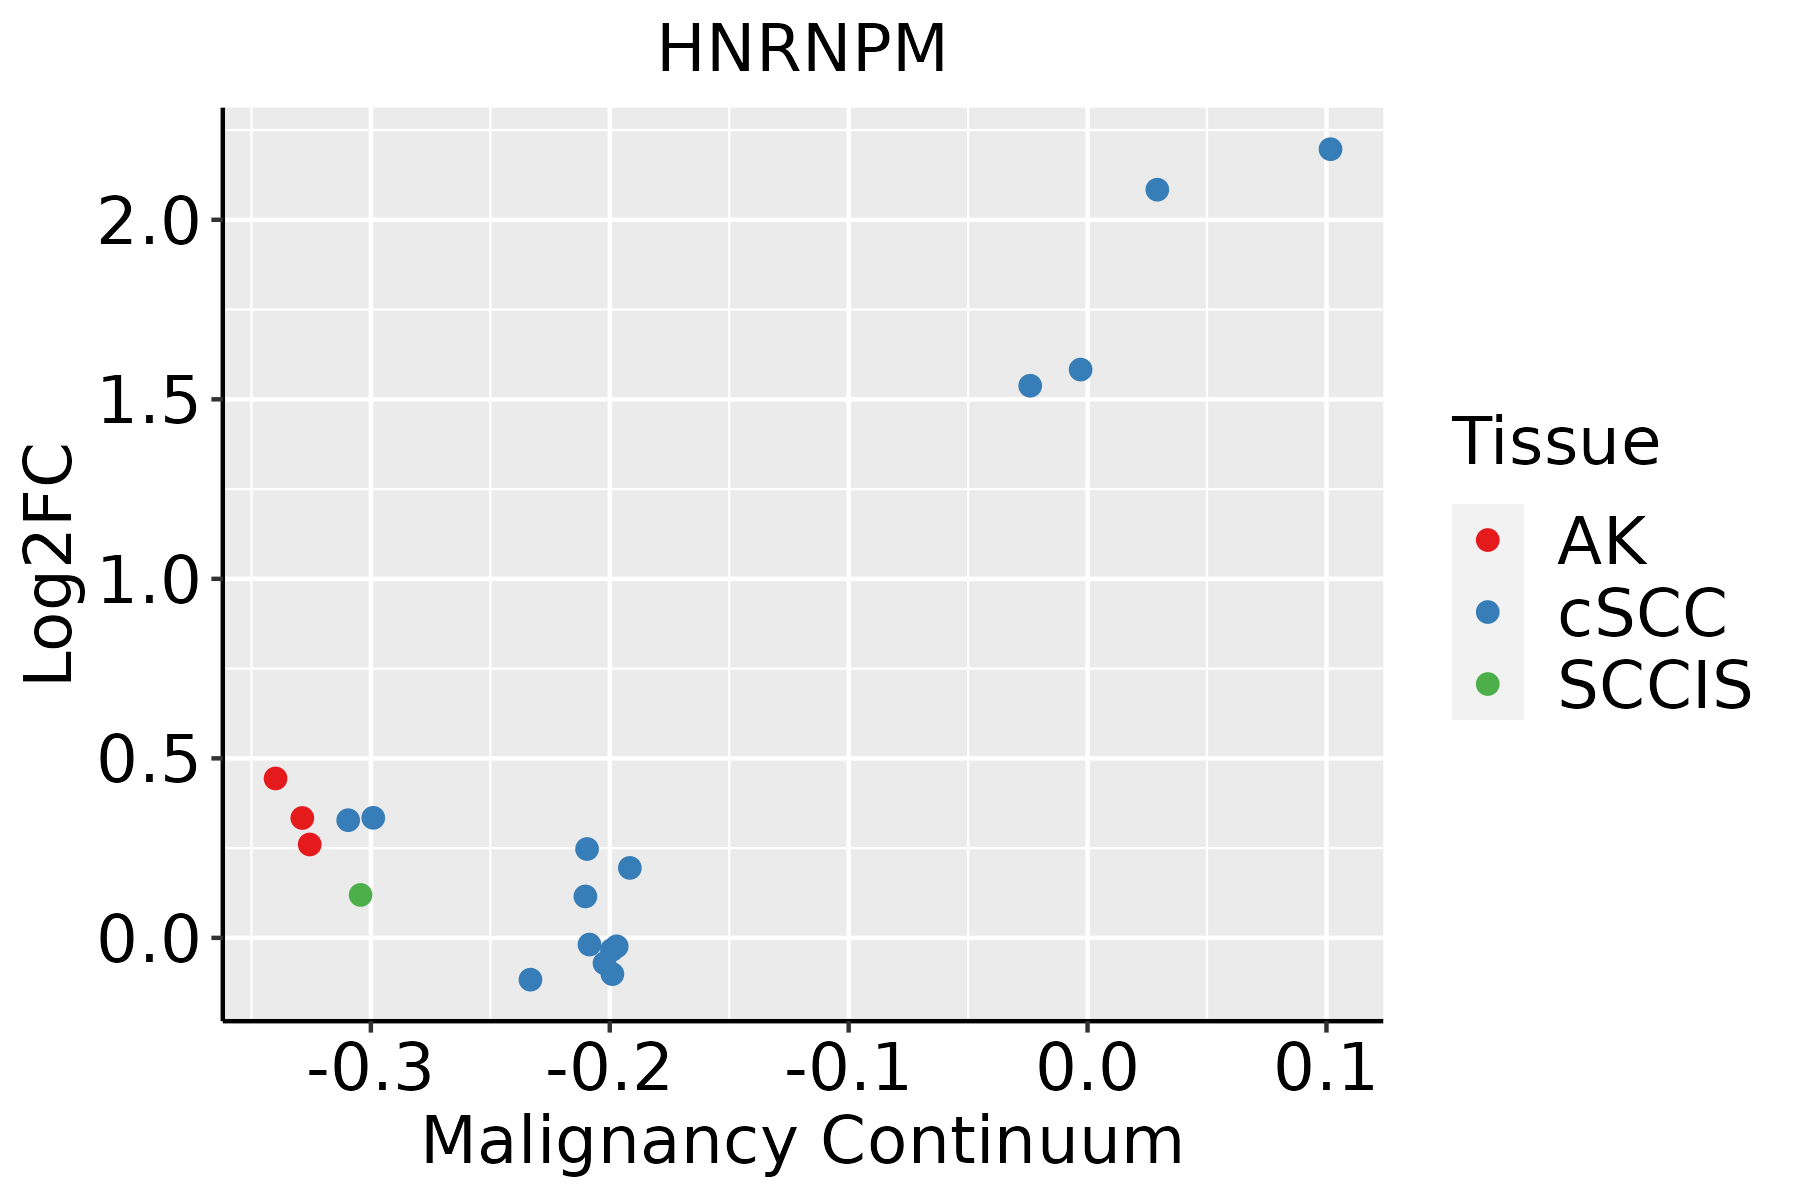 | AK: Actinic keratosis |
| cSCC: Cutaneous squamous cell carcinoma | ||
| SCCIS:squamous cell carcinoma in situ | ||
| Thyroid |  | ATC: Anaplastic thyroid cancer |
| HT: Hashimoto's thyroiditis | ||
| PTC: Papillary thyroid cancer |
| ∗log2FC in expression of this searched gene in stem-like cells from each diseased tissue sample relative to stem-like cells in normal samples in each tissue plotted against the malignancy continuum. Samples are colored based on if they are from different disease stage. |
Top |
Malignant transformation related pathway analysis |
| Find out the enriched GO biological processes and KEGG pathways involved in transition from healthy to precancer to cancer |
| Tissue | Disease Stage | Enriched GO biological Processes |
| Colorectum | AD |  |
| Colorectum | SER |  |
| Colorectum | MSS |  |
| Colorectum | MSI-H |  |
| Colorectum | FAP |  |
| ∗Top 15 enriched GO BP terms are showed in the bar plot of each disease state in each tissue. Each row represents a significant GO biological process which is colored according to the -log10(p.adjust). |
| Page: 1 2 3 4 5 6 7 8 9 |
| GO ID | Tissue | Disease Stage | Description | Gene Ratio | Bg Ratio | pvalue | p.adjust | Count |
| GO:0008380 | Colorectum | AD | RNA splicing | 169/3918 | 434/18723 | 3.59e-18 | 2.04e-15 | 169 |
| GO:0000377 | Colorectum | AD | RNA splicing, via transesterification reactions with bulged adenosine as nucleophile | 130/3918 | 320/18723 | 5.88e-16 | 2.16e-13 | 130 |
| GO:0000398 | Colorectum | AD | mRNA splicing, via spliceosome | 130/3918 | 320/18723 | 5.88e-16 | 2.16e-13 | 130 |
| GO:0000375 | Colorectum | AD | RNA splicing, via transesterification reactions | 131/3918 | 324/18723 | 7.11e-16 | 2.22e-13 | 131 |
| GO:1903311 | Colorectum | AD | regulation of mRNA metabolic process | 117/3918 | 288/18723 | 1.69e-14 | 4.23e-12 | 117 |
| GO:0006401 | Colorectum | AD | RNA catabolic process | 102/3918 | 278/18723 | 8.64e-10 | 6.76e-08 | 102 |
| GO:0044270 | Colorectum | AD | cellular nitrogen compound catabolic process | 147/3918 | 451/18723 | 3.35e-09 | 2.23e-07 | 147 |
| GO:0046700 | Colorectum | AD | heterocycle catabolic process | 145/3918 | 445/18723 | 4.37e-09 | 2.84e-07 | 145 |
| GO:0006402 | Colorectum | AD | mRNA catabolic process | 87/3918 | 232/18723 | 4.40e-09 | 2.84e-07 | 87 |
| GO:0006979 | Colorectum | AD | response to oxidative stress | 145/3918 | 446/18723 | 5.16e-09 | 3.23e-07 | 145 |
| GO:0034655 | Colorectum | AD | nucleobase-containing compound catabolic process | 133/3918 | 407/18723 | 1.56e-08 | 9.12e-07 | 133 |
| GO:0019439 | Colorectum | AD | aromatic compound catabolic process | 146/3918 | 467/18723 | 7.48e-08 | 3.84e-06 | 146 |
| GO:1901361 | Colorectum | AD | organic cyclic compound catabolic process | 153/3918 | 495/18723 | 8.23e-08 | 4.18e-06 | 153 |
| GO:0061013 | Colorectum | AD | regulation of mRNA catabolic process | 64/3918 | 166/18723 | 1.44e-07 | 6.59e-06 | 64 |
| GO:0043487 | Colorectum | AD | regulation of RNA stability | 63/3918 | 170/18723 | 9.17e-07 | 3.12e-05 | 63 |
| GO:0043488 | Colorectum | AD | regulation of mRNA stability | 59/3918 | 158/18723 | 1.50e-06 | 4.66e-05 | 59 |
| GO:0000380 | Colorectum | AD | alternative mRNA splicing, via spliceosome | 33/3918 | 77/18723 | 1.13e-05 | 2.55e-04 | 33 |
| GO:00083801 | Colorectum | SER | RNA splicing | 123/2897 | 434/18723 | 3.84e-12 | 8.41e-10 | 123 |
| GO:00003751 | Colorectum | SER | RNA splicing, via transesterification reactions | 90/2897 | 324/18723 | 8.68e-09 | 7.50e-07 | 90 |
| GO:00003771 | Colorectum | SER | RNA splicing, via transesterification reactions with bulged adenosine as nucleophile | 89/2897 | 320/18723 | 9.82e-09 | 8.14e-07 | 89 |
| Page: 1 2 3 4 5 6 7 8 9 10 11 12 13 14 15 16 17 18 19 20 21 |
| Pathway ID | Tissue | Disease Stage | Description | Gene Ratio | Bg Ratio | pvalue | p.adjust | qvalue | Count |
| hsa03040 | Colorectum | AD | Spliceosome | 73/2092 | 217/8465 | 1.73e-03 | 9.68e-03 | 6.18e-03 | 73 |
| hsa030401 | Colorectum | AD | Spliceosome | 73/2092 | 217/8465 | 1.73e-03 | 9.68e-03 | 6.18e-03 | 73 |
| hsa030402 | Colorectum | MSS | Spliceosome | 66/1875 | 217/8465 | 2.58e-03 | 1.27e-02 | 7.81e-03 | 66 |
| hsa030403 | Colorectum | MSS | Spliceosome | 66/1875 | 217/8465 | 2.58e-03 | 1.27e-02 | 7.81e-03 | 66 |
| hsa030404 | Colorectum | MSI-H | Spliceosome | 37/797 | 217/8465 | 2.49e-04 | 3.23e-03 | 2.70e-03 | 37 |
| hsa030405 | Colorectum | MSI-H | Spliceosome | 37/797 | 217/8465 | 2.49e-04 | 3.23e-03 | 2.70e-03 | 37 |
| hsa030409 | Endometrium | AEH | Spliceosome | 54/1197 | 217/8465 | 1.47e-05 | 1.65e-04 | 1.21e-04 | 54 |
| hsa0304014 | Endometrium | AEH | Spliceosome | 54/1197 | 217/8465 | 1.47e-05 | 1.65e-04 | 1.21e-04 | 54 |
| hsa0304024 | Endometrium | EEC | Spliceosome | 54/1237 | 217/8465 | 3.78e-05 | 3.88e-04 | 2.89e-04 | 54 |
| hsa0304034 | Endometrium | EEC | Spliceosome | 54/1237 | 217/8465 | 3.78e-05 | 3.88e-04 | 2.89e-04 | 54 |
| hsa0304018 | Esophagus | HGIN | Spliceosome | 79/1383 | 217/8465 | 3.22e-13 | 7.00e-12 | 5.56e-12 | 79 |
| hsa0304019 | Esophagus | HGIN | Spliceosome | 79/1383 | 217/8465 | 3.22e-13 | 7.00e-12 | 5.56e-12 | 79 |
| hsa0304027 | Esophagus | ESCC | Spliceosome | 128/4205 | 217/8465 | 3.31e-03 | 8.79e-03 | 4.50e-03 | 128 |
| hsa0304037 | Esophagus | ESCC | Spliceosome | 128/4205 | 217/8465 | 3.31e-03 | 8.79e-03 | 4.50e-03 | 128 |
| hsa030407 | Liver | Cirrhotic | Spliceosome | 102/2530 | 217/8465 | 5.69e-08 | 9.47e-07 | 5.84e-07 | 102 |
| hsa0304012 | Liver | Cirrhotic | Spliceosome | 102/2530 | 217/8465 | 5.69e-08 | 9.47e-07 | 5.84e-07 | 102 |
| hsa0304022 | Liver | HCC | Spliceosome | 122/4020 | 217/8465 | 5.55e-03 | 1.60e-02 | 8.91e-03 | 122 |
| hsa0304032 | Liver | HCC | Spliceosome | 122/4020 | 217/8465 | 5.55e-03 | 1.60e-02 | 8.91e-03 | 122 |
| hsa0304016 | Oral cavity | OSCC | Spliceosome | 123/3704 | 217/8465 | 7.21e-05 | 2.74e-04 | 1.40e-04 | 123 |
| hsa0304017 | Oral cavity | OSCC | Spliceosome | 123/3704 | 217/8465 | 7.21e-05 | 2.74e-04 | 1.40e-04 | 123 |
| Page: 1 2 |
Top |
Cell-cell communication analysis |
| Identification of potential cell-cell interactions between two cell types and their ligand-receptor pairs for different disease states |
| Ligand | Receptor | LRpair | Pathway | Tissue | Disease Stage |
| Page: 1 |
Top |
Single-cell gene regulatory network inference analysis |
| Find out the significant the regulons (TFs) and the target genes of each regulon across cell types for different disease states |
| TF | Cell Type | Tissue | Disease Stage | Target Gene | RSS | Regulon Activity |
| ∗The dot plots of a searched regulon are shown for all cell subpopulations in each disease state of each tissue based on the regulon specific score inferred using pySCENIC and by calculating the average expression. |
| Page: 1 |
Top |
Somatic mutation of malignant transformation related genes |
| Annotation of somatic variants for genes involved in malignant transformation |
| Hugo Symbol | Variant Class | Variant Classification | dbSNP RS | HGVSc | HGVSp | HGVSp Short | SWISSPROT | BIOTYPE | SIFT | PolyPhen | Tumor Sample Barcode | Tissue | Histology | Sex | Age | Stage | Therapy Types | Drugs | Outcome |
| HNRNPM | SNV | Missense_Mutation | c.1187N>A | p.Gly396Glu | p.G396E | P52272 | protein_coding | deleterious(0.02) | benign(0.207) | TCGA-AC-A23H-01 | Breast | breast invasive carcinoma | Female | >=65 | I/II | Unknown | Unknown | PD | |
| HNRNPM | SNV | Missense_Mutation | novel | c.730N>T | p.Arg244Cys | p.R244C | P52272 | protein_coding | deleterious(0) | probably_damaging(0.932) | TCGA-AN-A046-01 | Breast | breast invasive carcinoma | Female | >=65 | I/II | Unknown | Unknown | SD |
| HNRNPM | SNV | Missense_Mutation | c.838G>A | p.Glu280Lys | p.E280K | P52272 | protein_coding | tolerated(0.15) | benign(0.003) | TCGA-E2-A10C-01 | Breast | breast invasive carcinoma | Female | <65 | I/II | Chemotherapy | cytoxan | SD | |
| HNRNPM | SNV | Missense_Mutation | novel | c.1145N>T | p.Arg382Ile | p.R382I | P52272 | protein_coding | tolerated(0.1) | benign(0.017) | TCGA-2W-A8YY-01 | Cervix | cervical & endocervical cancer | Female | <65 | I/II | Chemotherapy | cisplatin | CR |
| HNRNPM | SNV | Missense_Mutation | novel | c.1486N>T | p.Arg496Cys | p.R496C | P52272 | protein_coding | tolerated(0.05) | probably_damaging(0.99) | TCGA-2W-A8YY-01 | Cervix | cervical & endocervical cancer | Female | <65 | I/II | Chemotherapy | cisplatin | CR |
| HNRNPM | SNV | Missense_Mutation | novel | c.1669N>T | p.Arg557Cys | p.R557C | P52272 | protein_coding | deleterious(0) | possibly_damaging(0.649) | TCGA-2W-A8YY-01 | Cervix | cervical & endocervical cancer | Female | <65 | I/II | Chemotherapy | cisplatin | CR |
| HNRNPM | SNV | Missense_Mutation | novel | c.955C>T | p.His319Tyr | p.H319Y | P52272 | protein_coding | deleterious(0.03) | probably_damaging(0.916) | TCGA-C5-A2LY-01 | Cervix | cervical & endocervical cancer | Female | <65 | I/II | Chemotherapy | cisplatin | SD |
| HNRNPM | SNV | Missense_Mutation | novel | c.1592N>C | p.Arg531Pro | p.R531P | P52272 | protein_coding | deleterious(0.01) | benign(0.221) | TCGA-DS-A1OC-01 | Cervix | cervical & endocervical cancer | Female | <65 | I/II | Chemotherapy | gemcitabine | SD |
| HNRNPM | SNV | Missense_Mutation | novel | c.831G>C | p.Lys277Asn | p.K277N | P52272 | protein_coding | deleterious(0.01) | possibly_damaging(0.871) | TCGA-JW-A5VL-01 | Cervix | cervical & endocervical cancer | Female | <65 | I/II | Unknown | Unknown | SD |
| HNRNPM | insertion | In_Frame_Ins | novel | c.1690_1691insCCC | p.Glu564delinsAlaGln | p.E564delinsAQ | P52272 | protein_coding | TCGA-DS-A1OD-01 | Cervix | cervical & endocervical cancer | Female | <65 | I/II | Chemotherapy | cisplatin | SD |
| Page: 1 2 3 4 5 6 7 8 9 10 |
Top |
Related drugs of malignant transformation related genes |
| Identification of chemicals and drugs interact with genes involved in malignant transfromation |
| (DGIdb 4.0) |
| Entrez ID | Symbol | Category | Interaction Types | Drug Claim Name | Drug Name | PMIDs |
| Page: 1 |

Copyright 2023-Present -The University of Texas Health Science Center at Houston |