
|
|||||
|
 | |
| |
| |
| |
| |
| |
|
Gene: HNRNPLL |
Gene summary for HNRNPLL |
| Gene information | Species | Human | Gene symbol | HNRNPLL | Gene ID | 92906 |
| Gene name | heterogeneous nuclear ribonucleoprotein L like | |
| Gene Alias | HNRPLL | |
| Cytomap | 2p22.1 | |
| Gene Type | protein-coding | GO ID | GO:0006139 | UniProtAcc | A8K894 |
Top |
Malignant transformation analysis |
| Identification of the aberrant gene expression in precancerous and cancerous lesions by comparing the gene expression of stem-like cells in diseased tissues with normal stem cells |
| Entrez ID | Symbol | Replicates | Species | Organ | Tissue | Adj P-value | Log2FC | Malignancy |
| 92906 | HNRNPLL | LZE2T | Human | Esophagus | ESCC | 1.18e-02 | 5.25e-01 | 0.082 |
| 92906 | HNRNPLL | LZE4T | Human | Esophagus | ESCC | 6.83e-12 | 1.81e-01 | 0.0811 |
| 92906 | HNRNPLL | LZE20T | Human | Esophagus | ESCC | 1.70e-05 | 1.02e-01 | 0.0662 |
| 92906 | HNRNPLL | LZE24T | Human | Esophagus | ESCC | 3.56e-15 | 6.15e-01 | 0.0596 |
| 92906 | HNRNPLL | P1T-E | Human | Esophagus | ESCC | 1.68e-02 | 3.52e-01 | 0.0875 |
| 92906 | HNRNPLL | P2T-E | Human | Esophagus | ESCC | 1.01e-49 | 8.54e-01 | 0.1177 |
| 92906 | HNRNPLL | P4T-E | Human | Esophagus | ESCC | 3.22e-31 | 7.43e-01 | 0.1323 |
| 92906 | HNRNPLL | P5T-E | Human | Esophagus | ESCC | 2.12e-08 | 1.40e-01 | 0.1327 |
| 92906 | HNRNPLL | P8T-E | Human | Esophagus | ESCC | 2.26e-19 | 4.32e-01 | 0.0889 |
| 92906 | HNRNPLL | P9T-E | Human | Esophagus | ESCC | 4.54e-15 | 2.92e-01 | 0.1131 |
| 92906 | HNRNPLL | P10T-E | Human | Esophagus | ESCC | 3.06e-27 | 6.11e-01 | 0.116 |
| 92906 | HNRNPLL | P11T-E | Human | Esophagus | ESCC | 1.07e-10 | 5.89e-01 | 0.1426 |
| 92906 | HNRNPLL | P12T-E | Human | Esophagus | ESCC | 1.10e-27 | 6.62e-01 | 0.1122 |
| 92906 | HNRNPLL | P15T-E | Human | Esophagus | ESCC | 7.37e-32 | 7.21e-01 | 0.1149 |
| 92906 | HNRNPLL | P16T-E | Human | Esophagus | ESCC | 8.81e-45 | 8.27e-01 | 0.1153 |
| 92906 | HNRNPLL | P17T-E | Human | Esophagus | ESCC | 1.02e-03 | 4.46e-01 | 0.1278 |
| 92906 | HNRNPLL | P19T-E | Human | Esophagus | ESCC | 6.45e-04 | 5.46e-01 | 0.1662 |
| 92906 | HNRNPLL | P20T-E | Human | Esophagus | ESCC | 5.29e-21 | 5.17e-01 | 0.1124 |
| 92906 | HNRNPLL | P21T-E | Human | Esophagus | ESCC | 1.63e-25 | 5.88e-01 | 0.1617 |
| 92906 | HNRNPLL | P22T-E | Human | Esophagus | ESCC | 9.70e-27 | 5.57e-01 | 0.1236 |
| Page: 1 2 3 4 5 |
| Tissue | Expression Dynamics | Abbreviation |
| Esophagus | 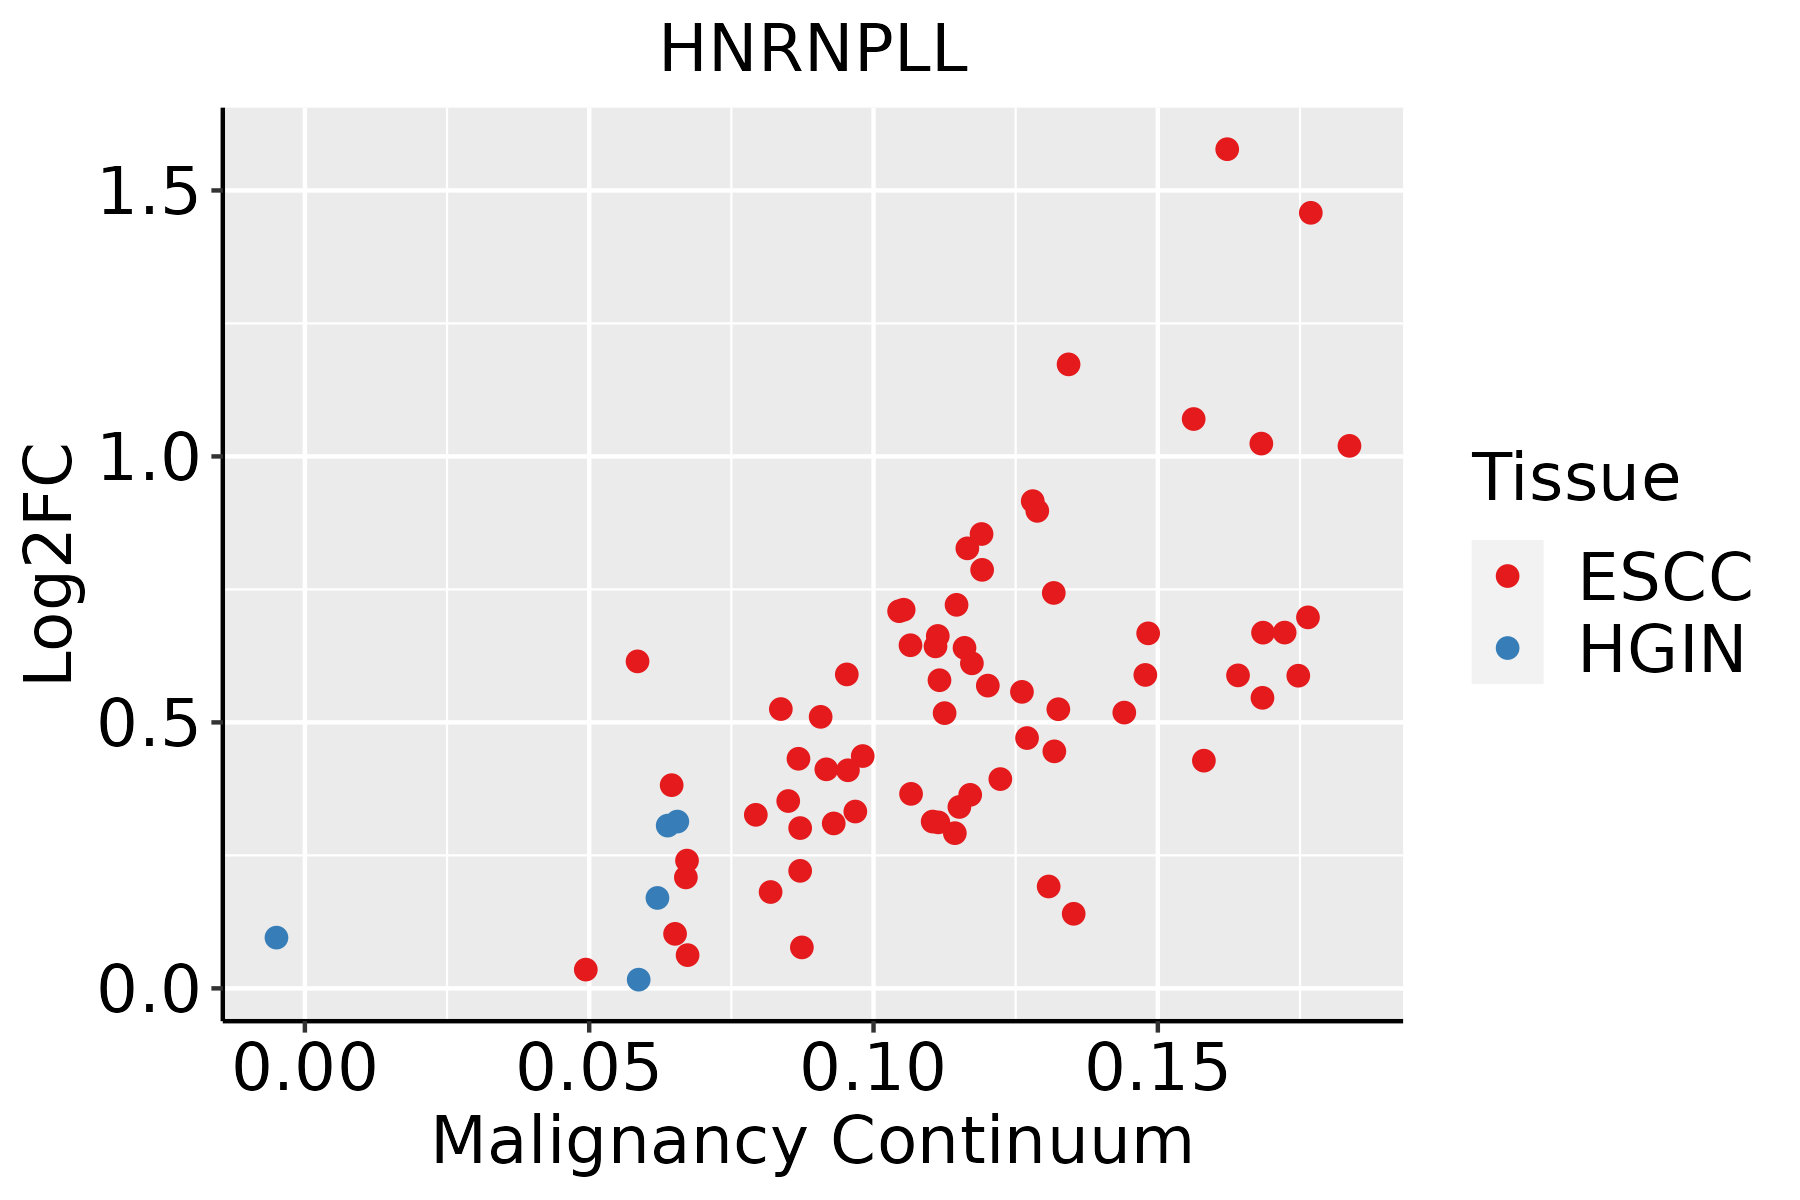 | ESCC: Esophageal squamous cell carcinoma |
| HGIN: High-grade intraepithelial neoplasias | ||
| LGIN: Low-grade intraepithelial neoplasias | ||
| Liver | 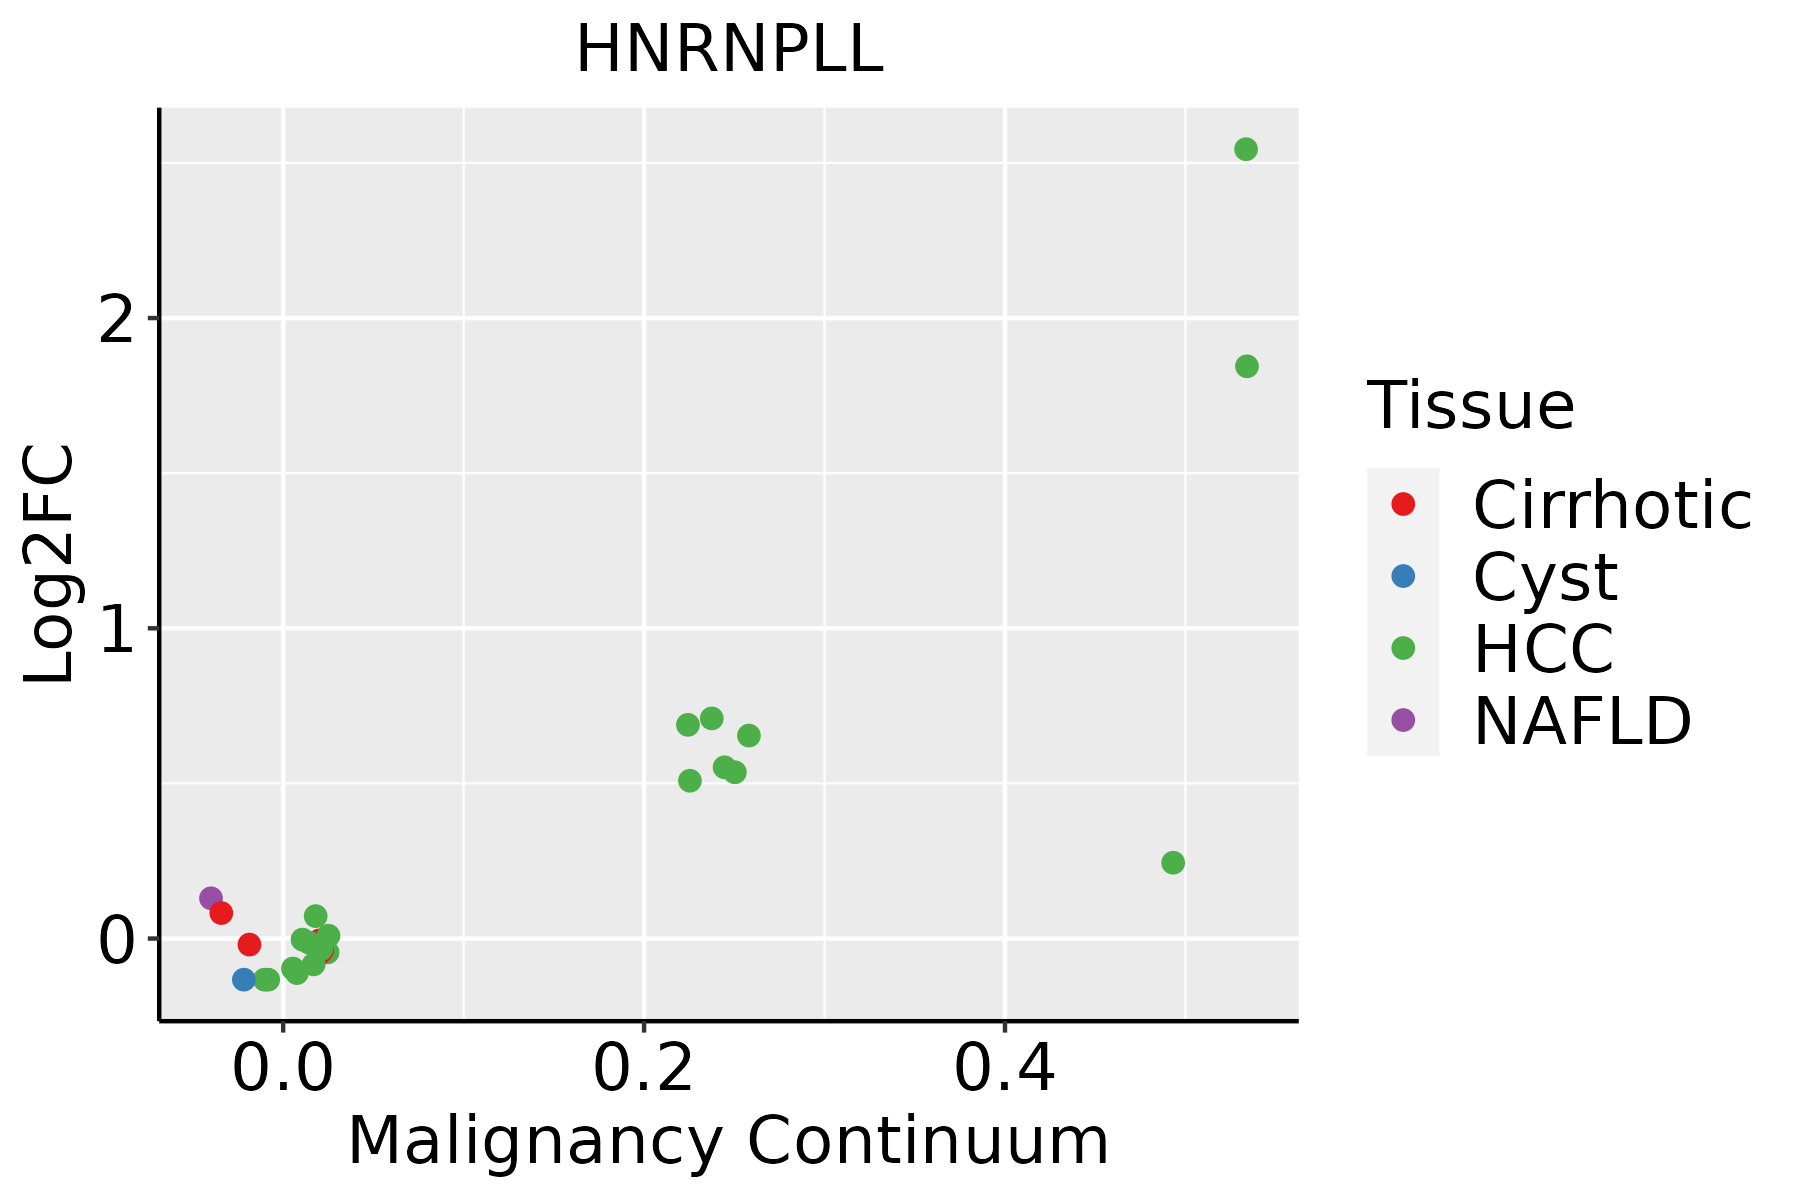 | HCC: Hepatocellular carcinoma |
| NAFLD: Non-alcoholic fatty liver disease | ||
| Oral Cavity | 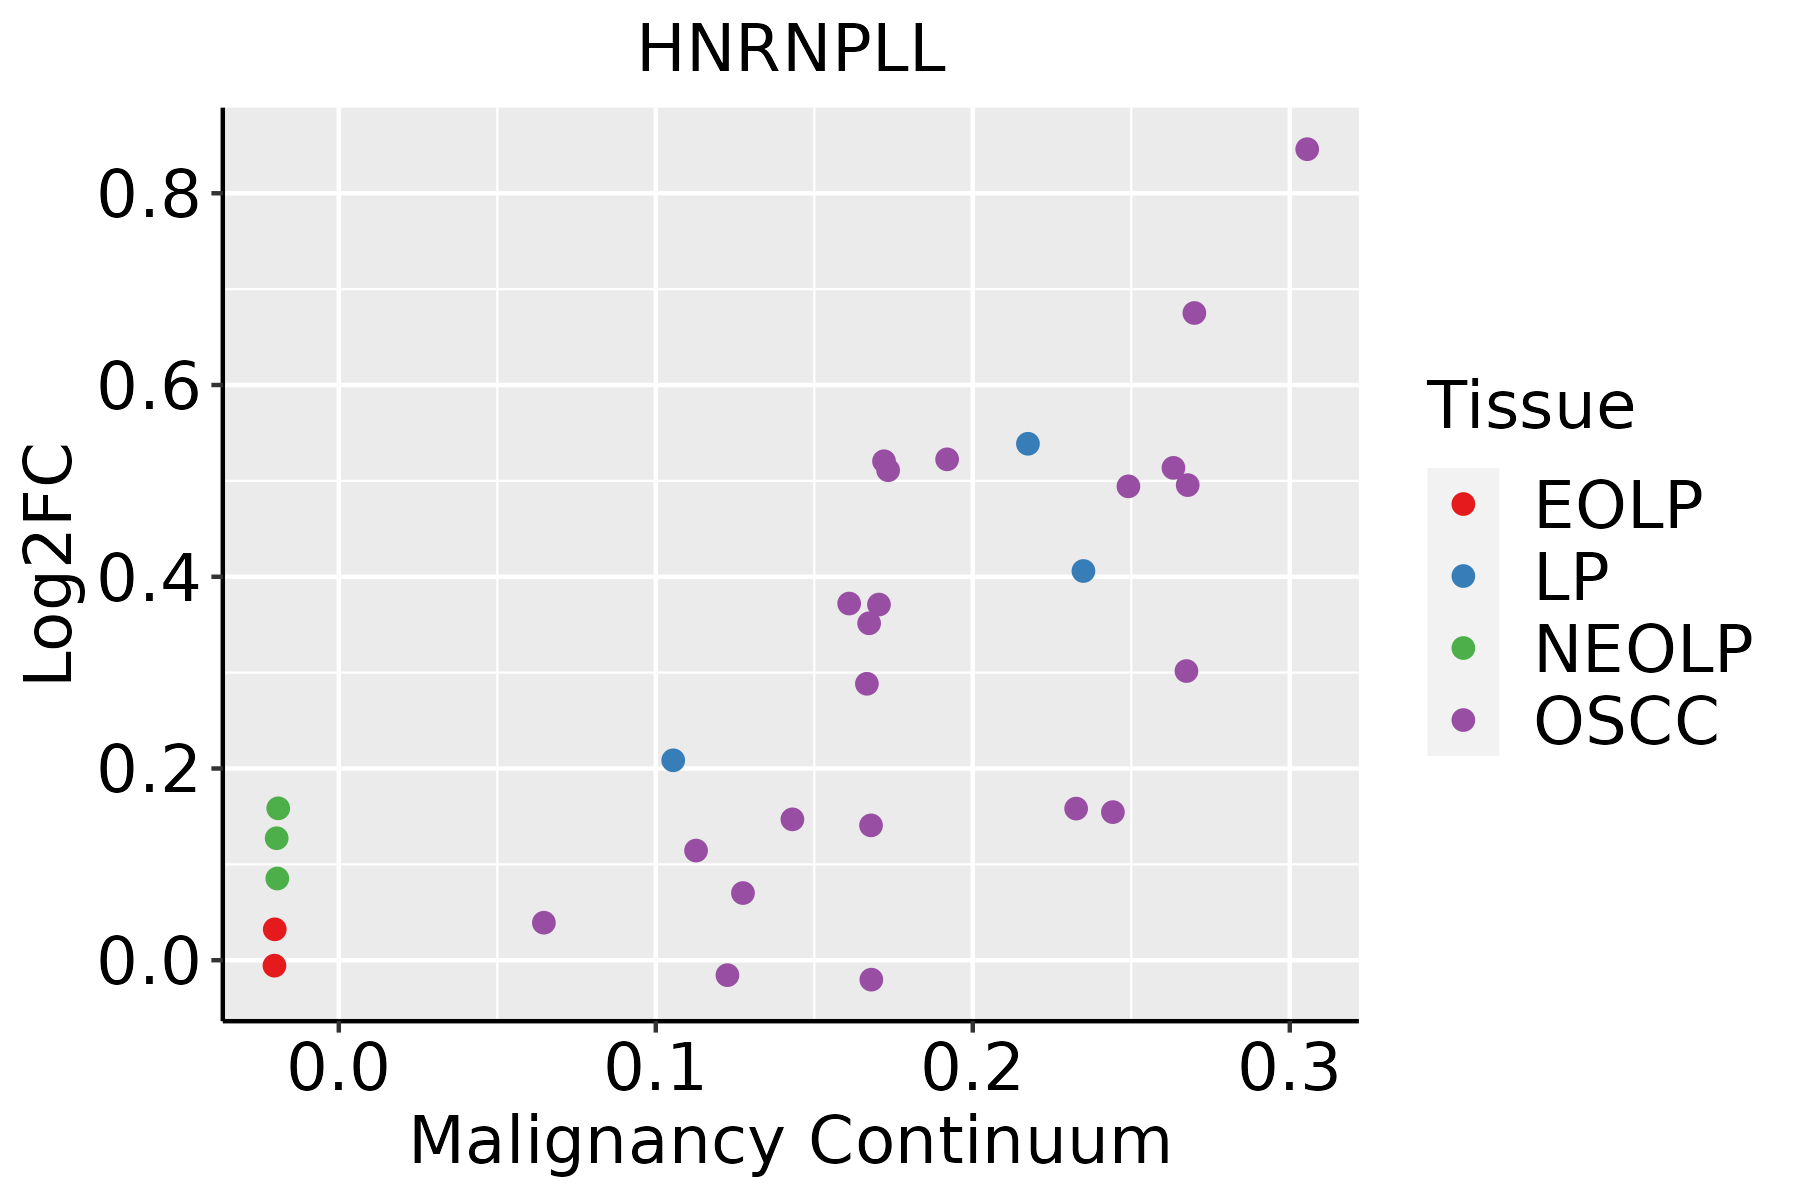 | EOLP: Erosive Oral lichen planus |
| LP: leukoplakia | ||
| NEOLP: Non-erosive oral lichen planus | ||
| OSCC: Oral squamous cell carcinoma | ||
| Skin | 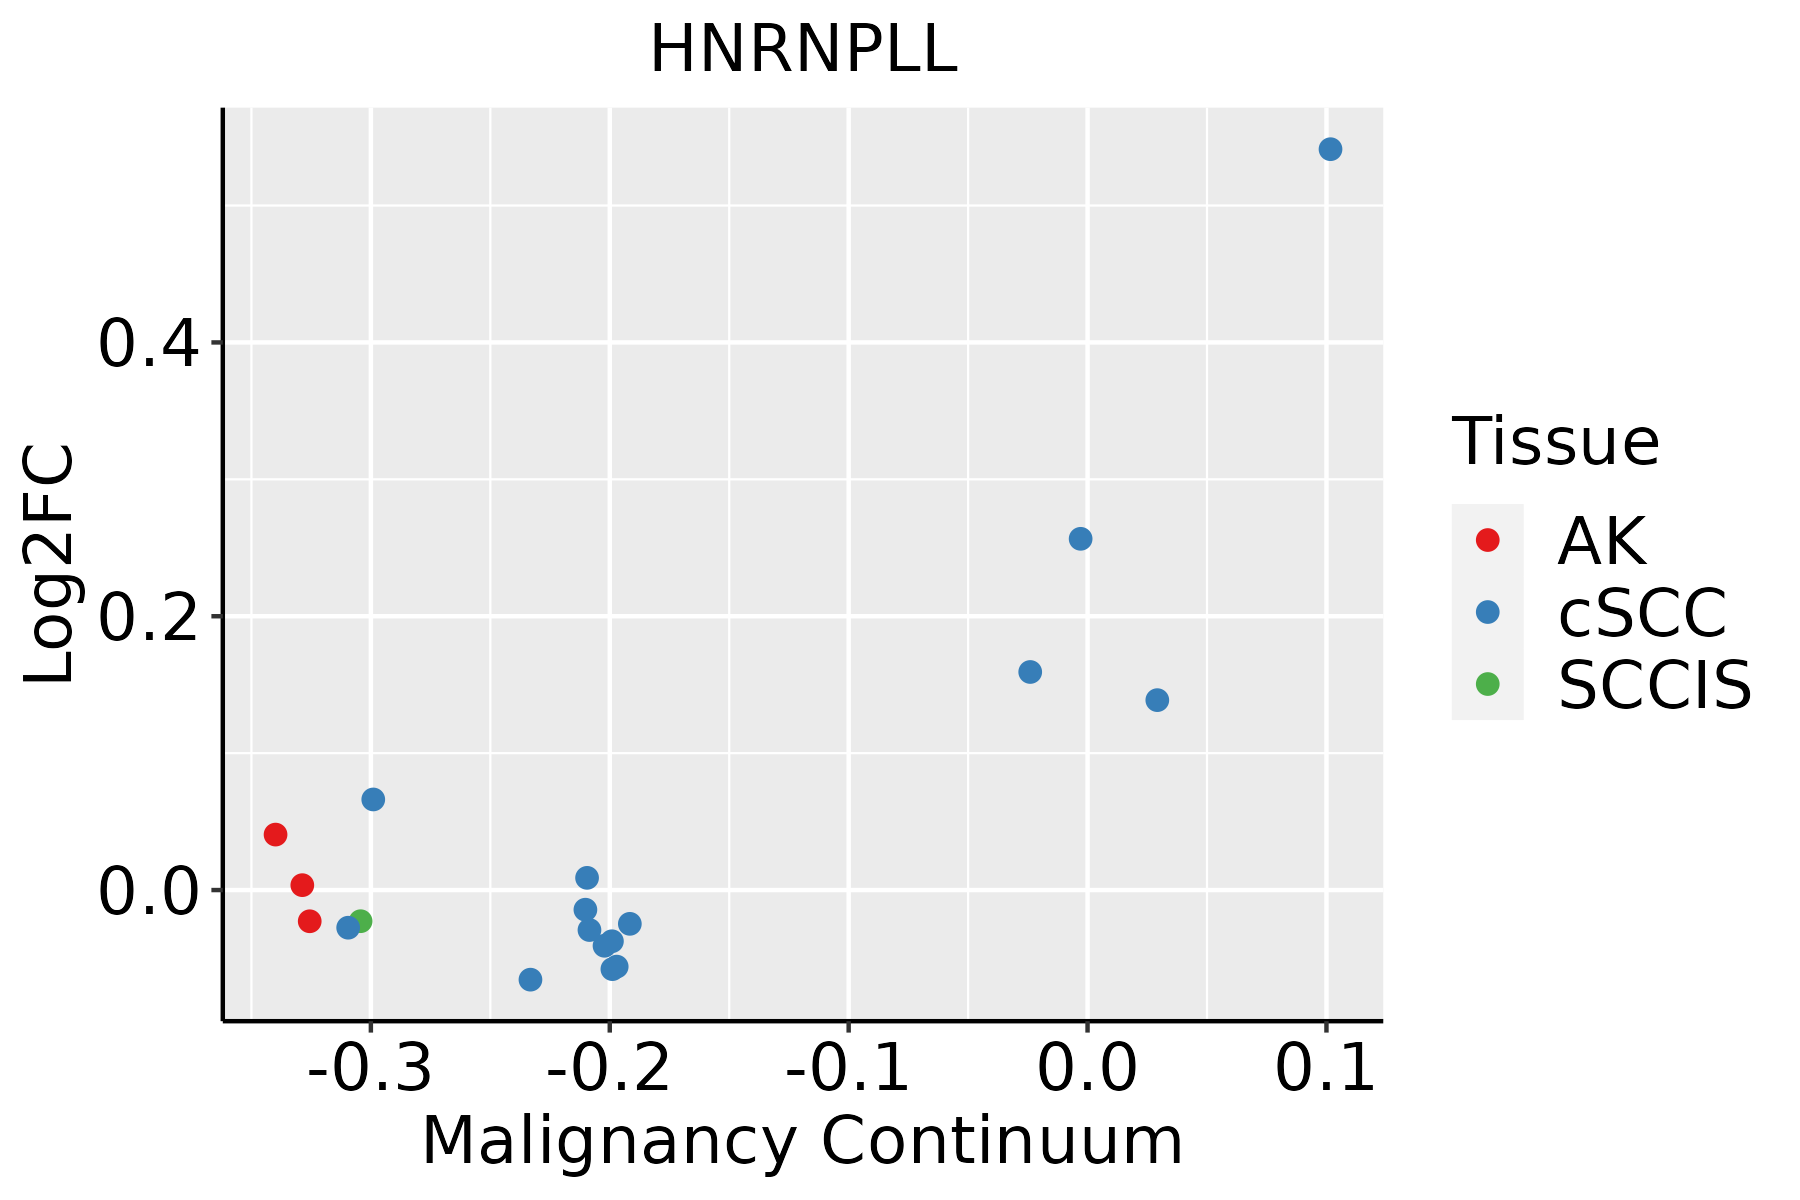 | AK: Actinic keratosis |
| cSCC: Cutaneous squamous cell carcinoma | ||
| SCCIS:squamous cell carcinoma in situ |
| ∗log2FC in expression of this searched gene in stem-like cells from each diseased tissue sample relative to stem-like cells in normal samples in each tissue plotted against the malignancy continuum. Samples are colored based on if they are from different disease stage. |
Top |
Malignant transformation related pathway analysis |
| Find out the enriched GO biological processes and KEGG pathways involved in transition from healthy to precancer to cancer |
| Tissue | Disease Stage | Enriched GO biological Processes |
| Colorectum | AD |  |
| Colorectum | SER |  |
| Colorectum | MSS |  |
| Colorectum | MSI-H |  |
| Colorectum | FAP |  |
| ∗Top 15 enriched GO BP terms are showed in the bar plot of each disease state in each tissue. Each row represents a significant GO biological process which is colored according to the -log10(p.adjust). |
| Page: 1 2 3 4 5 6 7 8 9 |
| GO ID | Tissue | Disease Stage | Description | Gene Ratio | Bg Ratio | pvalue | p.adjust | Count |
| GO:0008380111 | Esophagus | ESCC | RNA splicing | 336/8552 | 434/18723 | 1.74e-42 | 3.67e-39 | 336 |
| GO:0043484111 | Esophagus | ESCC | regulation of RNA splicing | 116/8552 | 148/18723 | 3.18e-16 | 2.38e-14 | 116 |
| GO:0033120110 | Esophagus | ESCC | positive regulation of RNA splicing | 29/8552 | 37/18723 | 4.97e-05 | 3.86e-04 | 29 |
| GO:000838022 | Liver | HCC | RNA splicing | 313/7958 | 434/18723 | 1.36e-36 | 1.73e-33 | 313 |
| GO:004348422 | Liver | HCC | regulation of RNA splicing | 113/7958 | 148/18723 | 4.32e-17 | 4.15e-15 | 113 |
| GO:003312012 | Liver | HCC | positive regulation of RNA splicing | 29/7958 | 37/18723 | 9.37e-06 | 1.09e-04 | 29 |
| GO:000838020 | Oral cavity | OSCC | RNA splicing | 308/7305 | 434/18723 | 2.43e-42 | 7.70e-39 | 308 |
| GO:004348420 | Oral cavity | OSCC | regulation of RNA splicing | 108/7305 | 148/18723 | 4.25e-17 | 3.69e-15 | 108 |
| GO:003312018 | Oral cavity | OSCC | positive regulation of RNA splicing | 29/7305 | 37/18723 | 1.21e-06 | 1.61e-05 | 29 |
| GO:0008380112 | Skin | cSCC | RNA splicing | 263/4864 | 434/18723 | 2.45e-53 | 5.13e-50 | 263 |
| GO:004348429 | Skin | cSCC | regulation of RNA splicing | 97/4864 | 148/18723 | 4.66e-24 | 1.08e-21 | 97 |
| GO:0033120111 | Skin | cSCC | positive regulation of RNA splicing | 27/4864 | 37/18723 | 2.95e-09 | 1.03e-07 | 27 |
| Page: 1 |
| Pathway ID | Tissue | Disease Stage | Description | Gene Ratio | Bg Ratio | pvalue | p.adjust | qvalue | Count |
| Page: 1 |
Top |
Cell-cell communication analysis |
| Identification of potential cell-cell interactions between two cell types and their ligand-receptor pairs for different disease states |
| Ligand | Receptor | LRpair | Pathway | Tissue | Disease Stage |
| Page: 1 |
Top |
Single-cell gene regulatory network inference analysis |
| Find out the significant the regulons (TFs) and the target genes of each regulon across cell types for different disease states |
| TF | Cell Type | Tissue | Disease Stage | Target Gene | RSS | Regulon Activity |
| ∗The dot plots of a searched regulon are shown for all cell subpopulations in each disease state of each tissue based on the regulon specific score inferred using pySCENIC and by calculating the average expression. |
| Page: 1 |
Top |
Somatic mutation of malignant transformation related genes |
| Annotation of somatic variants for genes involved in malignant transformation |
| Hugo Symbol | Variant Class | Variant Classification | dbSNP RS | HGVSc | HGVSp | HGVSp Short | SWISSPROT | BIOTYPE | SIFT | PolyPhen | Tumor Sample Barcode | Tissue | Histology | Sex | Age | Stage | Therapy Types | Drugs | Outcome |
| HNRNPLL | SNV | Missense_Mutation | c.1177N>G | p.Asn393Asp | p.N393D | Q8WVV9 | protein_coding | deleterious(0.01) | possibly_damaging(0.885) | TCGA-A8-A08S-01 | Breast | breast invasive carcinoma | Female | >=65 | I/II | Hormone Therapy | anastrozole | SD | |
| HNRNPLL | SNV | Missense_Mutation | novel | c.1092G>T | p.Lys364Asn | p.K364N | Q8WVV9 | protein_coding | deleterious(0) | probably_damaging(0.963) | TCGA-2W-A8YY-01 | Cervix | cervical & endocervical cancer | Female | <65 | I/II | Chemotherapy | cisplatin | CR |
| HNRNPLL | SNV | Missense_Mutation | novel | c.170N>A | p.Gly57Asp | p.G57D | Q8WVV9 | protein_coding | tolerated(0.29) | benign(0.234) | TCGA-A6-6780-01 | Colorectum | colon adenocarcinoma | Male | >=65 | I/II | Unknown | Unknown | SD |
| HNRNPLL | SNV | Missense_Mutation | novel | c.362T>C | p.Ile121Thr | p.I121T | Q8WVV9 | protein_coding | deleterious(0.01) | possibly_damaging(0.593) | TCGA-AA-3949-01 | Colorectum | colon adenocarcinoma | Female | >=65 | III/IV | Unknown | Unknown | SD |
| HNRNPLL | SNV | Missense_Mutation | c.295N>A | p.Phe99Ile | p.F99I | Q8WVV9 | protein_coding | deleterious(0) | probably_damaging(0.993) | TCGA-AZ-6598-01 | Colorectum | colon adenocarcinoma | Female | >=65 | I/II | Unknown | Unknown | SD | |
| HNRNPLL | SNV | Missense_Mutation | novel | c.802N>T | p.Asp268Tyr | p.D268Y | Q8WVV9 | protein_coding | deleterious(0) | possibly_damaging(0.454) | TCGA-A5-A0G1-01 | Endometrium | uterine corpus endometrioid carcinoma | Female | >=65 | I/II | Unknown | Unknown | SD |
| HNRNPLL | SNV | Missense_Mutation | novel | c.1283N>G | p.Lys428Arg | p.K428R | Q8WVV9 | protein_coding | tolerated(0.09) | benign(0.019) | TCGA-A5-A0G2-01 | Endometrium | uterine corpus endometrioid carcinoma | Female | <65 | III/IV | Unknown | Unknown | SD |
| HNRNPLL | SNV | Missense_Mutation | rs779130914 | c.527N>T | p.Pro176Leu | p.P176L | Q8WVV9 | protein_coding | deleterious(0.02) | possibly_damaging(0.778) | TCGA-AJ-A3EL-01 | Endometrium | uterine corpus endometrioid carcinoma | Female | <65 | I/II | Unknown | Unknown | SD |
| HNRNPLL | SNV | Missense_Mutation | c.736N>T | p.Arg246Cys | p.R246C | Q8WVV9 | protein_coding | deleterious(0) | possibly_damaging(0.531) | TCGA-AX-A06F-01 | Endometrium | uterine corpus endometrioid carcinoma | Female | <65 | III/IV | Chemotherapy | carboplatin | SD | |
| HNRNPLL | SNV | Missense_Mutation | c.1337N>C | p.Lys446Thr | p.K446T | Q8WVV9 | protein_coding | deleterious(0) | possibly_damaging(0.794) | TCGA-B5-A0JY-01 | Endometrium | uterine corpus endometrioid carcinoma | Female | <65 | III/IV | Chemotherapy | doxorubicin | SD |
| Page: 1 2 3 |
Top |
Related drugs of malignant transformation related genes |
| Identification of chemicals and drugs interact with genes involved in malignant transfromation |
| (DGIdb 4.0) |
| Entrez ID | Symbol | Category | Interaction Types | Drug Claim Name | Drug Name | PMIDs |
| Page: 1 |

Copyright 2023-Present -The University of Texas Health Science Center at Houston |