
|
|||||
|
 | |
| |
| |
| |
| |
| |
|
Gene: HNRNPH2 |
Gene summary for HNRNPH2 |
| Gene information | Species | Human | Gene symbol | HNRNPH2 | Gene ID | 3188 |
| Gene name | heterogeneous nuclear ribonucleoprotein H2 | |
| Gene Alias | FTP3 | |
| Cytomap | Xq22.1 | |
| Gene Type | protein-coding | GO ID | GO:0006139 | UniProtAcc | P55795 |
Top |
Malignant transformation analysis |
| Identification of the aberrant gene expression in precancerous and cancerous lesions by comparing the gene expression of stem-like cells in diseased tissues with normal stem cells |
| Entrez ID | Symbol | Replicates | Species | Organ | Tissue | Adj P-value | Log2FC | Malignancy |
| 3188 | HNRNPH2 | HTA11_78_2000001011 | Human | Colorectum | AD | 1.37e-03 | 1.70e-01 | -0.1088 |
| 3188 | HNRNPH2 | HTA11_347_2000001011 | Human | Colorectum | AD | 3.85e-07 | 2.55e-01 | -0.1954 |
| 3188 | HNRNPH2 | HTA11_866_3004761011 | Human | Colorectum | AD | 3.70e-08 | 3.09e-01 | 0.096 |
| 3188 | HNRNPH2 | HTA11_7663_2000001011 | Human | Colorectum | SER | 3.15e-02 | 2.99e-01 | 0.0131 |
| 3188 | HNRNPH2 | HTA11_6801_2000001011 | Human | Colorectum | SER | 2.60e-04 | 5.86e-01 | 0.0171 |
| 3188 | HNRNPH2 | HTA11_99999970781_79442 | Human | Colorectum | MSS | 1.95e-16 | 4.12e-01 | 0.294 |
| 3188 | HNRNPH2 | HTA11_99999965104_69814 | Human | Colorectum | MSS | 1.32e-05 | 3.04e-01 | 0.281 |
| 3188 | HNRNPH2 | HTA11_99999971662_82457 | Human | Colorectum | MSS | 5.05e-06 | 3.55e-01 | 0.3859 |
| 3188 | HNRNPH2 | HTA11_99999974143_84620 | Human | Colorectum | MSS | 2.59e-04 | 2.27e-01 | 0.3005 |
| 3188 | HNRNPH2 | LZE4T | Human | Esophagus | ESCC | 8.47e-20 | 5.50e-01 | 0.0811 |
| 3188 | HNRNPH2 | LZE7T | Human | Esophagus | ESCC | 5.31e-07 | 6.01e-01 | 0.0667 |
| 3188 | HNRNPH2 | LZE8T | Human | Esophagus | ESCC | 1.77e-08 | 2.60e-01 | 0.067 |
| 3188 | HNRNPH2 | LZE20T | Human | Esophagus | ESCC | 7.44e-12 | 3.95e-01 | 0.0662 |
| 3188 | HNRNPH2 | LZE22T | Human | Esophagus | ESCC | 6.98e-06 | 3.65e-01 | 0.068 |
| 3188 | HNRNPH2 | LZE24T | Human | Esophagus | ESCC | 1.39e-28 | 8.73e-01 | 0.0596 |
| 3188 | HNRNPH2 | LZE21T | Human | Esophagus | ESCC | 2.06e-03 | 4.48e-01 | 0.0655 |
| 3188 | HNRNPH2 | LZE6T | Human | Esophagus | ESCC | 1.77e-10 | 5.11e-01 | 0.0845 |
| 3188 | HNRNPH2 | P1T-E | Human | Esophagus | ESCC | 4.45e-02 | 3.97e-01 | 0.0875 |
| 3188 | HNRNPH2 | P2T-E | Human | Esophagus | ESCC | 2.46e-19 | 2.16e-01 | 0.1177 |
| 3188 | HNRNPH2 | P4T-E | Human | Esophagus | ESCC | 1.01e-17 | 2.53e-01 | 0.1323 |
| Page: 1 2 3 4 5 6 7 |
| Tissue | Expression Dynamics | Abbreviation |
| Colorectum (GSE201348) |  | FAP: Familial adenomatous polyposis |
| CRC: Colorectal cancer | ||
| Colorectum (HTA11) |  | AD: Adenomas |
| SER: Sessile serrated lesions | ||
| MSI-H: Microsatellite-high colorectal cancer | ||
| MSS: Microsatellite stable colorectal cancer | ||
| Esophagus |  | ESCC: Esophageal squamous cell carcinoma |
| HGIN: High-grade intraepithelial neoplasias | ||
| LGIN: Low-grade intraepithelial neoplasias | ||
| Liver | 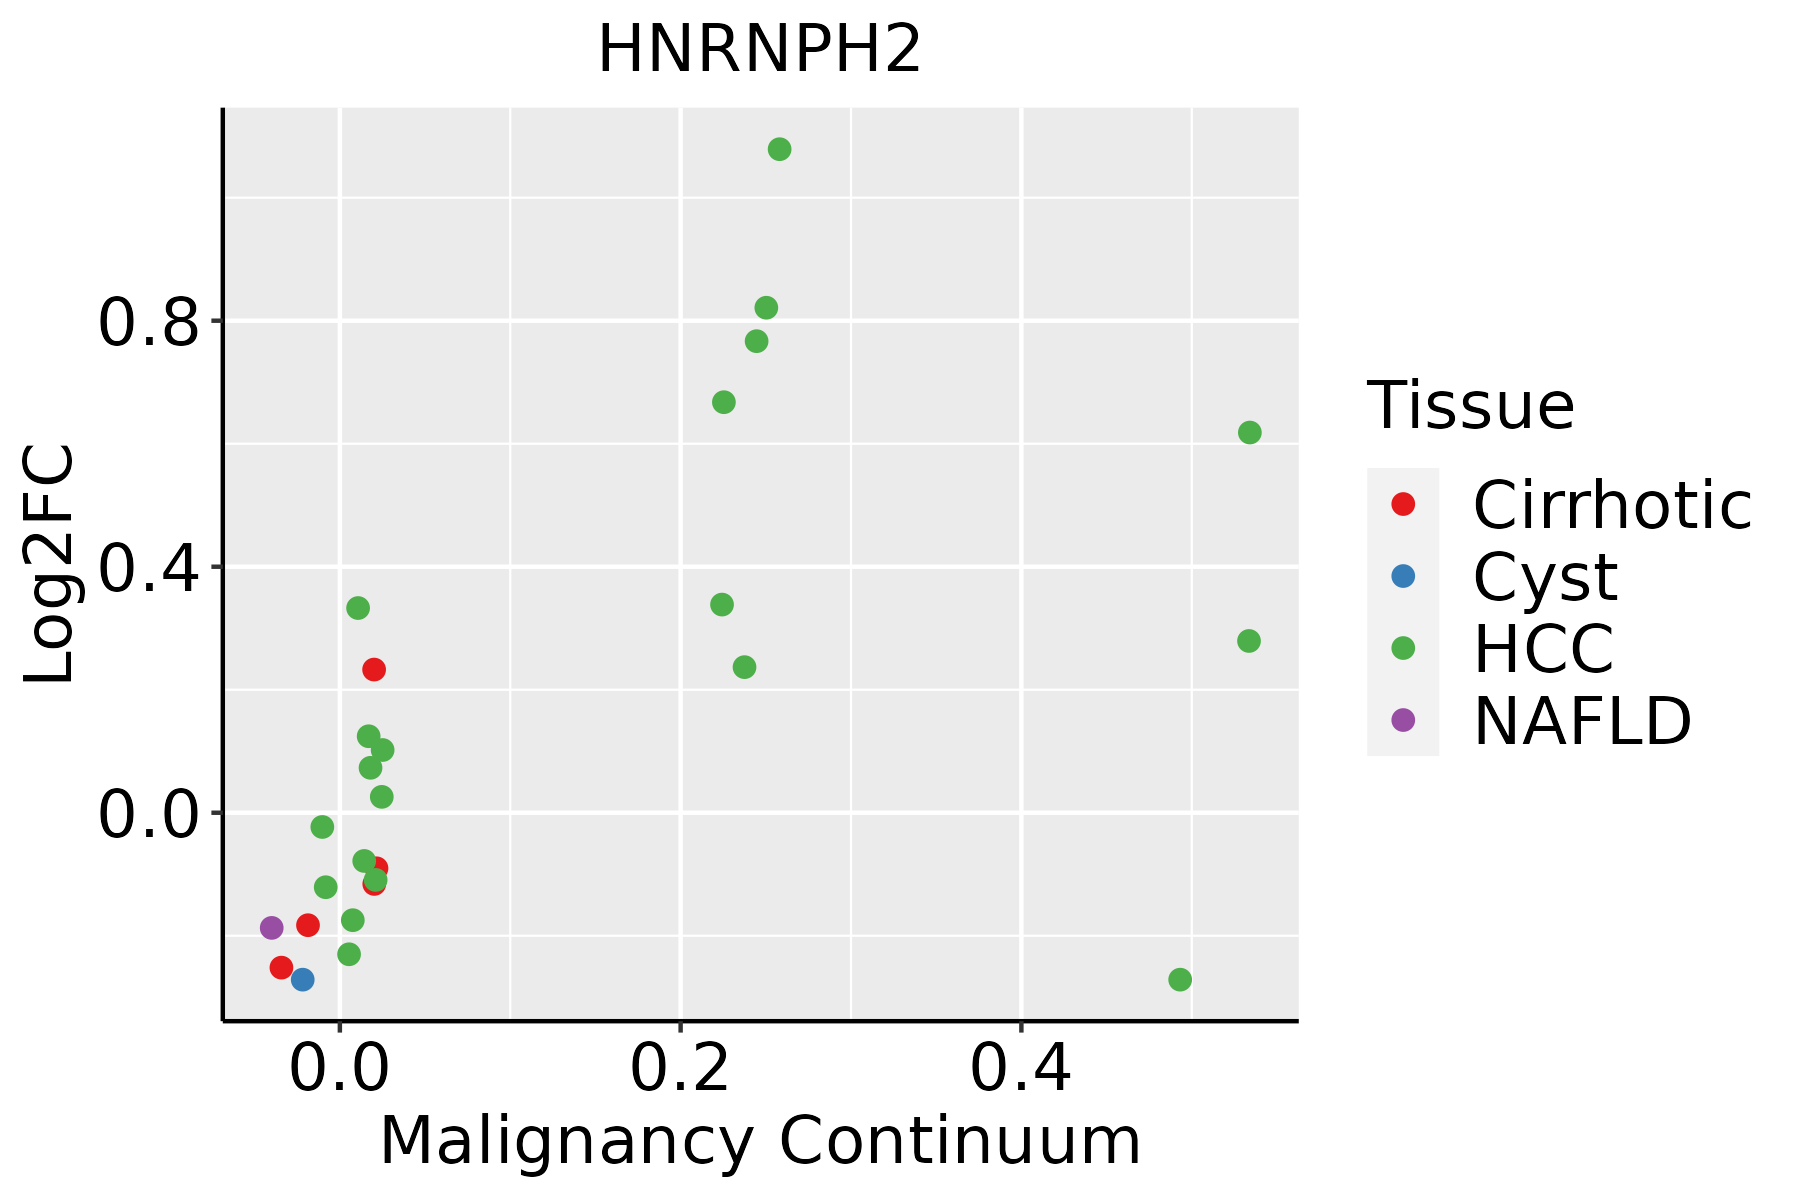 | HCC: Hepatocellular carcinoma |
| NAFLD: Non-alcoholic fatty liver disease | ||
| Oral Cavity | 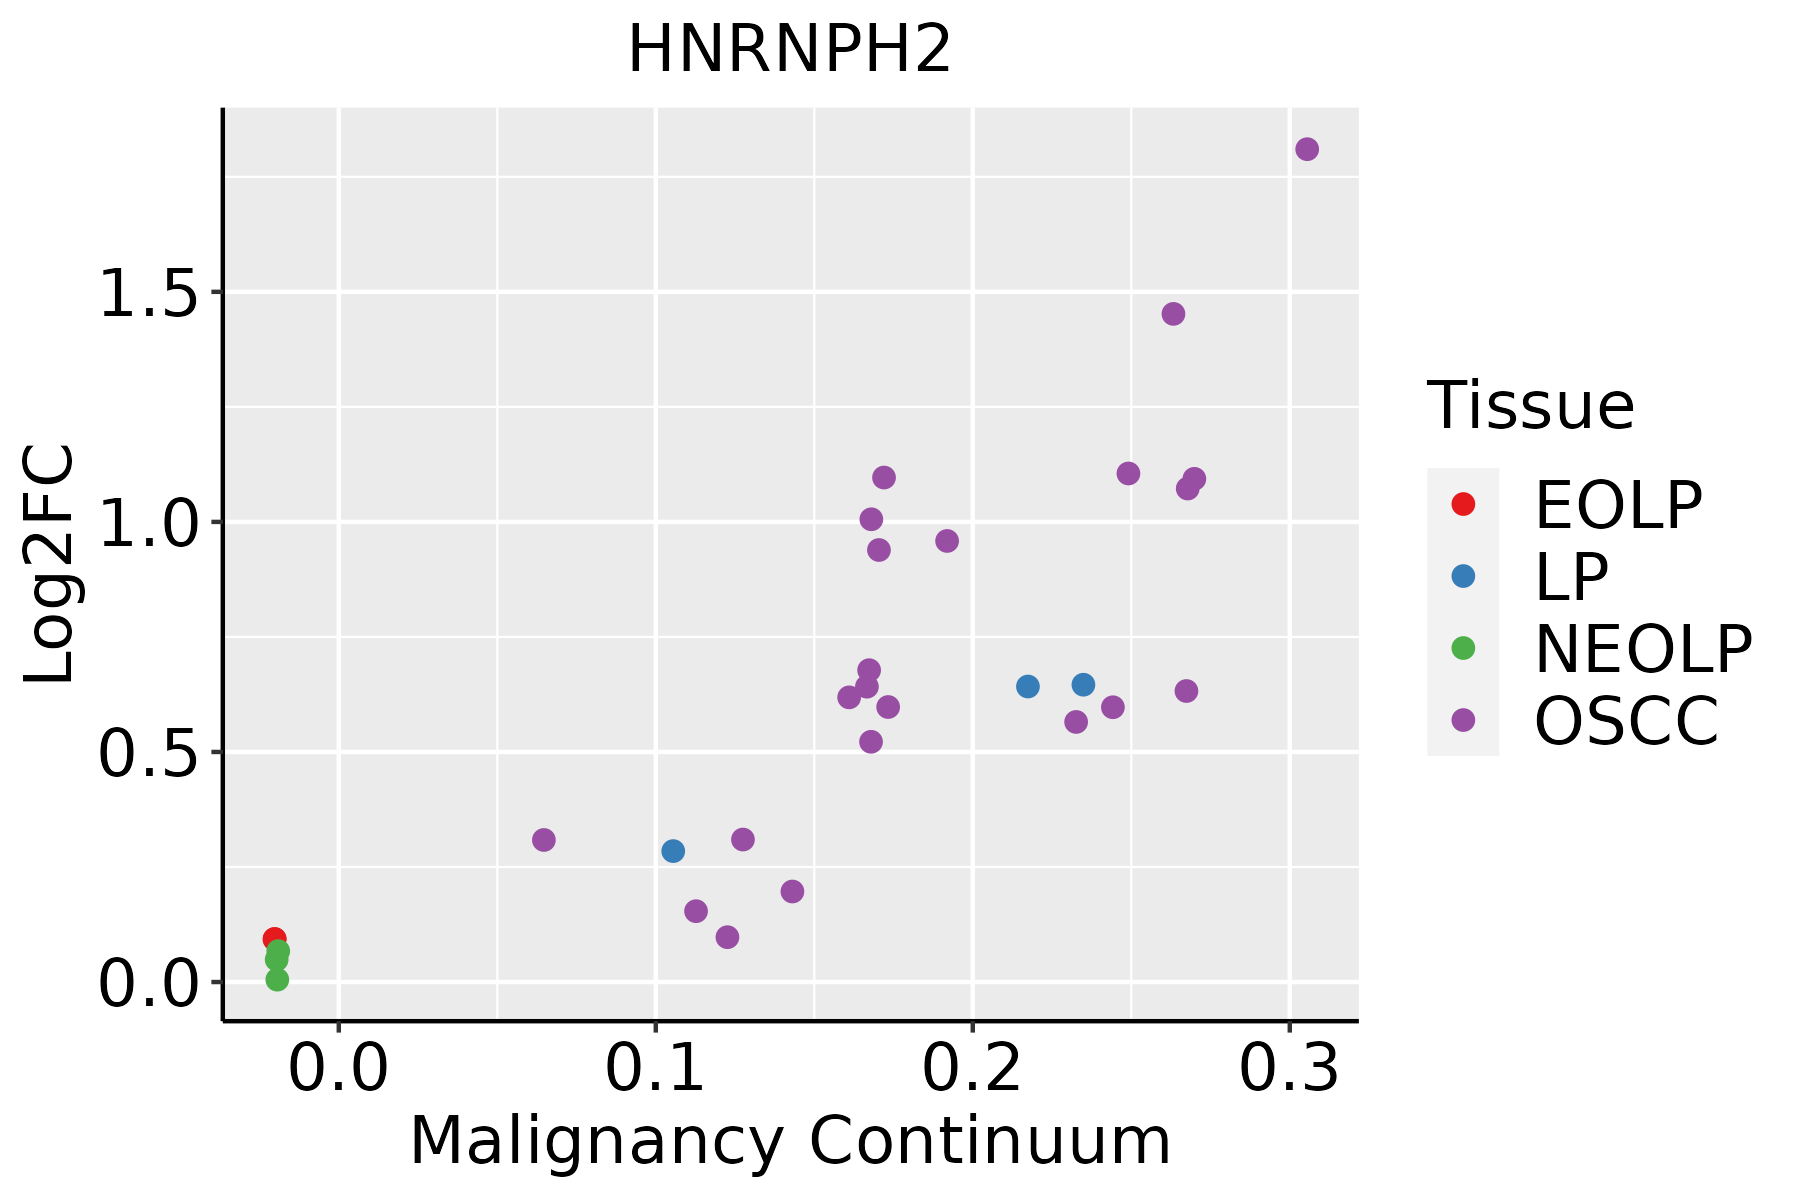 | EOLP: Erosive Oral lichen planus |
| LP: leukoplakia | ||
| NEOLP: Non-erosive oral lichen planus | ||
| OSCC: Oral squamous cell carcinoma | ||
| Skin | 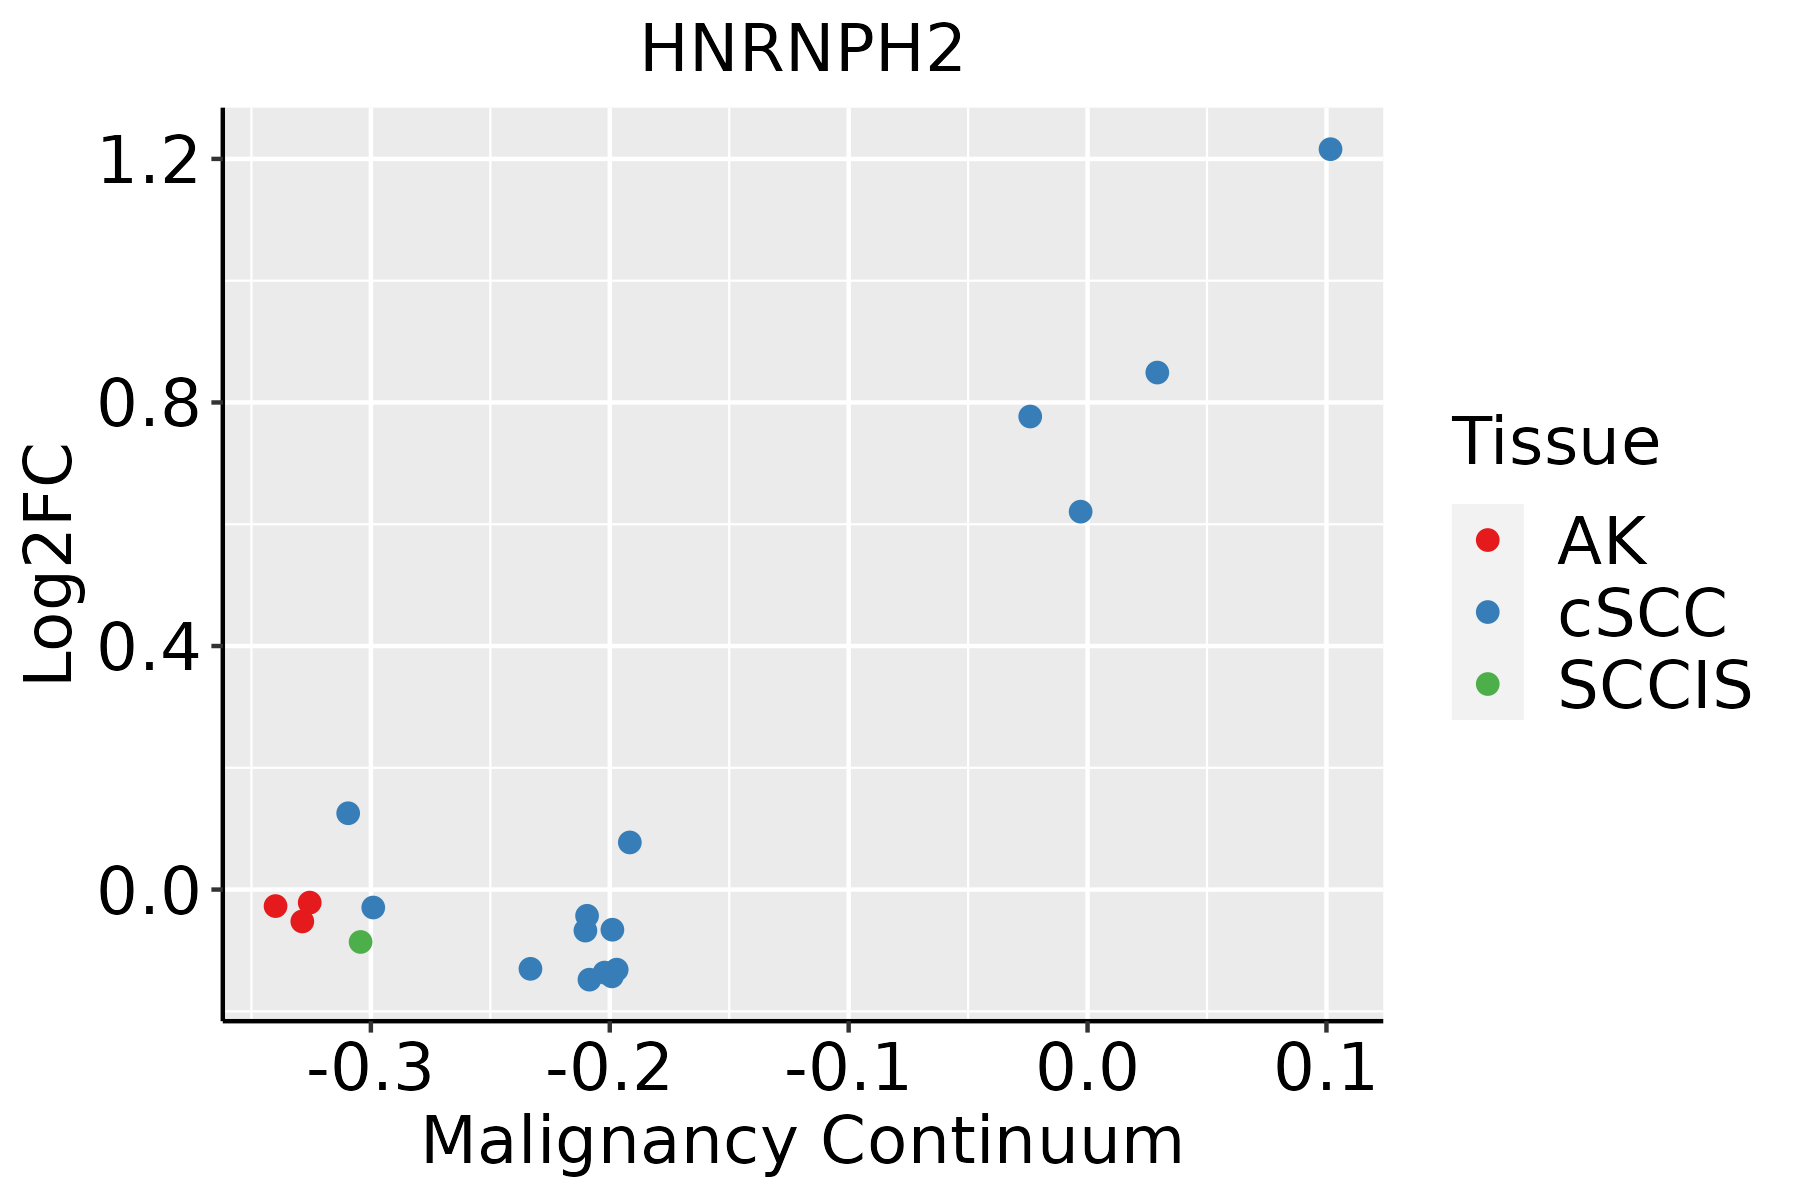 | AK: Actinic keratosis |
| cSCC: Cutaneous squamous cell carcinoma | ||
| SCCIS:squamous cell carcinoma in situ | ||
| Thyroid | 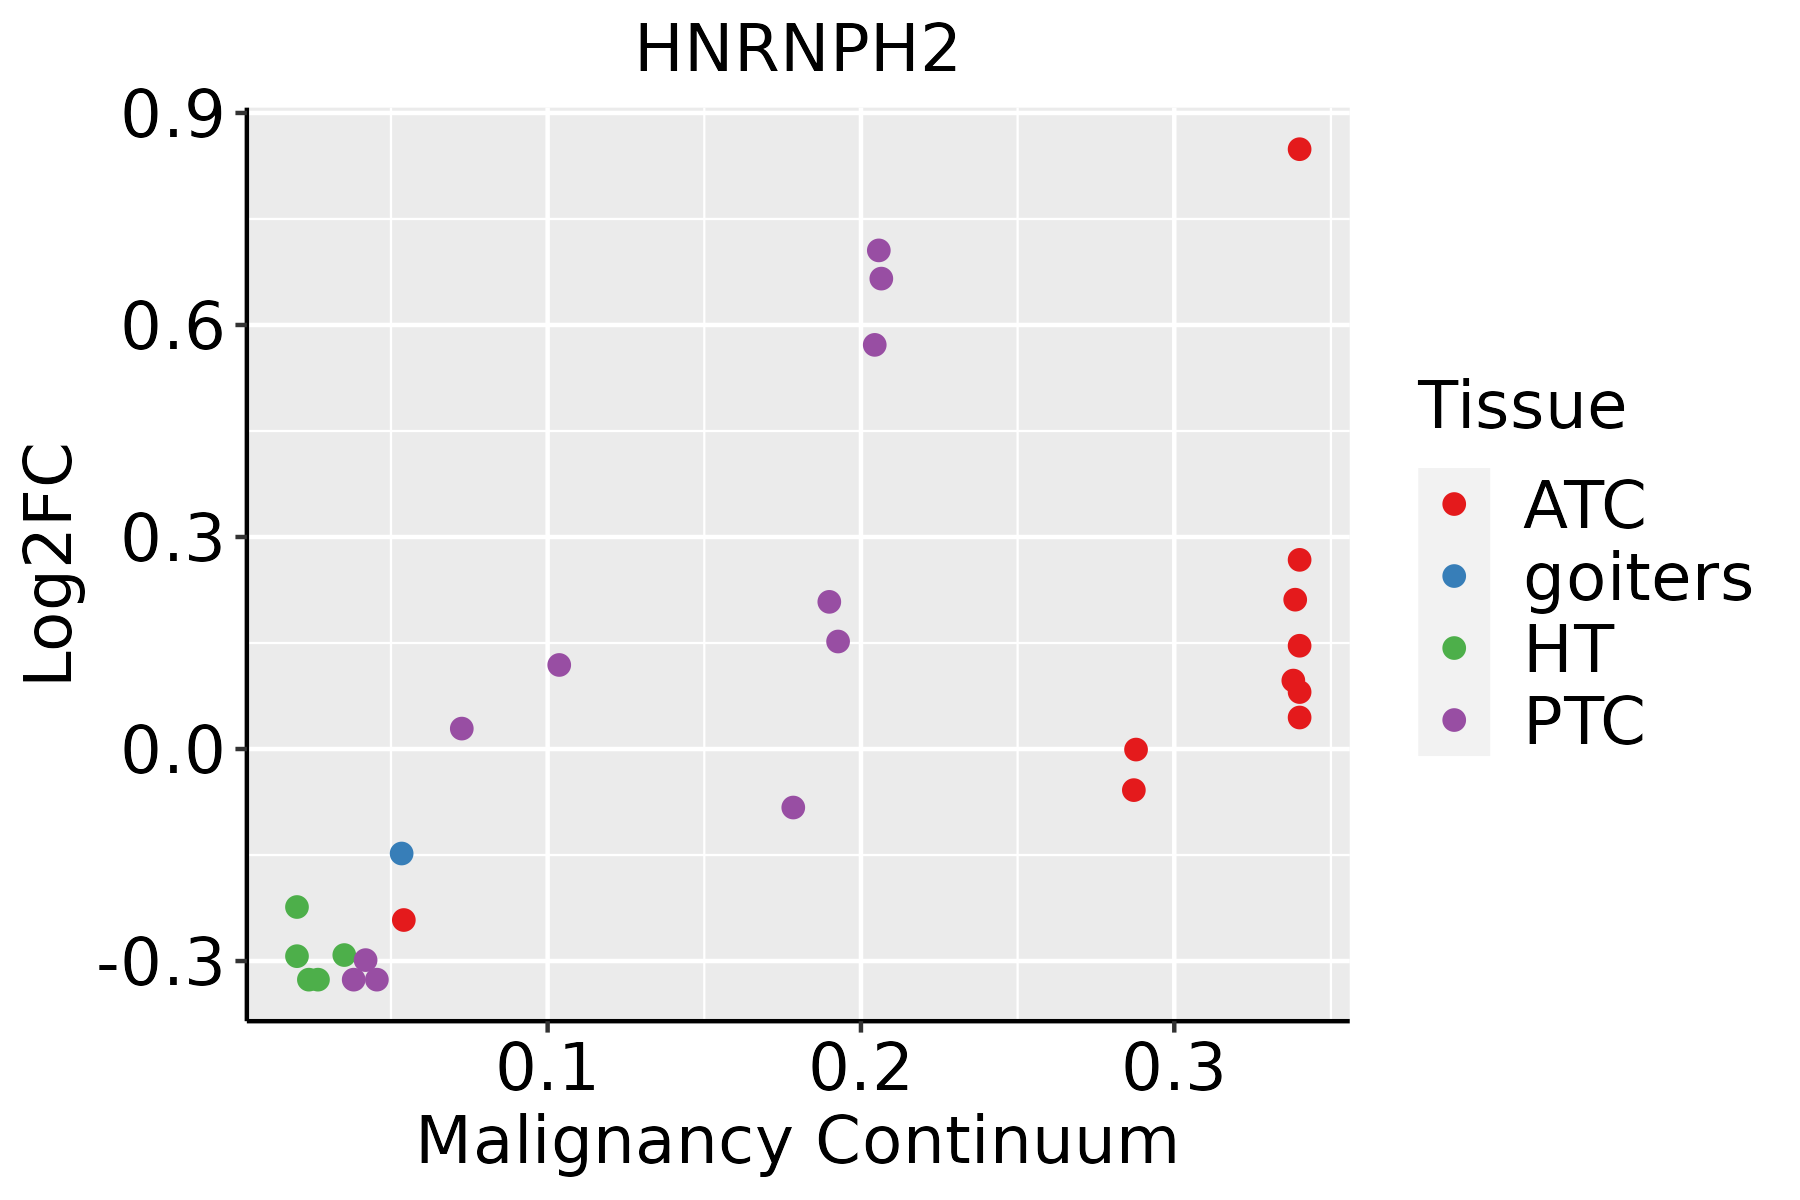 | ATC: Anaplastic thyroid cancer |
| HT: Hashimoto's thyroiditis | ||
| PTC: Papillary thyroid cancer |
| ∗log2FC in expression of this searched gene in stem-like cells from each diseased tissue sample relative to stem-like cells in normal samples in each tissue plotted against the malignancy continuum. Samples are colored based on if they are from different disease stage. |
Top |
Malignant transformation related pathway analysis |
| Find out the enriched GO biological processes and KEGG pathways involved in transition from healthy to precancer to cancer |
| Tissue | Disease Stage | Enriched GO biological Processes |
| Colorectum | AD |  |
| Colorectum | SER |  |
| Colorectum | MSS |  |
| Colorectum | MSI-H |  |
| Colorectum | FAP |  |
| ∗Top 15 enriched GO BP terms are showed in the bar plot of each disease state in each tissue. Each row represents a significant GO biological process which is colored according to the -log10(p.adjust). |
| Page: 1 2 3 4 5 6 7 8 9 |
| GO ID | Tissue | Disease Stage | Description | Gene Ratio | Bg Ratio | pvalue | p.adjust | Count |
| GO:0008380 | Colorectum | AD | RNA splicing | 169/3918 | 434/18723 | 3.59e-18 | 2.04e-15 | 169 |
| GO:0043484 | Colorectum | AD | regulation of RNA splicing | 70/3918 | 148/18723 | 6.47e-13 | 1.16e-10 | 70 |
| GO:00083801 | Colorectum | SER | RNA splicing | 123/2897 | 434/18723 | 3.84e-12 | 8.41e-10 | 123 |
| GO:00434841 | Colorectum | SER | regulation of RNA splicing | 49/2897 | 148/18723 | 7.02e-08 | 4.49e-06 | 49 |
| GO:00083802 | Colorectum | MSS | RNA splicing | 159/3467 | 434/18723 | 1.75e-19 | 1.22e-16 | 159 |
| GO:00434842 | Colorectum | MSS | regulation of RNA splicing | 66/3467 | 148/18723 | 2.44e-13 | 5.25e-11 | 66 |
| GO:0008380111 | Esophagus | ESCC | RNA splicing | 336/8552 | 434/18723 | 1.74e-42 | 3.67e-39 | 336 |
| GO:0043484111 | Esophagus | ESCC | regulation of RNA splicing | 116/8552 | 148/18723 | 3.18e-16 | 2.38e-14 | 116 |
| GO:000838012 | Liver | Cirrhotic | RNA splicing | 229/4634 | 434/18723 | 9.13e-37 | 2.86e-33 | 229 |
| GO:004348412 | Liver | Cirrhotic | regulation of RNA splicing | 85/4634 | 148/18723 | 2.03e-17 | 2.83e-15 | 85 |
| GO:000838022 | Liver | HCC | RNA splicing | 313/7958 | 434/18723 | 1.36e-36 | 1.73e-33 | 313 |
| GO:004348422 | Liver | HCC | regulation of RNA splicing | 113/7958 | 148/18723 | 4.32e-17 | 4.15e-15 | 113 |
| GO:000838020 | Oral cavity | OSCC | RNA splicing | 308/7305 | 434/18723 | 2.43e-42 | 7.70e-39 | 308 |
| GO:004348420 | Oral cavity | OSCC | regulation of RNA splicing | 108/7305 | 148/18723 | 4.25e-17 | 3.69e-15 | 108 |
| GO:0008380110 | Oral cavity | LP | RNA splicing | 237/4623 | 434/18723 | 1.82e-41 | 3.79e-38 | 237 |
| GO:0043484110 | Oral cavity | LP | regulation of RNA splicing | 81/4623 | 148/18723 | 4.34e-15 | 5.79e-13 | 81 |
| GO:0008380112 | Skin | cSCC | RNA splicing | 263/4864 | 434/18723 | 2.45e-53 | 5.13e-50 | 263 |
| GO:004348429 | Skin | cSCC | regulation of RNA splicing | 97/4864 | 148/18723 | 4.66e-24 | 1.08e-21 | 97 |
| GO:004348430 | Thyroid | HT | regulation of RNA splicing | 46/1272 | 148/18723 | 4.82e-19 | 6.71e-16 | 46 |
| GO:000838028 | Thyroid | HT | RNA splicing | 84/1272 | 434/18723 | 1.23e-18 | 1.14e-15 | 84 |
| Page: 1 2 |
| Pathway ID | Tissue | Disease Stage | Description | Gene Ratio | Bg Ratio | pvalue | p.adjust | qvalue | Count |
| Page: 1 |
Top |
Cell-cell communication analysis |
| Identification of potential cell-cell interactions between two cell types and their ligand-receptor pairs for different disease states |
| Ligand | Receptor | LRpair | Pathway | Tissue | Disease Stage |
| Page: 1 |
Top |
Single-cell gene regulatory network inference analysis |
| Find out the significant the regulons (TFs) and the target genes of each regulon across cell types for different disease states |
| TF | Cell Type | Tissue | Disease Stage | Target Gene | RSS | Regulon Activity |
| ∗The dot plots of a searched regulon are shown for all cell subpopulations in each disease state of each tissue based on the regulon specific score inferred using pySCENIC and by calculating the average expression. |
| Page: 1 |
Top |
Somatic mutation of malignant transformation related genes |
| Annotation of somatic variants for genes involved in malignant transformation |
| Hugo Symbol | Variant Class | Variant Classification | dbSNP RS | HGVSc | HGVSp | HGVSp Short | SWISSPROT | BIOTYPE | SIFT | PolyPhen | Tumor Sample Barcode | Tissue | Histology | Sex | Age | Stage | Therapy Types | Drugs | Outcome |
| HNRNPH2 | SNV | Missense_Mutation | c.431N>T | p.Pro144Leu | p.P144L | P55795 | protein_coding | tolerated(0.11) | benign(0.097) | TCGA-AC-A23H-01 | Breast | breast invasive carcinoma | Female | >=65 | I/II | Unknown | Unknown | PD | |
| HNRNPH2 | SNV | Missense_Mutation | c.1329N>A | p.Asp443Glu | p.D443E | P55795 | protein_coding | tolerated_low_confidence(0.06) | benign(0.092) | TCGA-AO-A0J4-01 | Breast | breast invasive carcinoma | Female | <65 | I/II | Chemotherapy | doxorubicin | SD | |
| HNRNPH2 | SNV | Missense_Mutation | c.58N>A | p.Trp20Arg | p.W20R | P55795 | protein_coding | deleterious(0.01) | probably_damaging(1) | TCGA-C8-A12L-01 | Breast | breast invasive carcinoma | Female | >=65 | I/II | Unknown | Unknown | SD | |
| HNRNPH2 | SNV | Missense_Mutation | rs781979799 | c.97N>A | p.Asp33Asn | p.D33N | P55795 | protein_coding | tolerated(0.1) | benign(0.018) | TCGA-D8-A4Z1-01 | Breast | breast invasive carcinoma | Female | >=65 | I/II | Hormone Therapy | tamoxiphen | SD |
| HNRNPH2 | SNV | Missense_Mutation | c.1243C>A | p.Gln415Lys | p.Q415K | P55795 | protein_coding | tolerated(0.47) | benign(0.026) | TCGA-E2-A14P-01 | Breast | breast invasive carcinoma | Female | >=65 | III/IV | Targeted Molecular therapy | trastuzumab | SD | |
| HNRNPH2 | SNV | Missense_Mutation | c.629N>T | p.Tyr210Phe | p.Y210F | P55795 | protein_coding | deleterious(0.02) | possibly_damaging(0.515) | TCGA-LL-A441-01 | Breast | breast invasive carcinoma | Female | <65 | I/II | Chemotherapy | taxotere | CR | |
| HNRNPH2 | SNV | Missense_Mutation | novel | c.436G>A | p.Asp146Asn | p.D146N | P55795 | protein_coding | deleterious(0.03) | probably_damaging(0.991) | TCGA-PL-A8LZ-01 | Breast | breast invasive carcinoma | Female | <65 | III/IV | Chemotherapy | paclitaxel | SD |
| HNRNPH2 | SNV | Missense_Mutation | rs886039764 | c.617N>A | p.Arg206Gln | p.R206Q | P55795 | protein_coding | tolerated(0.09) | benign(0.025) | TCGA-WL-A834-01 | Cervix | cervical & endocervical cancer | Female | <65 | I/II | Chemotherapy | paclitaxel | SD |
| HNRNPH2 | SNV | Missense_Mutation | c.875N>G | p.His292Arg | p.H292R | P55795 | protein_coding | tolerated(0.07) | benign(0.176) | TCGA-DM-A1HB-01 | Colorectum | colon adenocarcinoma | Male | >=65 | III/IV | Unknown | Unknown | SD | |
| HNRNPH2 | SNV | Missense_Mutation | c.733N>C | p.Asp245His | p.D245H | P55795 | protein_coding | tolerated(0.11) | benign(0.014) | TCGA-EI-6885-01 | Colorectum | rectum adenocarcinoma | Female | <65 | III/IV | Chemotherapy | oxaliplatinum+5-fu | PD |
| Page: 1 2 3 4 5 6 7 |
Top |
Related drugs of malignant transformation related genes |
| Identification of chemicals and drugs interact with genes involved in malignant transfromation |
| (DGIdb 4.0) |
| Entrez ID | Symbol | Category | Interaction Types | Drug Claim Name | Drug Name | PMIDs |
| 3188 | HNRNPH2 | NA | migalastat | MIGALASTAT |
| Page: 1 |

Copyright 2023-Present -The University of Texas Health Science Center at Houston |