
|
|||||
|
 | |
| |
| |
| |
| |
| |
|
Gene: HNRNPH1 |
Gene summary for HNRNPH1 |
| Gene information | Species | Human | Gene symbol | HNRNPH1 | Gene ID | 3187 |
| Gene name | heterogeneous nuclear ribonucleoprotein H1 | |
| Gene Alias | HNRPH | |
| Cytomap | 5q35.3 | |
| Gene Type | protein-coding | GO ID | GO:0000375 | UniProtAcc | P31943 |
Top |
Malignant transformation analysis |
| Identification of the aberrant gene expression in precancerous and cancerous lesions by comparing the gene expression of stem-like cells in diseased tissues with normal stem cells |
| Entrez ID | Symbol | Replicates | Species | Organ | Tissue | Adj P-value | Log2FC | Malignancy |
| 3187 | HNRNPH1 | GSM4909285 | Human | Breast | IDC | 1.81e-06 | -3.55e-01 | 0.21 |
| 3187 | HNRNPH1 | GSM4909286 | Human | Breast | IDC | 1.06e-05 | -2.92e-01 | 0.1081 |
| 3187 | HNRNPH1 | GSM4909296 | Human | Breast | IDC | 4.24e-15 | -4.56e-01 | 0.1524 |
| 3187 | HNRNPH1 | GSM4909297 | Human | Breast | IDC | 2.06e-44 | 7.55e-01 | 0.1517 |
| 3187 | HNRNPH1 | GSM4909298 | Human | Breast | IDC | 1.76e-02 | 2.41e-01 | 0.1551 |
| 3187 | HNRNPH1 | GSM4909306 | Human | Breast | IDC | 1.06e-04 | -3.75e-01 | 0.1564 |
| 3187 | HNRNPH1 | GSM4909311 | Human | Breast | IDC | 6.97e-34 | -4.41e-01 | 0.1534 |
| 3187 | HNRNPH1 | GSM4909312 | Human | Breast | IDC | 3.23e-09 | -3.16e-01 | 0.1552 |
| 3187 | HNRNPH1 | GSM4909316 | Human | Breast | IDC | 3.75e-02 | -5.27e-01 | 0.21 |
| 3187 | HNRNPH1 | GSM4909317 | Human | Breast | IDC | 2.32e-02 | 2.12e-02 | 0.1355 |
| 3187 | HNRNPH1 | GSM4909319 | Human | Breast | IDC | 3.04e-42 | -7.68e-01 | 0.1563 |
| 3187 | HNRNPH1 | GSM4909320 | Human | Breast | IDC | 1.86e-06 | -5.52e-01 | 0.1575 |
| 3187 | HNRNPH1 | GSM4909321 | Human | Breast | IDC | 1.52e-10 | -1.24e-01 | 0.1559 |
| 3187 | HNRNPH1 | brca1 | Human | Breast | Precancer | 7.37e-17 | -5.94e-01 | -0.0338 |
| 3187 | HNRNPH1 | brca3 | Human | Breast | Precancer | 1.68e-03 | -1.99e-01 | -0.0263 |
| 3187 | HNRNPH1 | brca10 | Human | Breast | Precancer | 1.02e-06 | -4.73e-01 | -0.0029 |
| 3187 | HNRNPH1 | NCCBC14 | Human | Breast | DCIS | 4.81e-08 | -2.68e-01 | 0.2021 |
| 3187 | HNRNPH1 | NCCBC5 | Human | Breast | DCIS | 2.05e-09 | -2.03e-01 | 0.2046 |
| 3187 | HNRNPH1 | P1 | Human | Breast | IDC | 1.57e-16 | -5.90e-02 | 0.1527 |
| 3187 | HNRNPH1 | DCIS2 | Human | Breast | DCIS | 3.83e-71 | 9.00e-02 | 0.0085 |
| Page: 1 2 3 4 5 6 7 8 9 10 11 12 |
| Tissue | Expression Dynamics | Abbreviation |
| Breast | 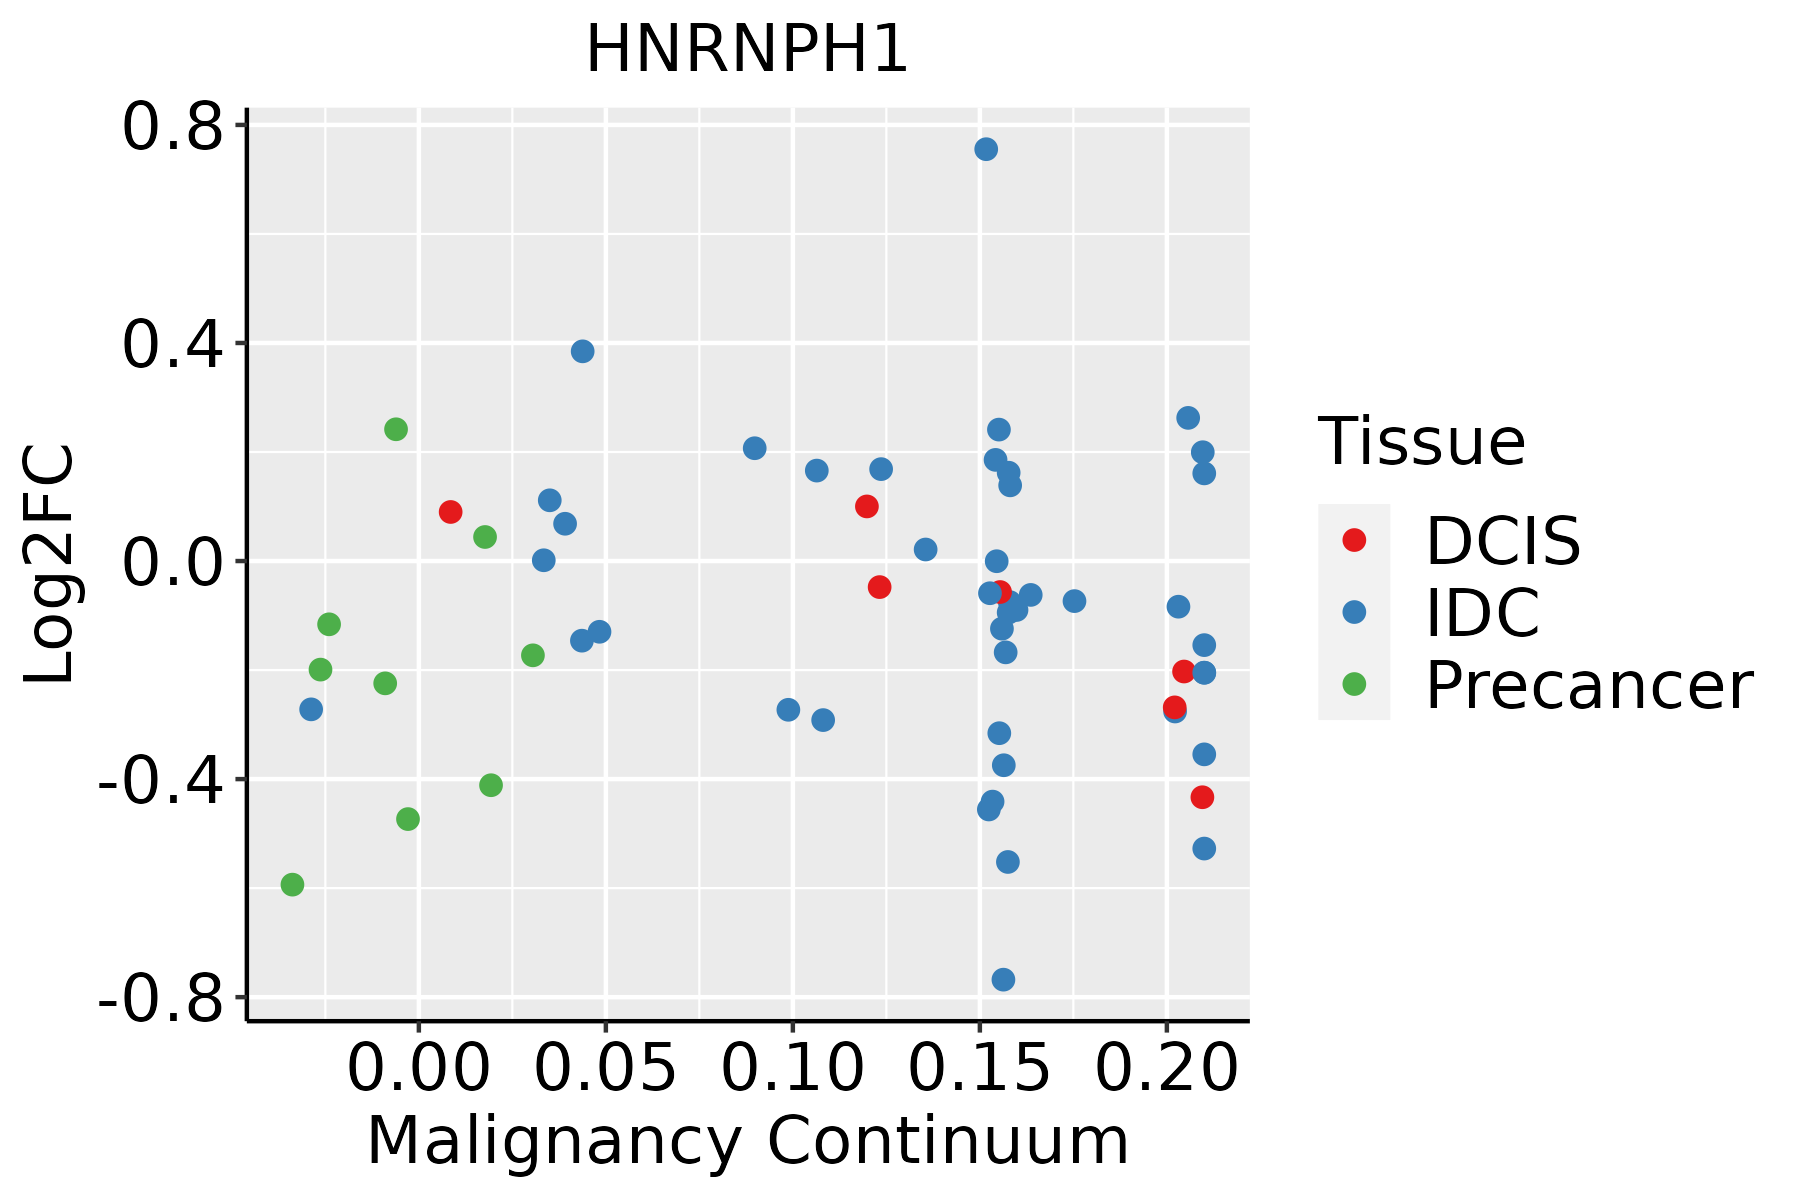 | IDC: Invasive ductal carcinoma |
| DCIS: Ductal carcinoma in situ | ||
| Precancer(BRCA1-mut): Precancerous lesion from BRCA1 mutation carriers | ||
| Cervix | 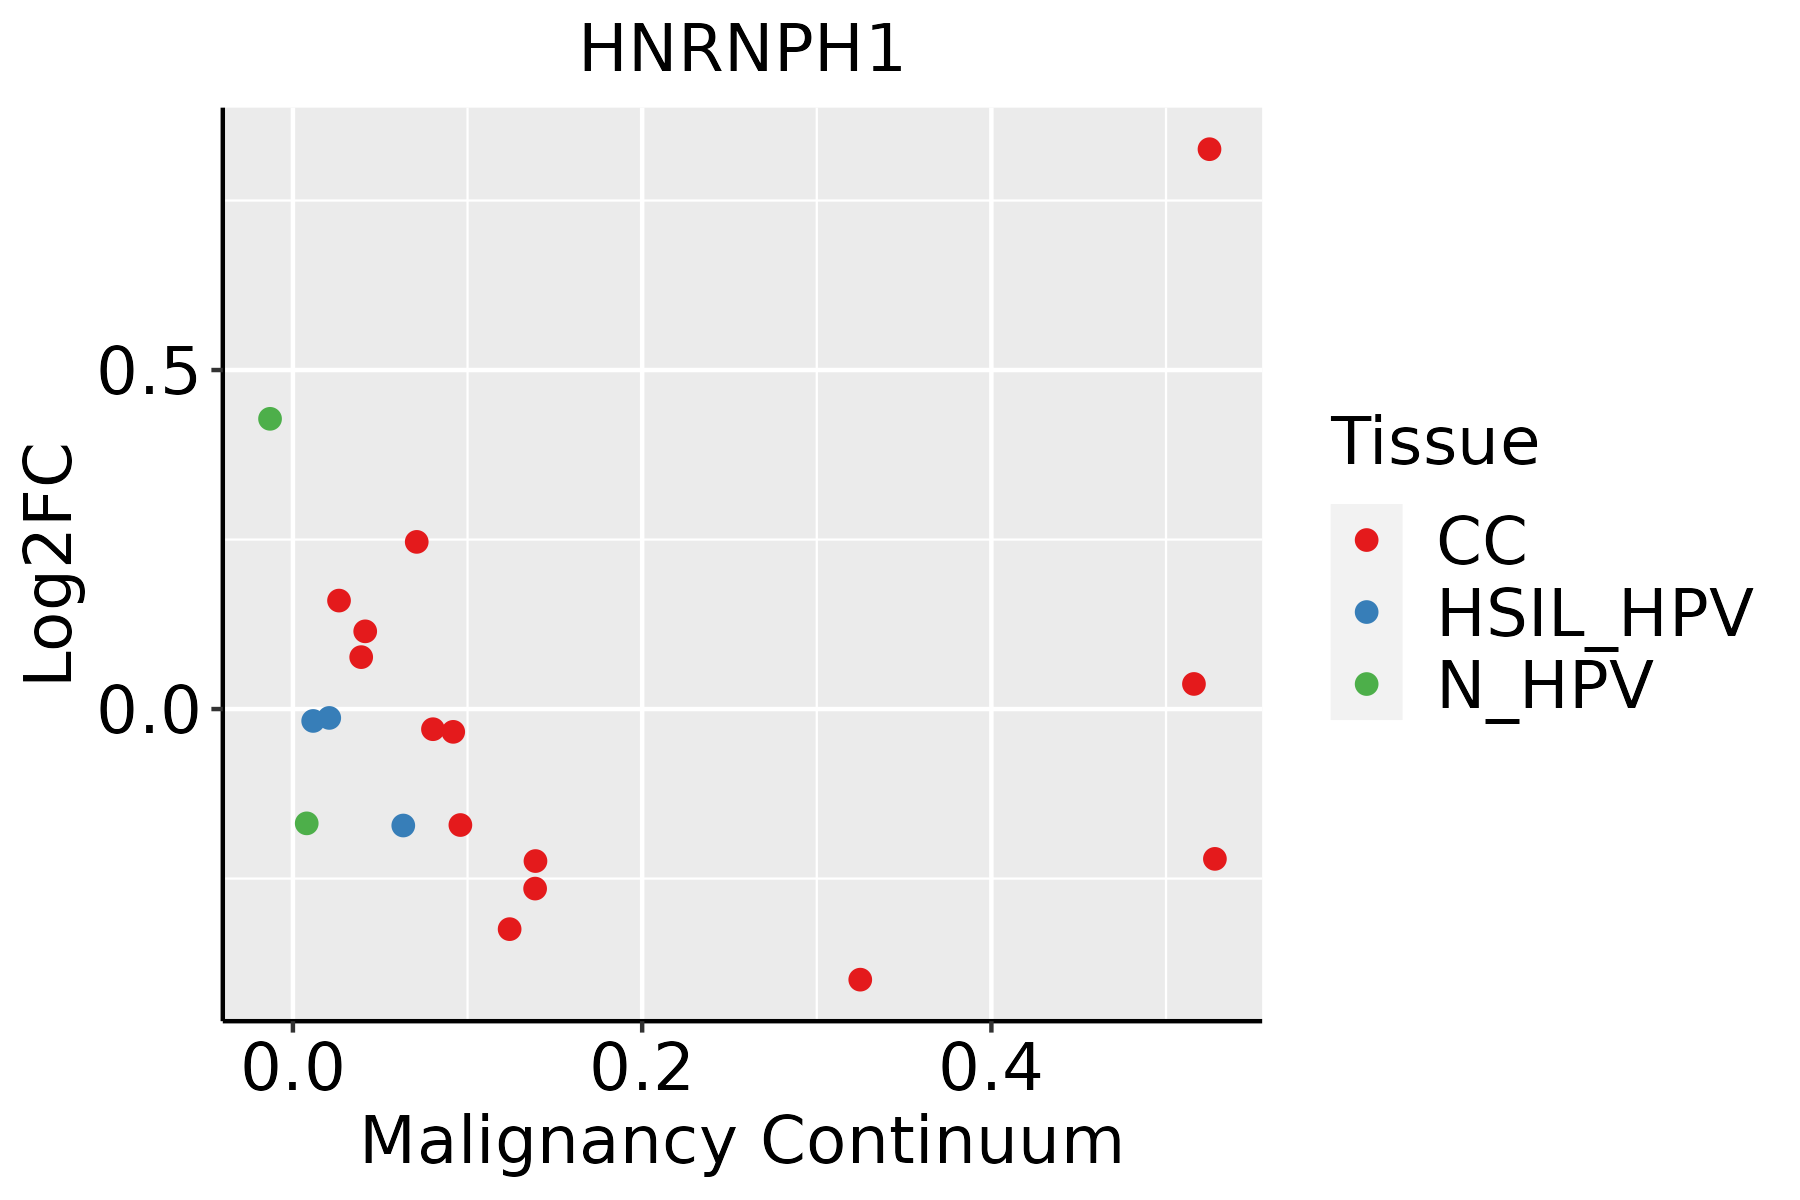 | CC: Cervix cancer |
| HSIL_HPV: HPV-infected high-grade squamous intraepithelial lesions | ||
| N_HPV: HPV-infected normal cervix | ||
| Colorectum (GSE201348) | 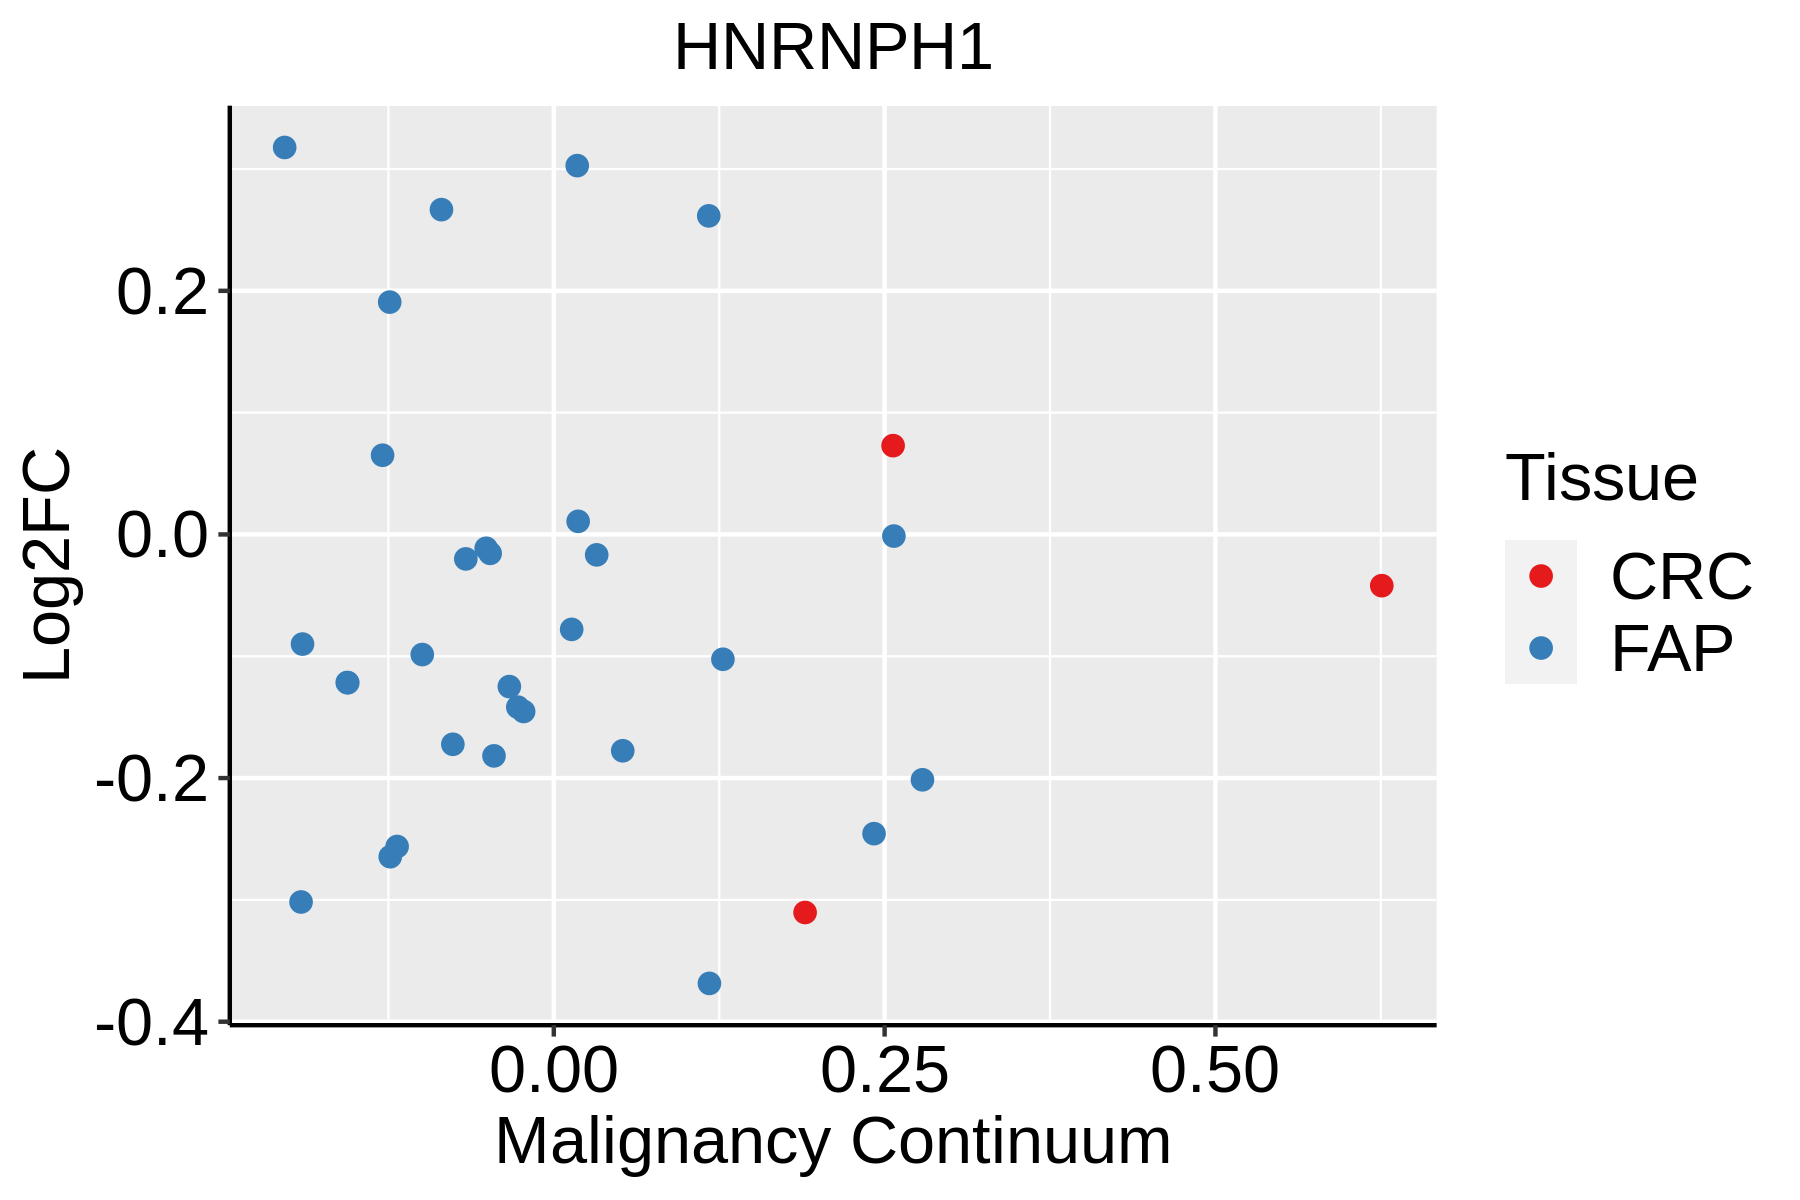 | FAP: Familial adenomatous polyposis |
| CRC: Colorectal cancer | ||
| Colorectum (HTA11) | 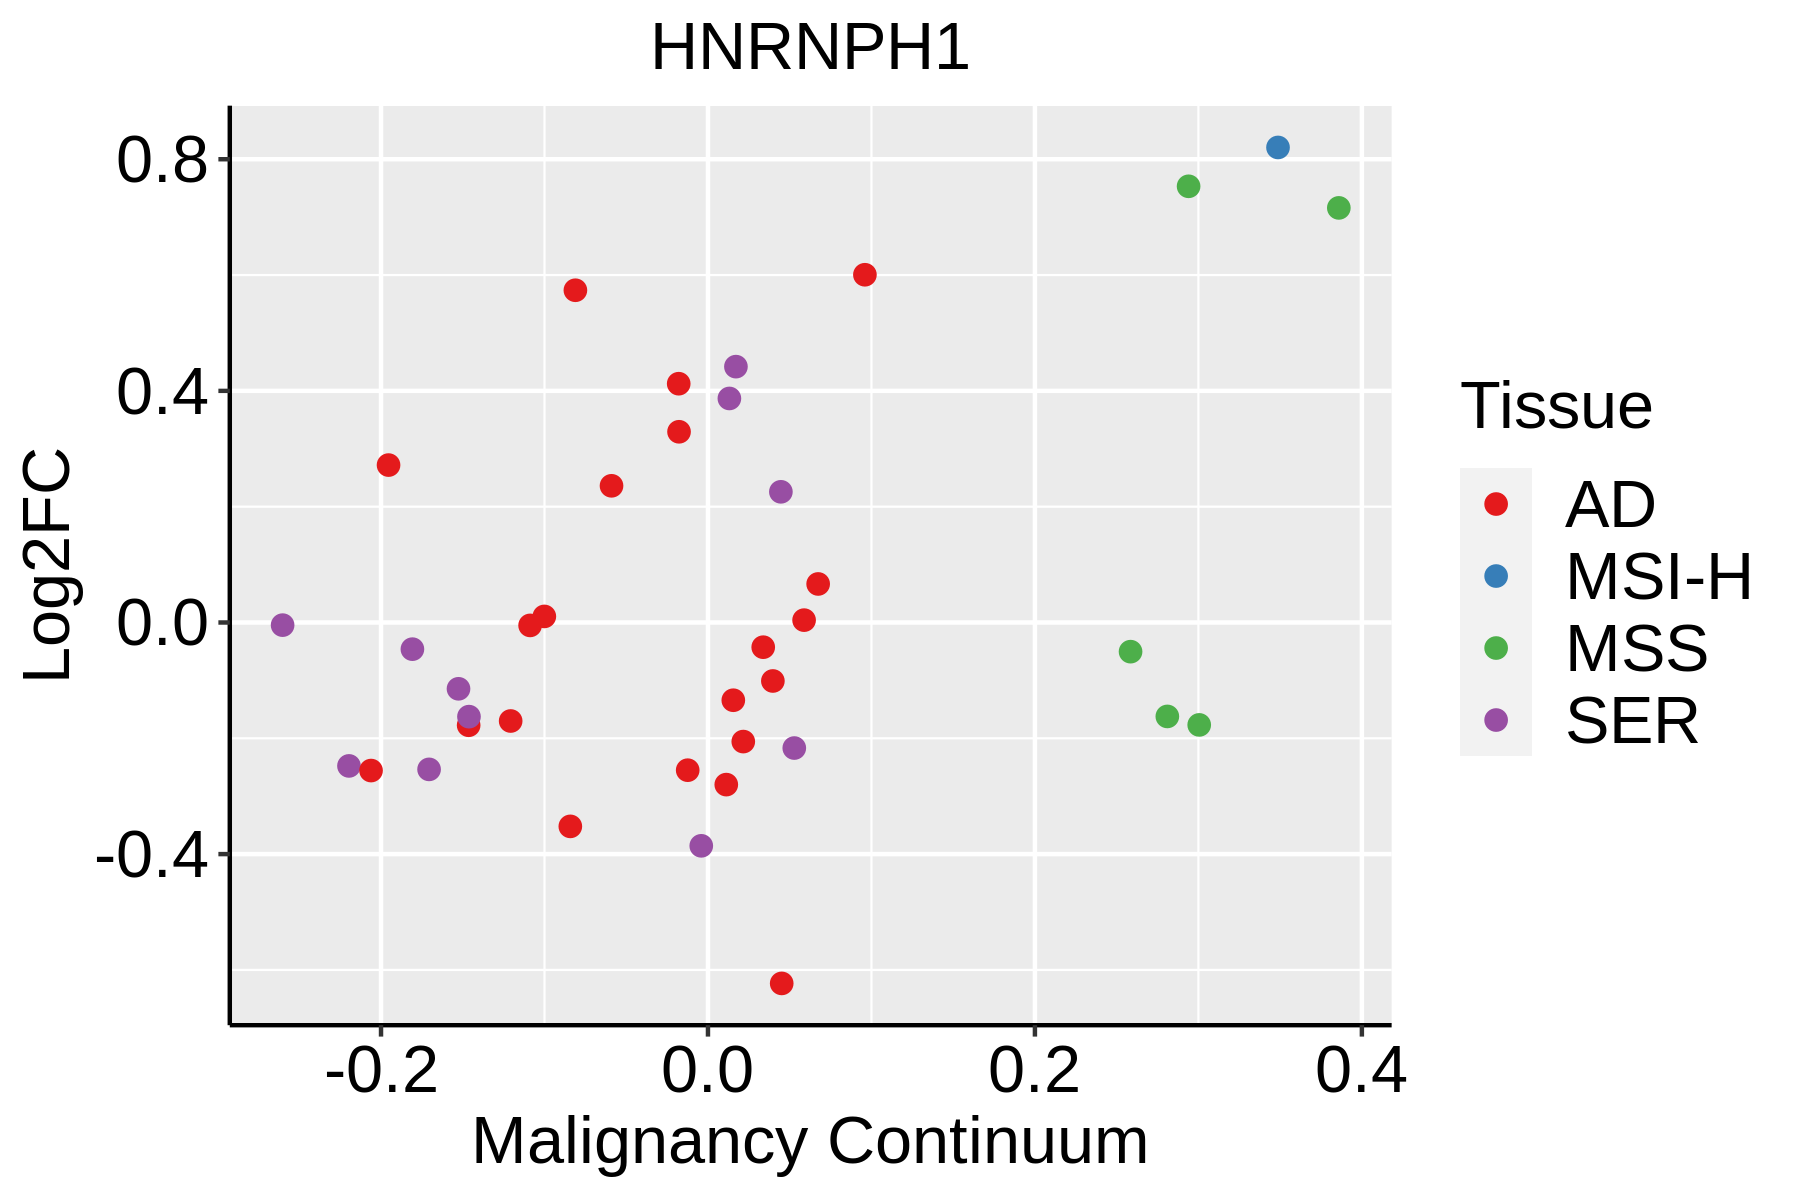 | AD: Adenomas |
| SER: Sessile serrated lesions | ||
| MSI-H: Microsatellite-high colorectal cancer | ||
| MSS: Microsatellite stable colorectal cancer | ||
| Endometrium |  | AEH: Atypical endometrial hyperplasia |
| EEC: Endometrioid Cancer | ||
| Esophagus |  | ESCC: Esophageal squamous cell carcinoma |
| HGIN: High-grade intraepithelial neoplasias | ||
| LGIN: Low-grade intraepithelial neoplasias | ||
| Liver |  | HCC: Hepatocellular carcinoma |
| NAFLD: Non-alcoholic fatty liver disease | ||
| Oral Cavity | 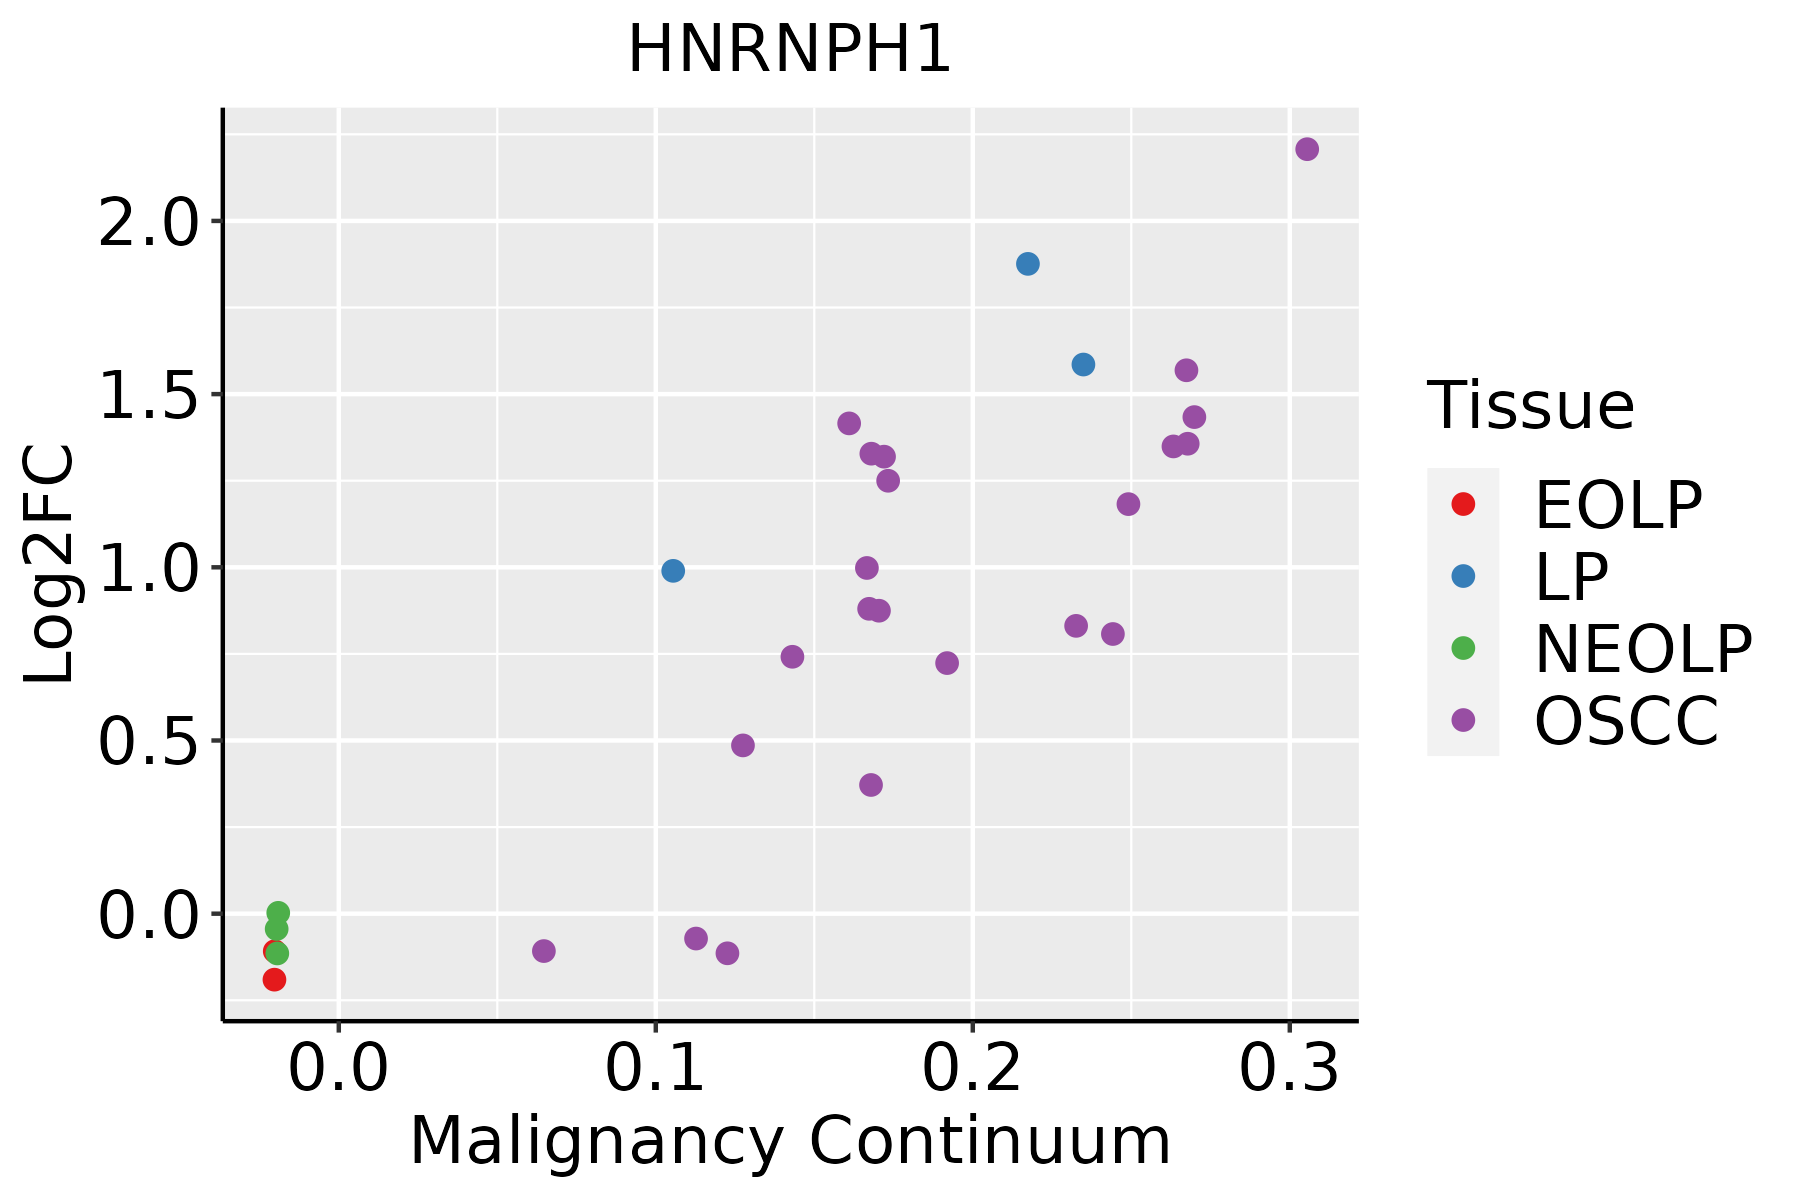 | EOLP: Erosive Oral lichen planus |
| LP: leukoplakia | ||
| NEOLP: Non-erosive oral lichen planus | ||
| OSCC: Oral squamous cell carcinoma | ||
| Prostate | 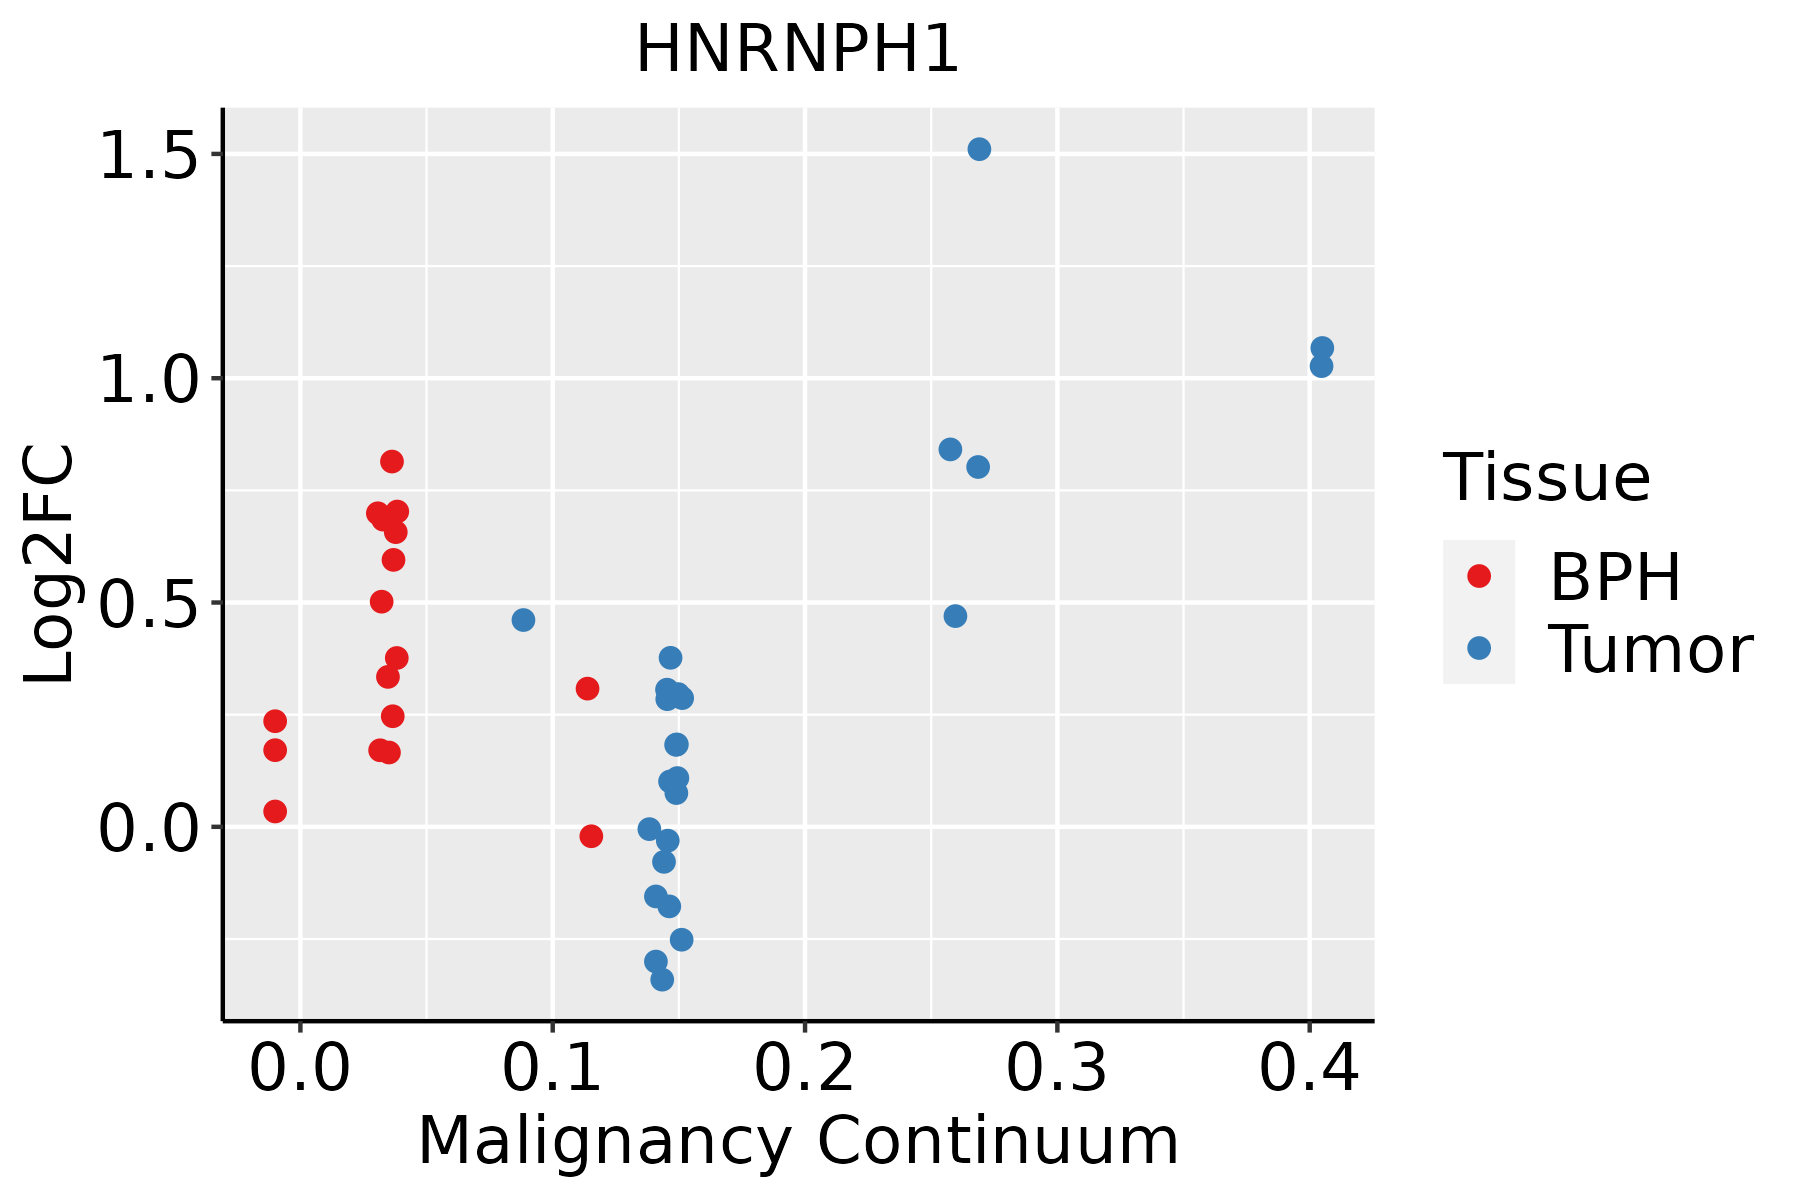 | BPH: Benign Prostatic Hyperplasia |
| Skin | 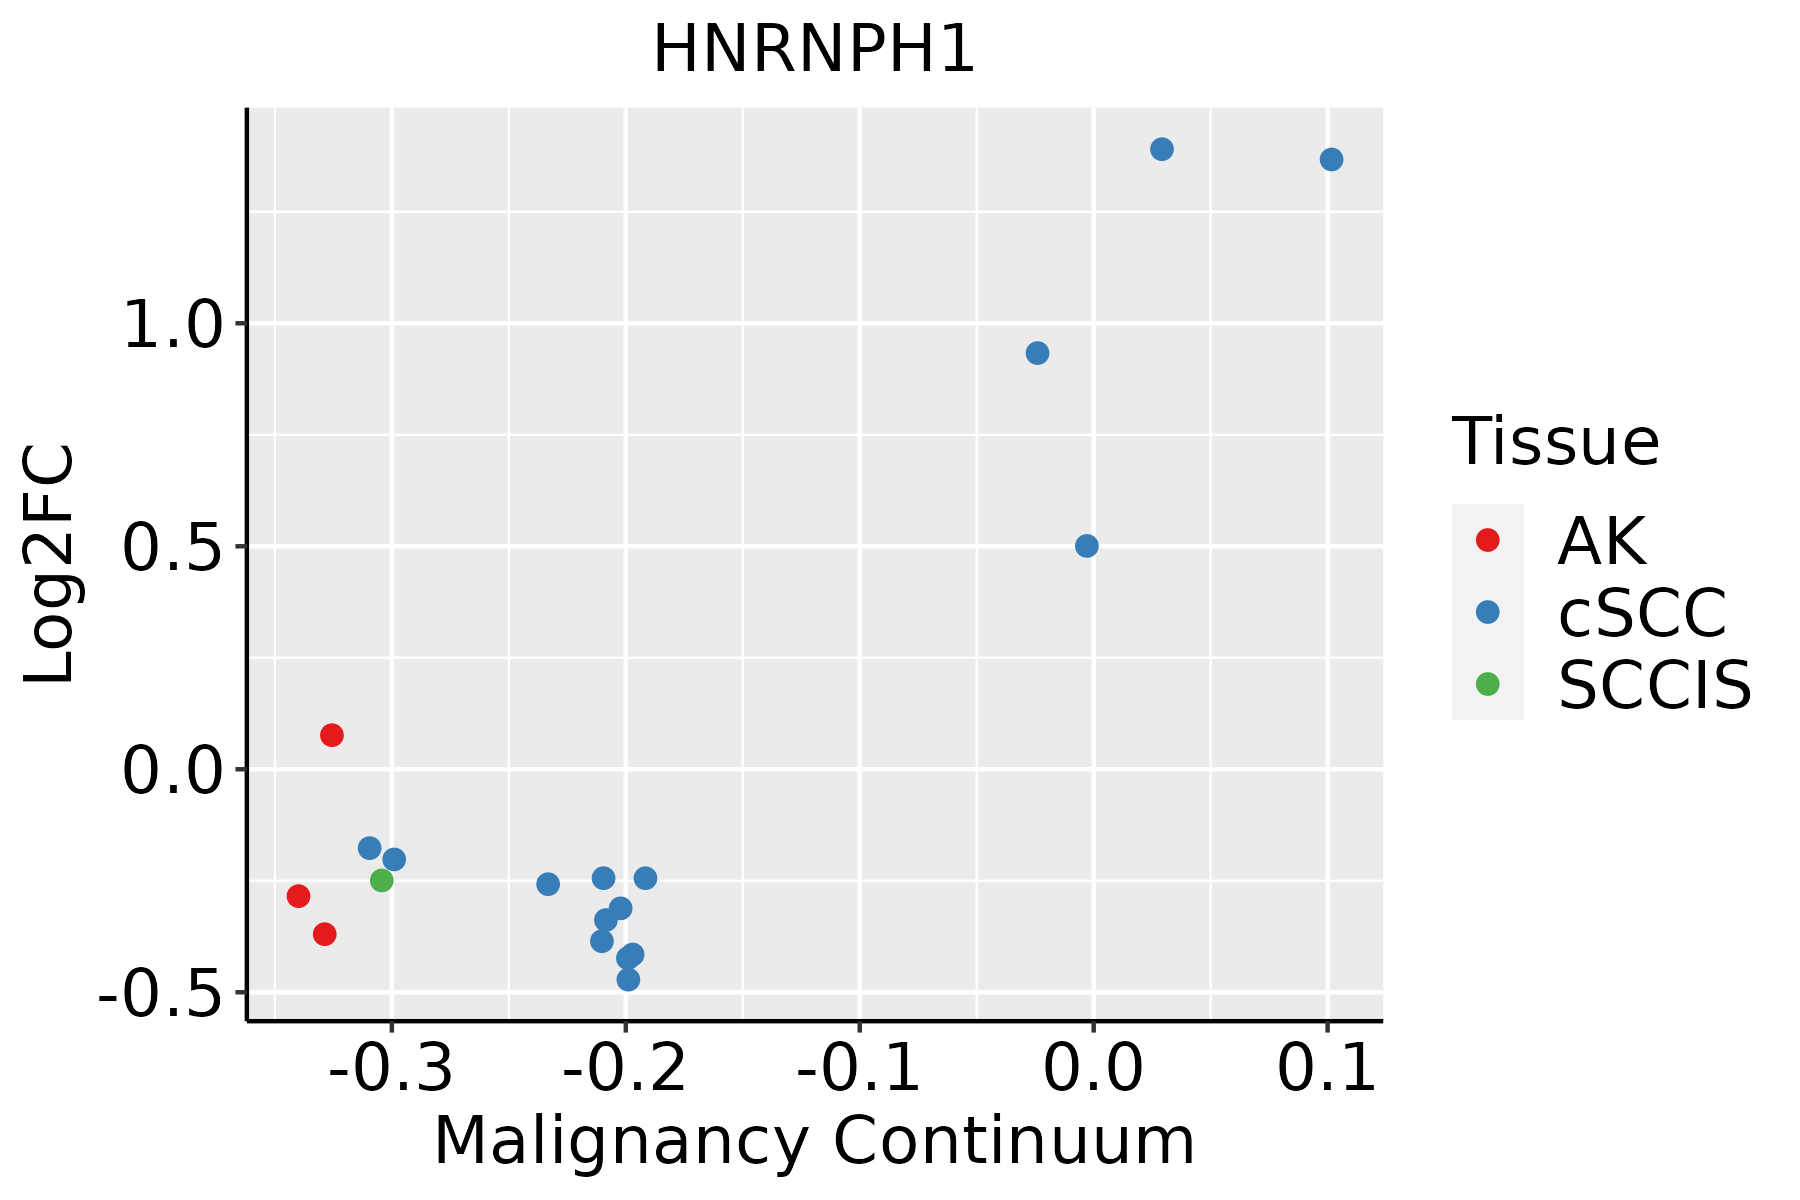 | AK: Actinic keratosis |
| cSCC: Cutaneous squamous cell carcinoma | ||
| SCCIS:squamous cell carcinoma in situ | ||
| Thyroid | 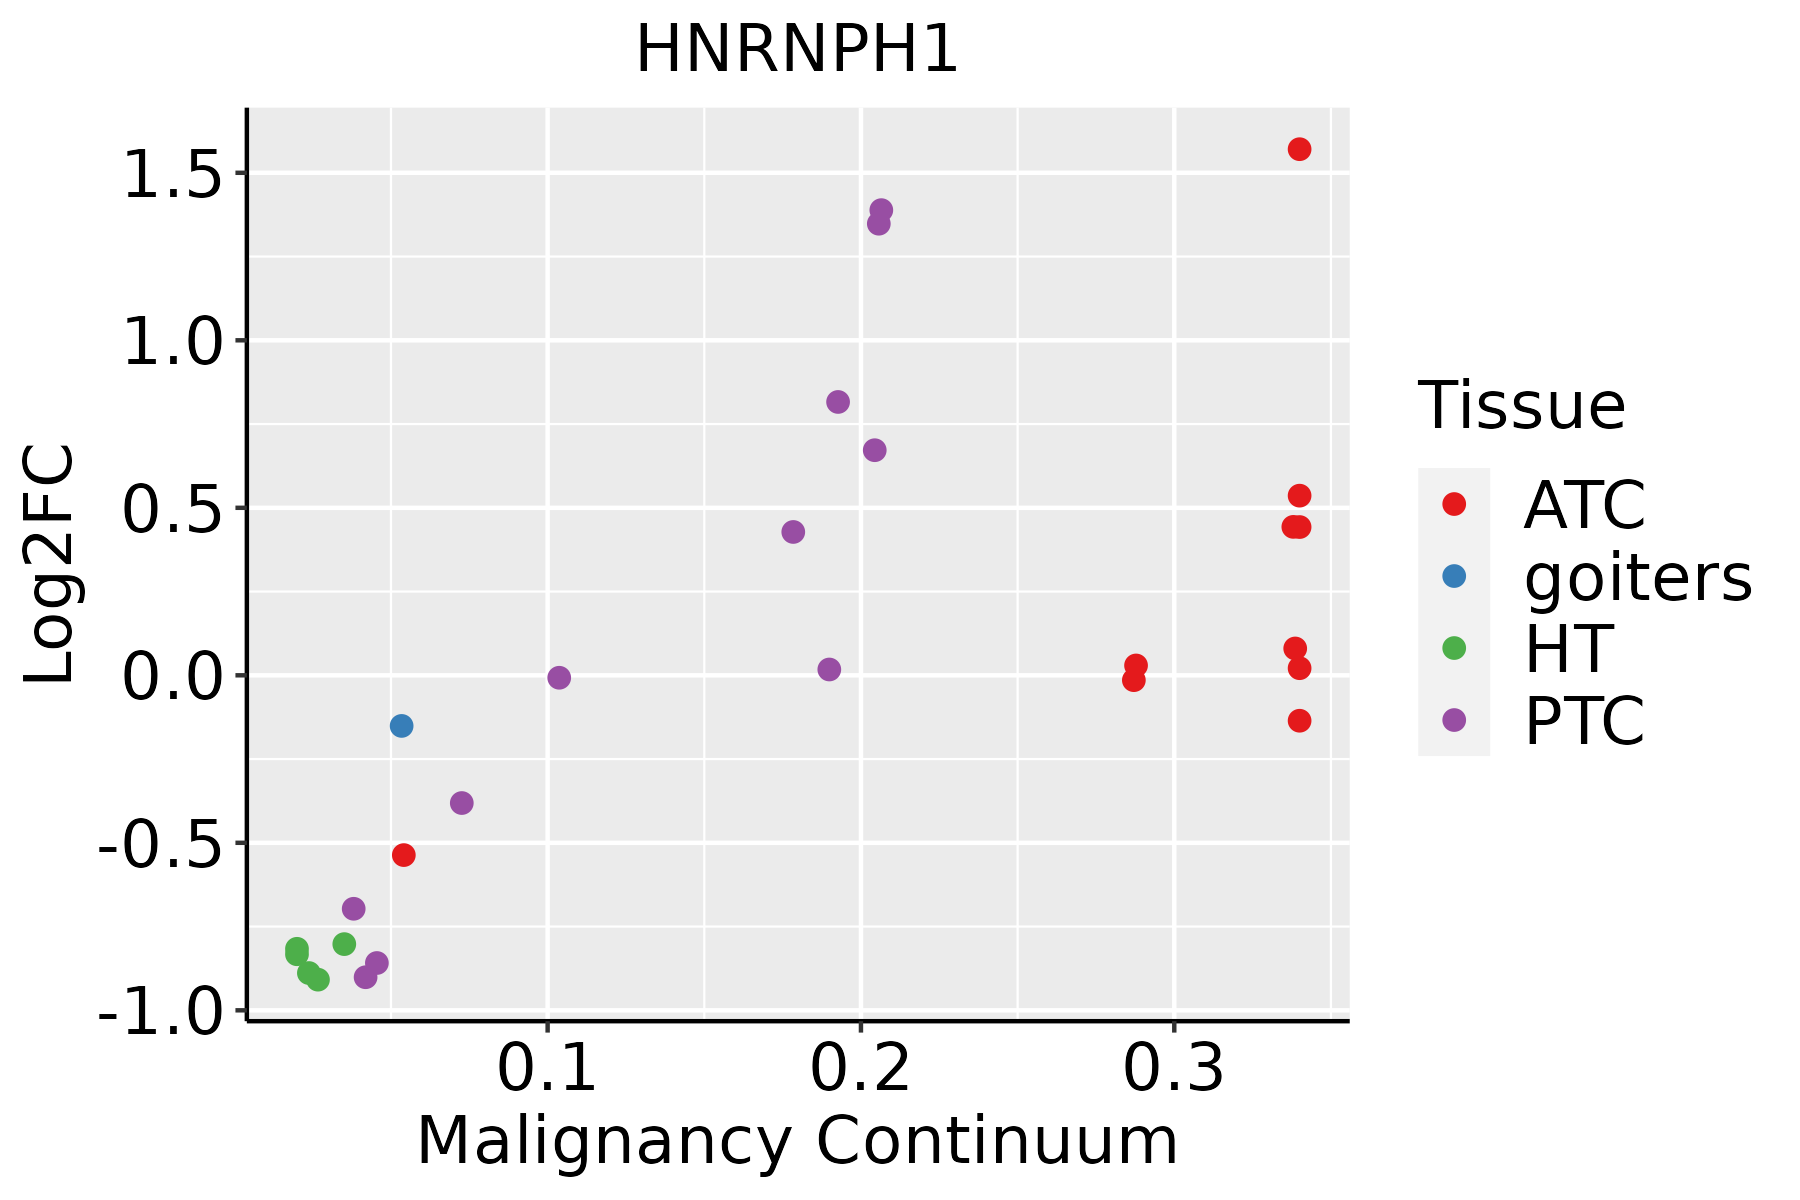 | ATC: Anaplastic thyroid cancer |
| HT: Hashimoto's thyroiditis | ||
| PTC: Papillary thyroid cancer |
| ∗log2FC in expression of this searched gene in stem-like cells from each diseased tissue sample relative to stem-like cells in normal samples in each tissue plotted against the malignancy continuum. Samples are colored based on if they are from different disease stage. |
Top |
Malignant transformation related pathway analysis |
| Find out the enriched GO biological processes and KEGG pathways involved in transition from healthy to precancer to cancer |
| Tissue | Disease Stage | Enriched GO biological Processes |
| Colorectum | AD |  |
| Colorectum | SER |  |
| Colorectum | MSS |  |
| Colorectum | MSI-H |  |
| Colorectum | FAP |  |
| ∗Top 15 enriched GO BP terms are showed in the bar plot of each disease state in each tissue. Each row represents a significant GO biological process which is colored according to the -log10(p.adjust). |
| Page: 1 2 3 4 5 6 7 8 9 |
| GO ID | Tissue | Disease Stage | Description | Gene Ratio | Bg Ratio | pvalue | p.adjust | Count |
| GO:00083809 | Breast | Precancer | RNA splicing | 65/1080 | 434/18723 | 1.27e-12 | 2.53e-10 | 65 |
| GO:00434849 | Breast | Precancer | regulation of RNA splicing | 34/1080 | 148/18723 | 2.66e-12 | 4.75e-10 | 34 |
| GO:00003759 | Breast | Precancer | RNA splicing, via transesterification reactions | 52/1080 | 324/18723 | 1.74e-11 | 2.22e-09 | 52 |
| GO:00003779 | Breast | Precancer | RNA splicing, via transesterification reactions with bulged adenosine as nucleophile | 51/1080 | 320/18723 | 3.55e-11 | 4.04e-09 | 51 |
| GO:00003989 | Breast | Precancer | mRNA splicing, via spliceosome | 51/1080 | 320/18723 | 3.55e-11 | 4.04e-09 | 51 |
| GO:000838014 | Breast | IDC | RNA splicing | 73/1434 | 434/18723 | 1.27e-10 | 1.57e-08 | 73 |
| GO:004348414 | Breast | IDC | regulation of RNA splicing | 36/1434 | 148/18723 | 3.32e-10 | 3.77e-08 | 36 |
| GO:000037514 | Breast | IDC | RNA splicing, via transesterification reactions | 58/1434 | 324/18723 | 9.44e-10 | 9.58e-08 | 58 |
| GO:000037714 | Breast | IDC | RNA splicing, via transesterification reactions with bulged adenosine as nucleophile | 57/1434 | 320/18723 | 1.60e-09 | 1.49e-07 | 57 |
| GO:000039814 | Breast | IDC | mRNA splicing, via spliceosome | 57/1434 | 320/18723 | 1.60e-09 | 1.49e-07 | 57 |
| GO:000838024 | Breast | DCIS | RNA splicing | 73/1390 | 434/18723 | 3.05e-11 | 5.08e-09 | 73 |
| GO:004348424 | Breast | DCIS | regulation of RNA splicing | 36/1390 | 148/18723 | 1.40e-10 | 1.69e-08 | 36 |
| GO:000037524 | Breast | DCIS | RNA splicing, via transesterification reactions | 58/1390 | 324/18723 | 2.89e-10 | 3.34e-08 | 58 |
| GO:000037724 | Breast | DCIS | RNA splicing, via transesterification reactions with bulged adenosine as nucleophile | 57/1390 | 320/18723 | 5.01e-10 | 5.35e-08 | 57 |
| GO:000039824 | Breast | DCIS | mRNA splicing, via spliceosome | 57/1390 | 320/18723 | 5.01e-10 | 5.35e-08 | 57 |
| GO:004348410 | Cervix | CC | regulation of RNA splicing | 42/2311 | 148/18723 | 1.25e-07 | 6.24e-06 | 42 |
| GO:000838010 | Cervix | CC | RNA splicing | 76/2311 | 434/18723 | 9.79e-04 | 8.19e-03 | 76 |
| GO:000037710 | Cervix | CC | RNA splicing, via transesterification reactions with bulged adenosine as nucleophile | 55/2311 | 320/18723 | 6.71e-03 | 3.70e-02 | 55 |
| GO:000039810 | Cervix | CC | mRNA splicing, via spliceosome | 55/2311 | 320/18723 | 6.71e-03 | 3.70e-02 | 55 |
| GO:000037510 | Cervix | CC | RNA splicing, via transesterification reactions | 55/2311 | 324/18723 | 8.61e-03 | 4.44e-02 | 55 |
| Page: 1 2 3 4 5 6 7 8 |
| Pathway ID | Tissue | Disease Stage | Description | Gene Ratio | Bg Ratio | pvalue | p.adjust | qvalue | Count |
| Page: 1 |
Top |
Cell-cell communication analysis |
| Identification of potential cell-cell interactions between two cell types and their ligand-receptor pairs for different disease states |
| Ligand | Receptor | LRpair | Pathway | Tissue | Disease Stage |
| Page: 1 |
Top |
Single-cell gene regulatory network inference analysis |
| Find out the significant the regulons (TFs) and the target genes of each regulon across cell types for different disease states |
| TF | Cell Type | Tissue | Disease Stage | Target Gene | RSS | Regulon Activity |
| ∗The dot plots of a searched regulon are shown for all cell subpopulations in each disease state of each tissue based on the regulon specific score inferred using pySCENIC and by calculating the average expression. |
| Page: 1 |
Top |
Somatic mutation of malignant transformation related genes |
| Annotation of somatic variants for genes involved in malignant transformation |
| Hugo Symbol | Variant Class | Variant Classification | dbSNP RS | HGVSc | HGVSp | HGVSp Short | SWISSPROT | BIOTYPE | SIFT | PolyPhen | Tumor Sample Barcode | Tissue | Histology | Sex | Age | Stage | Therapy Types | Drugs | Outcome |
| HNRNPH1 | SNV | Missense_Mutation | c.1196N>A | p.Gly399Asp | p.G399D | P31943 | protein_coding | tolerated(0.06) | benign(0.188) | TCGA-C8-A135-01 | Breast | breast invasive carcinoma | Female | <65 | I/II | Chemotherapy | 5-fluorouracil | CR | |
| HNRNPH1 | SNV | Missense_Mutation | novel | c.1114N>A | p.Tyr372Asn | p.Y372N | P31943 | protein_coding | tolerated(0.11) | benign(0) | TCGA-E2-A15O-01 | Breast | breast invasive carcinoma | Female | >=65 | I/II | Hormone Therapy | arimidex | PD |
| HNRNPH1 | insertion | Nonsense_Mutation | novel | c.1179_1180insCTCTGGCTTGGCAGTTGAGGCTGTTGCG | p.Ser394LeufsTer6 | p.S394Lfs*6 | P31943 | protein_coding | TCGA-BH-A0EE-01 | Breast | breast invasive carcinoma | Female | >=65 | I/II | Chemotherapy | docetaxel | SD | ||
| HNRNPH1 | SNV | Missense_Mutation | c.617G>A | p.Arg206Gln | p.R206Q | P31943 | protein_coding | tolerated(0.09) | benign(0.014) | TCGA-2W-A8YY-01 | Cervix | cervical & endocervical cancer | Female | <65 | I/II | Chemotherapy | cisplatin | CR | |
| HNRNPH1 | SNV | Missense_Mutation | novel | c.1327N>A | p.Asp443Asn | p.D443N | P31943 | protein_coding | tolerated_low_confidence(0.59) | benign(0) | TCGA-C5-A8XJ-01 | Cervix | cervical & endocervical cancer | Female | >=65 | I/II | Chemotherapy | cisplatin | SD |
| HNRNPH1 | SNV | Missense_Mutation | c.16G>A | p.Glu6Lys | p.E6K | P31943 | protein_coding | tolerated(0.06) | benign(0.024) | TCGA-DS-A0VM-01 | Cervix | cervical & endocervical cancer | Female | <65 | I/II | Chemotherapy | cisplatin | PD | |
| HNRNPH1 | SNV | Missense_Mutation | novel | c.1103G>T | p.Ser368Ile | p.S368I | P31943 | protein_coding | deleterious(0.04) | benign(0.208) | TCGA-A6-A565-01 | Colorectum | colon adenocarcinoma | Female | <65 | III/IV | Unspecific | 5FU | PD |
| HNRNPH1 | SNV | Missense_Mutation | c.616C>T | p.Arg206Trp | p.R206W | P31943 | protein_coding | tolerated(0.05) | benign(0.02) | TCGA-AA-3815-01 | Colorectum | colon adenocarcinoma | Female | >=65 | I/II | Unknown | Unknown | SD | |
| HNRNPH1 | SNV | Missense_Mutation | novel | c.211N>A | p.Leu71Met | p.L71M | P31943 | protein_coding | deleterious(0.01) | probably_damaging(0.961) | TCGA-AA-3947-01 | Colorectum | colon adenocarcinoma | Female | <65 | I/II | Unknown | Unknown | SD |
| HNRNPH1 | SNV | Missense_Mutation | c.1188N>T | p.Met396Ile | p.M396I | P31943 | protein_coding | tolerated(0.69) | benign(0.104) | TCGA-CA-6717-01 | Colorectum | colon adenocarcinoma | Male | <65 | I/II | Chemotherapy | oxaliplatin | CR |
| Page: 1 2 3 4 5 |
Top |
Related drugs of malignant transformation related genes |
| Identification of chemicals and drugs interact with genes involved in malignant transfromation |
| (DGIdb 4.0) |
| Entrez ID | Symbol | Category | Interaction Types | Drug Claim Name | Drug Name | PMIDs |
| Page: 1 |

Copyright 2023-Present -The University of Texas Health Science Center at Houston |