
|
|||||
|
 | |
| |
| |
| |
| |
| |
|
Gene: HNRNPDL |
Gene summary for HNRNPDL |
| Gene information | Species | Human | Gene symbol | HNRNPDL | Gene ID | 9987 |
| Gene name | heterogeneous nuclear ribonucleoprotein D like | |
| Gene Alias | HNRNP | |
| Cytomap | 4q21.22 | |
| Gene Type | protein-coding | GO ID | GO:0008150 | UniProtAcc | A0A087WUK2 |
Top |
Malignant transformation analysis |
| Identification of the aberrant gene expression in precancerous and cancerous lesions by comparing the gene expression of stem-like cells in diseased tissues with normal stem cells |
| Entrez ID | Symbol | Replicates | Species | Organ | Tissue | Adj P-value | Log2FC | Malignancy |
| 9987 | HNRNPDL | GSM4909281 | Human | Breast | IDC | 7.35e-05 | -3.39e-01 | 0.21 |
| 9987 | HNRNPDL | GSM4909286 | Human | Breast | IDC | 4.65e-13 | -2.72e-01 | 0.1081 |
| 9987 | HNRNPDL | GSM4909288 | Human | Breast | IDC | 3.76e-02 | -3.65e-01 | 0.0988 |
| 9987 | HNRNPDL | GSM4909290 | Human | Breast | IDC | 5.67e-04 | -2.86e-01 | 0.2096 |
| 9987 | HNRNPDL | GSM4909292 | Human | Breast | IDC | 6.73e-03 | -6.55e-01 | 0.1236 |
| 9987 | HNRNPDL | GSM4909293 | Human | Breast | IDC | 1.04e-11 | -3.47e-01 | 0.1581 |
| 9987 | HNRNPDL | GSM4909294 | Human | Breast | IDC | 9.55e-14 | -4.71e-01 | 0.2022 |
| 9987 | HNRNPDL | GSM4909296 | Human | Breast | IDC | 2.35e-23 | -6.10e-01 | 0.1524 |
| 9987 | HNRNPDL | GSM4909297 | Human | Breast | IDC | 1.01e-29 | -4.06e-01 | 0.1517 |
| 9987 | HNRNPDL | GSM4909298 | Human | Breast | IDC | 9.51e-03 | -1.27e-01 | 0.1551 |
| 9987 | HNRNPDL | GSM4909301 | Human | Breast | IDC | 2.29e-08 | -4.60e-01 | 0.1577 |
| 9987 | HNRNPDL | GSM4909302 | Human | Breast | IDC | 6.89e-09 | -3.62e-01 | 0.1545 |
| 9987 | HNRNPDL | GSM4909304 | Human | Breast | IDC | 9.08e-15 | -4.61e-01 | 0.1636 |
| 9987 | HNRNPDL | GSM4909309 | Human | Breast | IDC | 1.75e-06 | -2.89e-01 | 0.0483 |
| 9987 | HNRNPDL | GSM4909311 | Human | Breast | IDC | 4.13e-54 | -7.18e-01 | 0.1534 |
| 9987 | HNRNPDL | GSM4909312 | Human | Breast | IDC | 3.95e-13 | -2.35e-01 | 0.1552 |
| 9987 | HNRNPDL | GSM4909313 | Human | Breast | IDC | 1.46e-09 | -3.62e-01 | 0.0391 |
| 9987 | HNRNPDL | GSM4909315 | Human | Breast | IDC | 3.54e-21 | -6.50e-01 | 0.21 |
| 9987 | HNRNPDL | GSM4909316 | Human | Breast | IDC | 3.40e-12 | -6.90e-01 | 0.21 |
| 9987 | HNRNPDL | GSM4909319 | Human | Breast | IDC | 2.01e-72 | -8.68e-01 | 0.1563 |
| Page: 1 2 3 4 5 6 7 8 9 10 11 12 13 14 |
| Tissue | Expression Dynamics | Abbreviation |
| Breast | 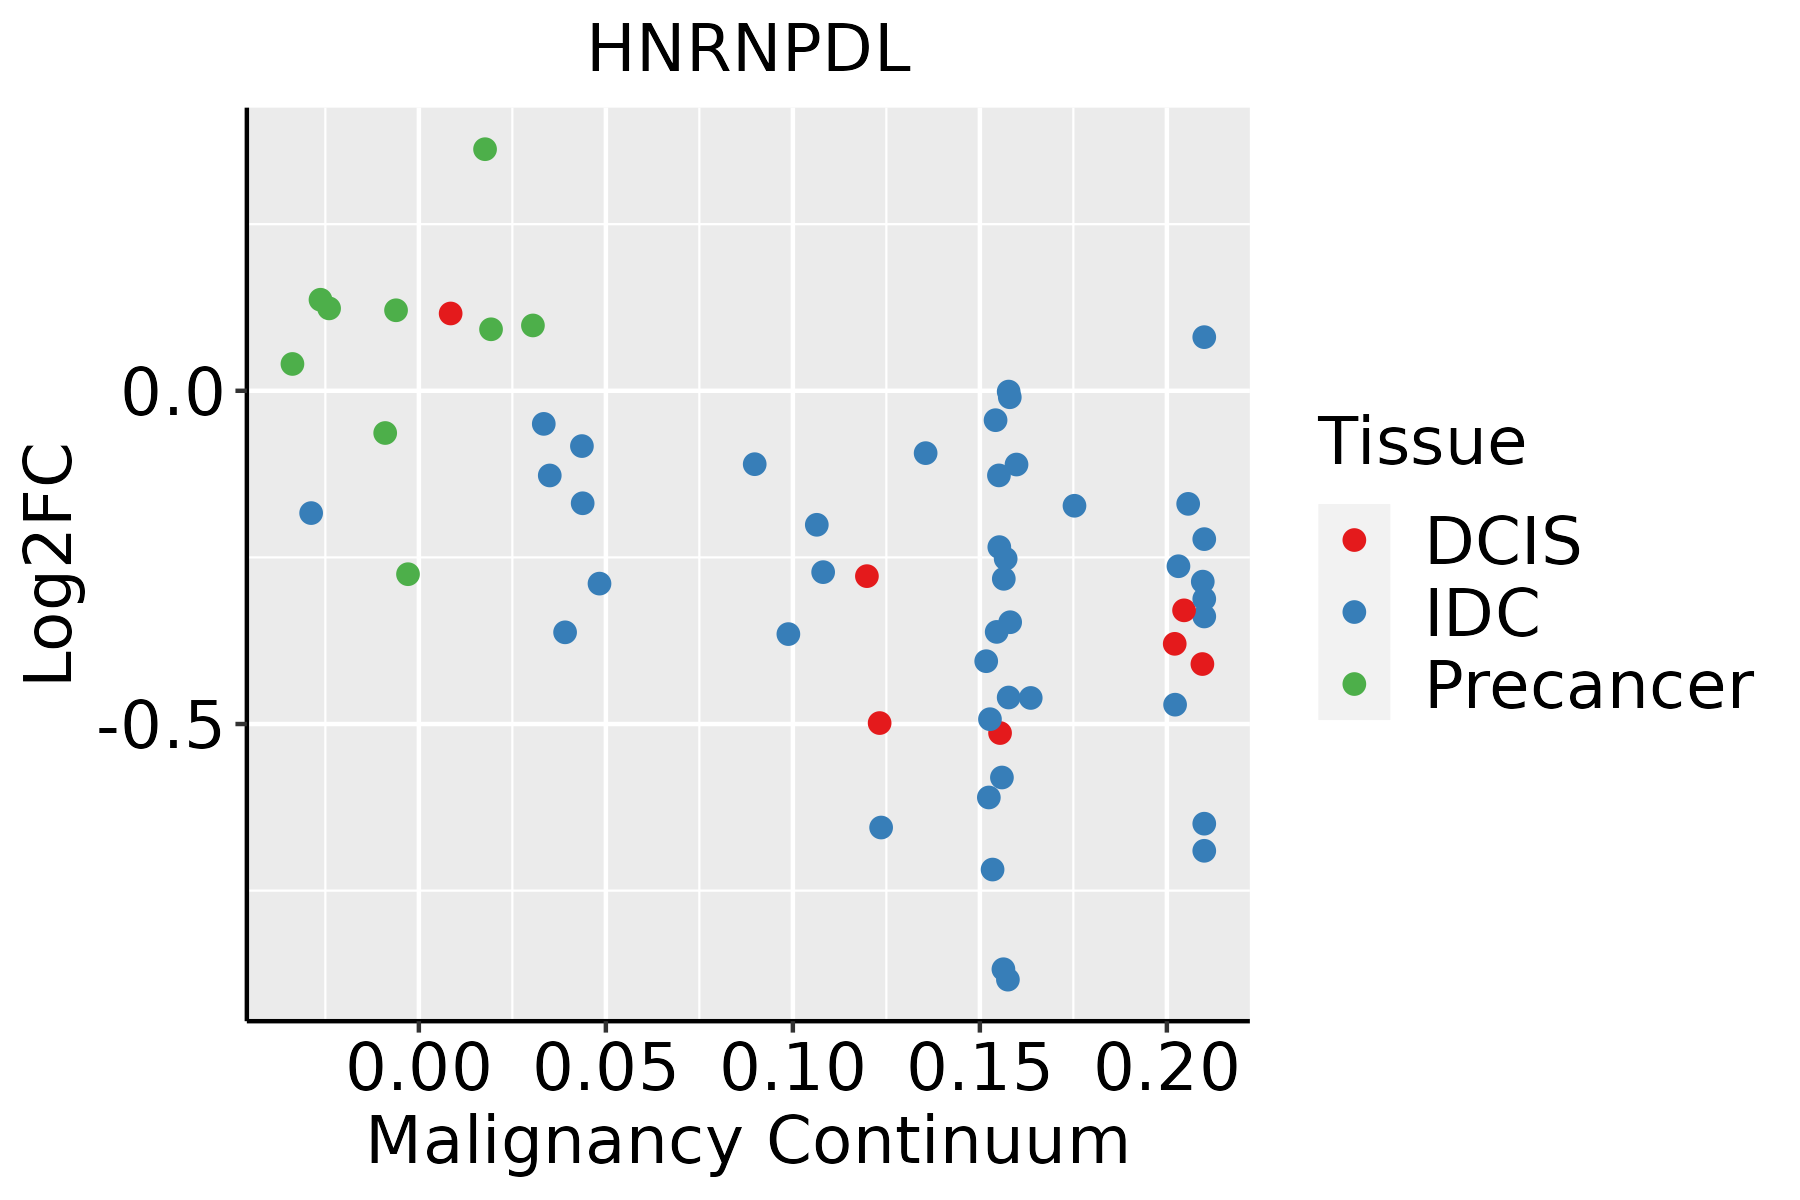 | IDC: Invasive ductal carcinoma |
| DCIS: Ductal carcinoma in situ | ||
| Precancer(BRCA1-mut): Precancerous lesion from BRCA1 mutation carriers | ||
| Colorectum (GSE201348) |  | FAP: Familial adenomatous polyposis |
| CRC: Colorectal cancer | ||
| Colorectum (HTA11) |  | AD: Adenomas |
| SER: Sessile serrated lesions | ||
| MSI-H: Microsatellite-high colorectal cancer | ||
| MSS: Microsatellite stable colorectal cancer | ||
| Endometrium |  | AEH: Atypical endometrial hyperplasia |
| EEC: Endometrioid Cancer | ||
| Esophagus |  | ESCC: Esophageal squamous cell carcinoma |
| HGIN: High-grade intraepithelial neoplasias | ||
| LGIN: Low-grade intraepithelial neoplasias | ||
| Liver | 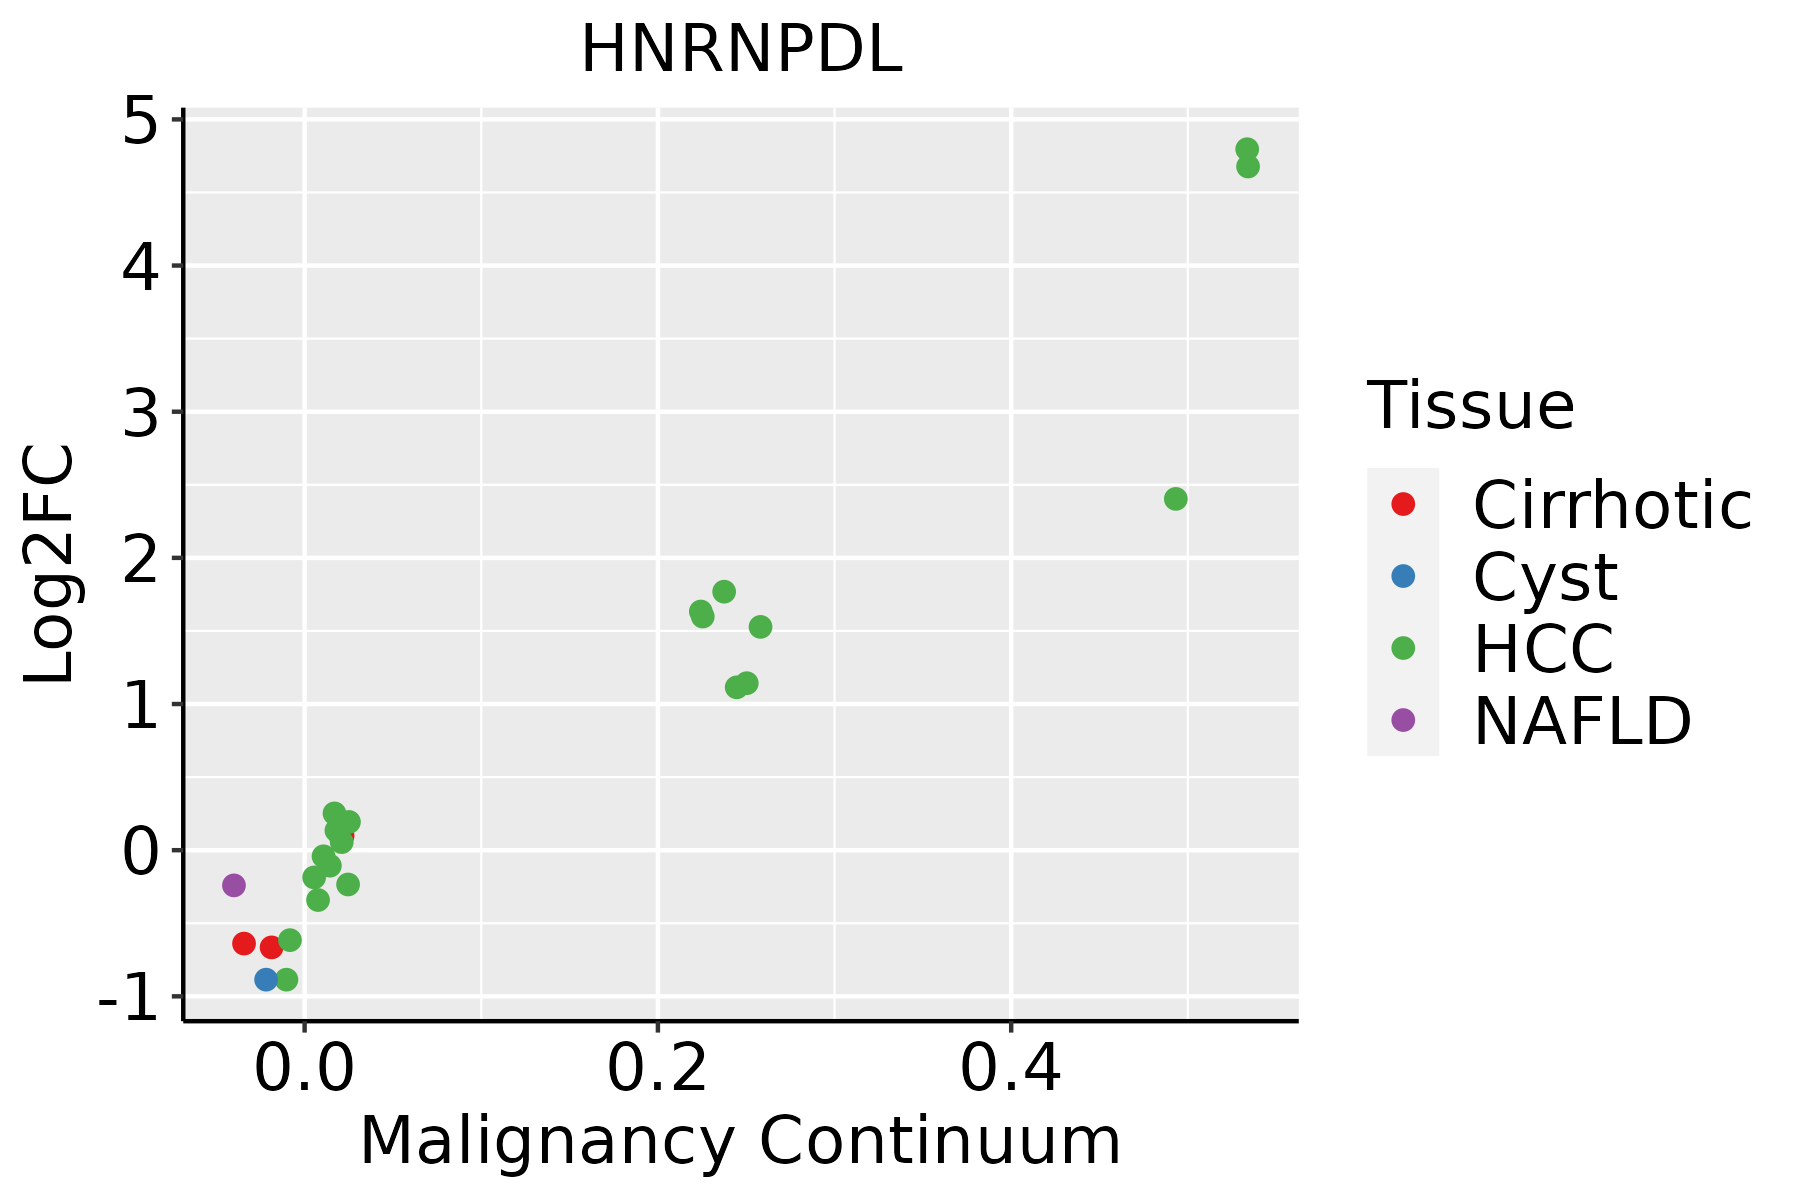 | HCC: Hepatocellular carcinoma |
| NAFLD: Non-alcoholic fatty liver disease | ||
| Lung | 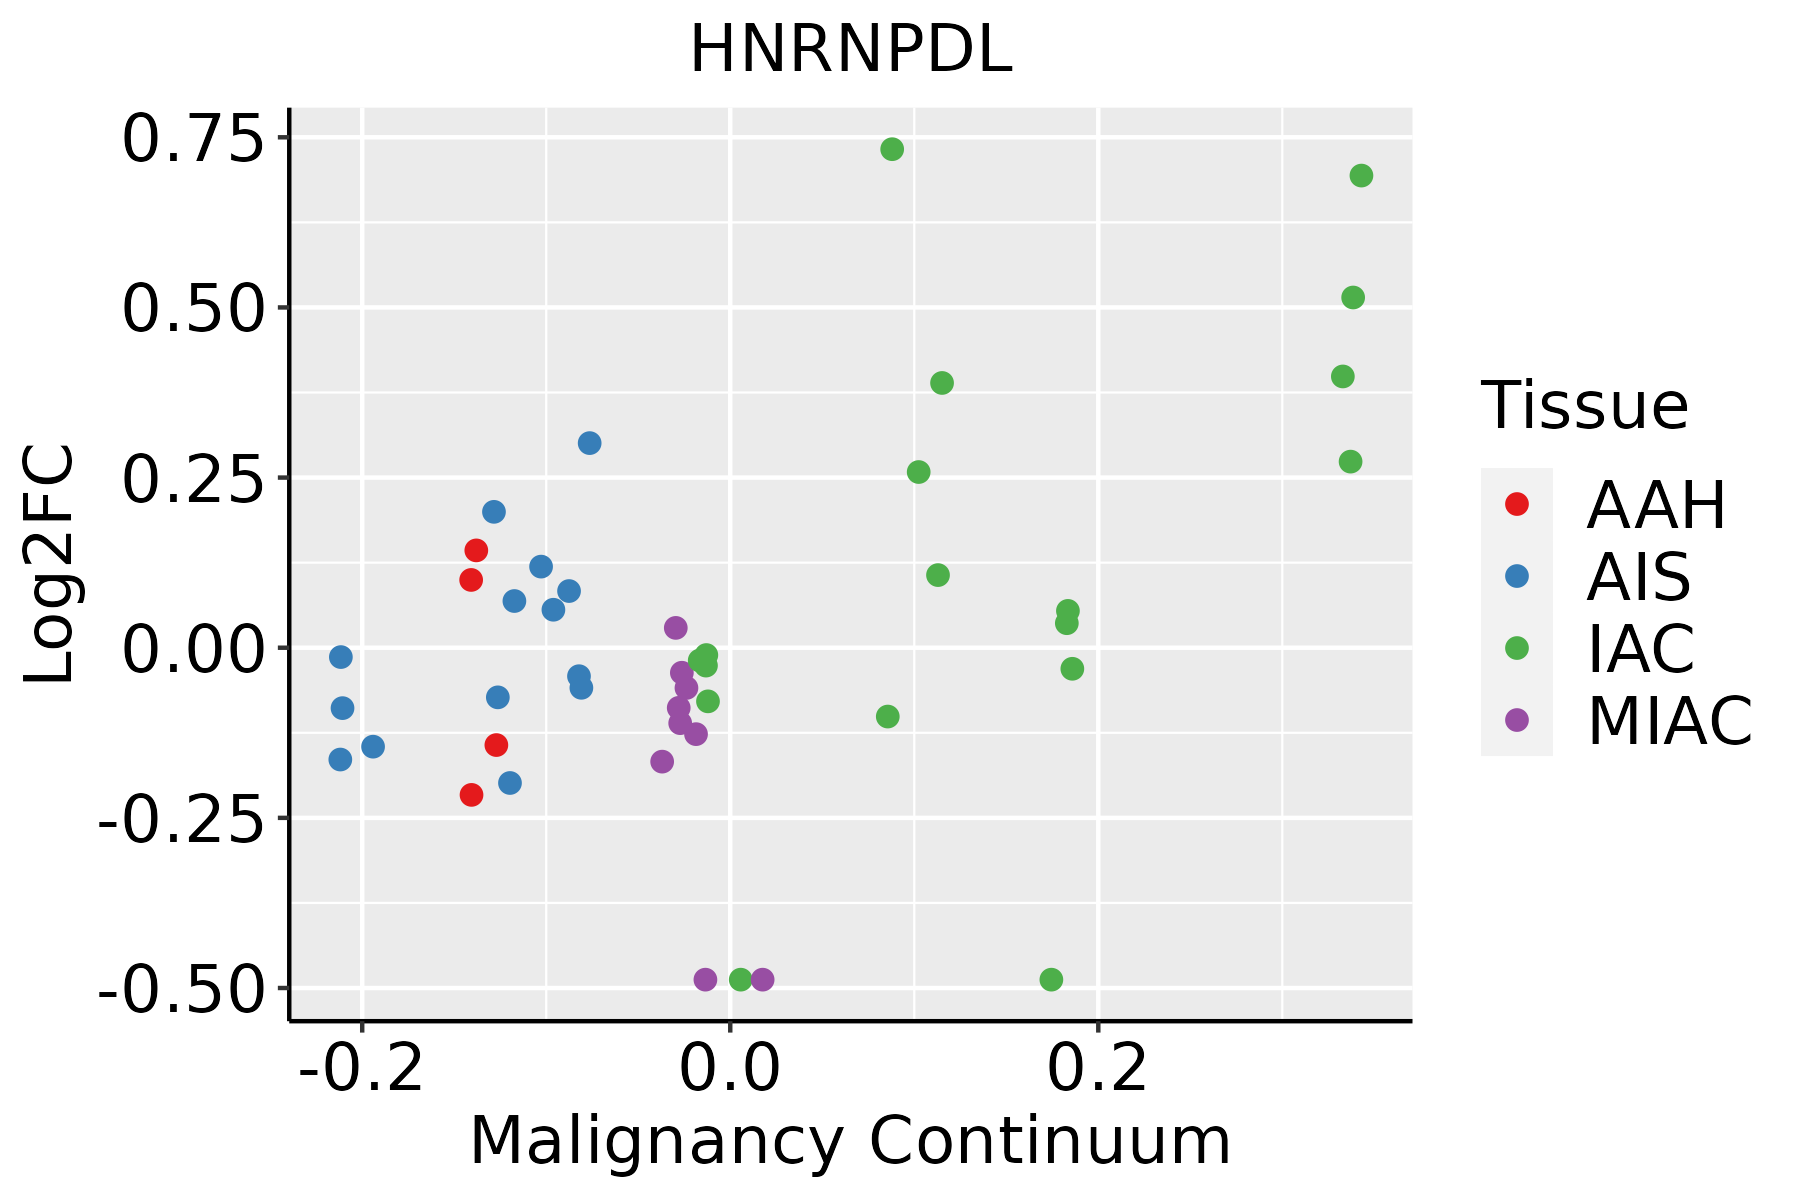 | AAH: Atypical adenomatous hyperplasia |
| AIS: Adenocarcinoma in situ | ||
| IAC: Invasive lung adenocarcinoma | ||
| MIA: Minimally invasive adenocarcinoma | ||
| Oral Cavity |  | EOLP: Erosive Oral lichen planus |
| LP: leukoplakia | ||
| NEOLP: Non-erosive oral lichen planus | ||
| OSCC: Oral squamous cell carcinoma | ||
| Prostate | 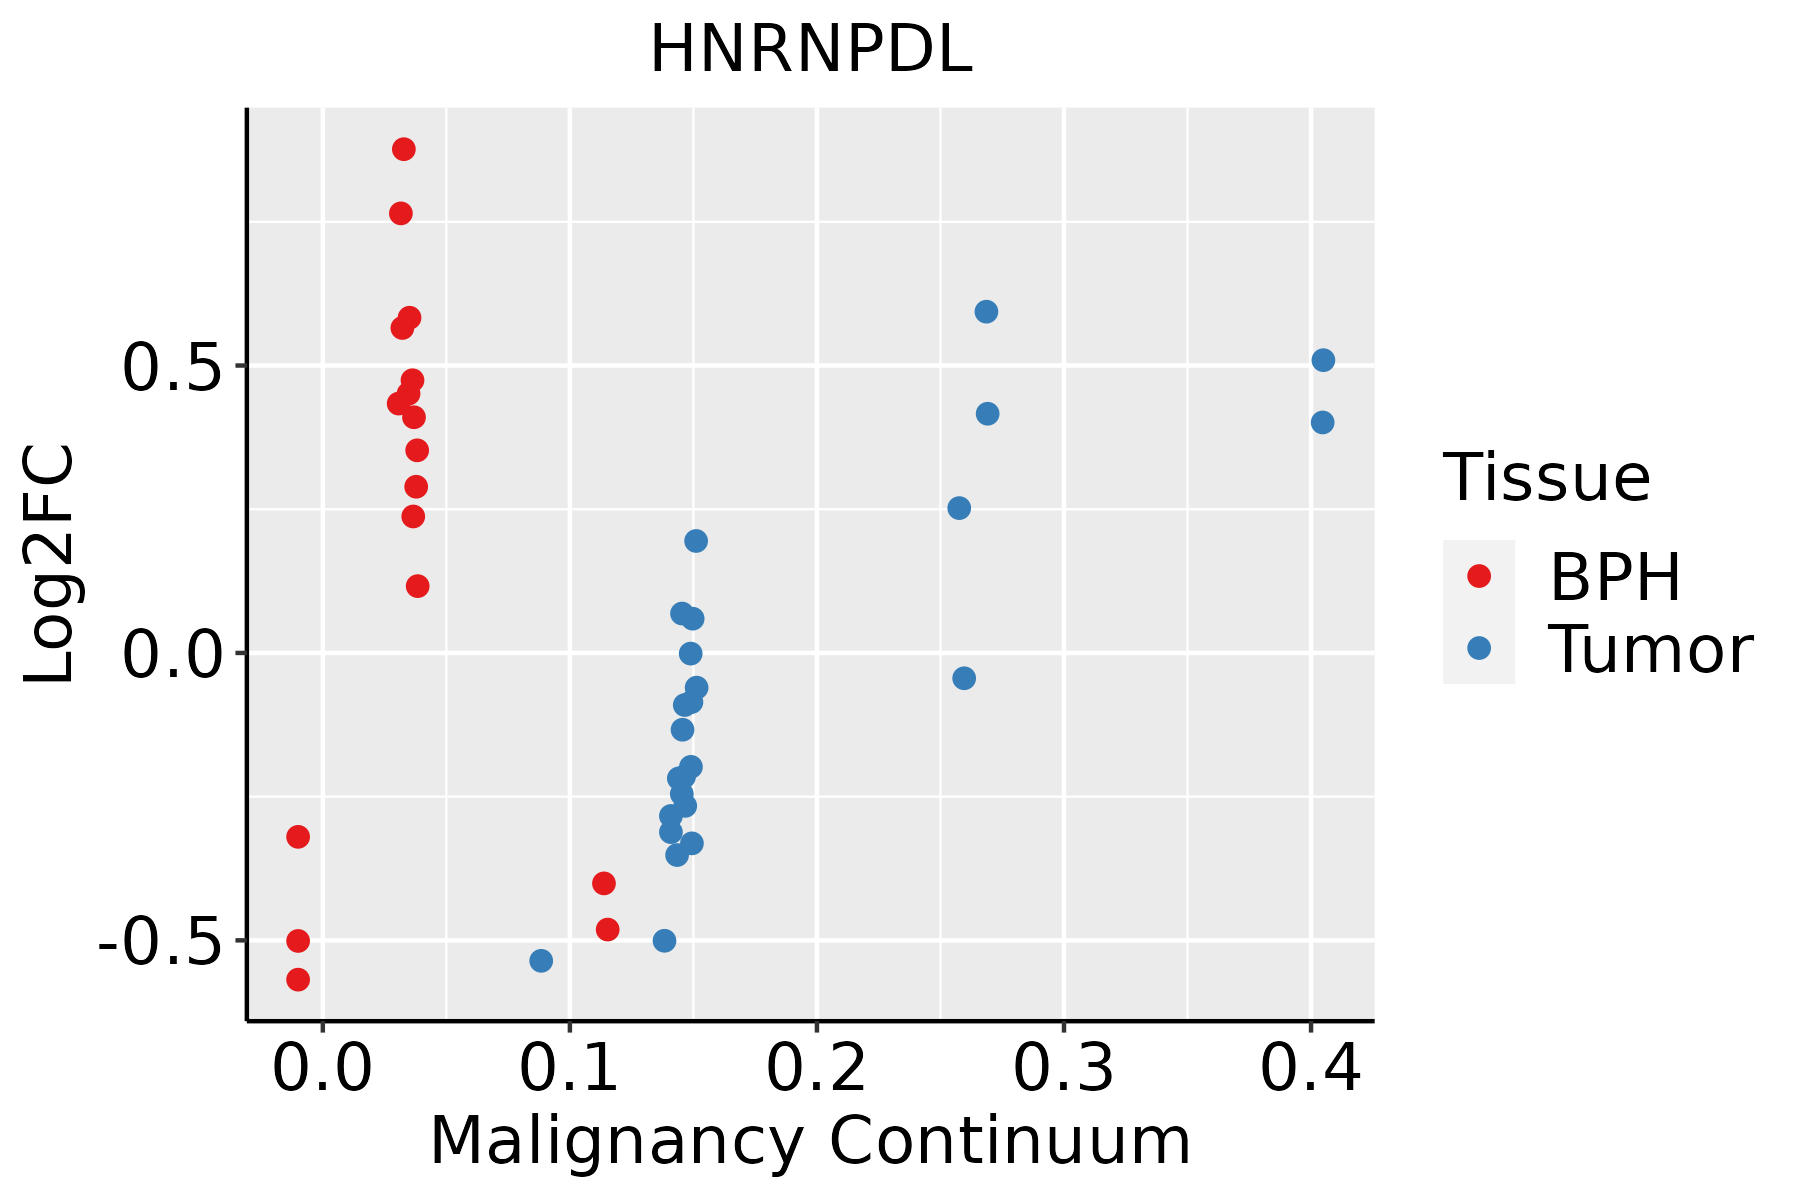 | BPH: Benign Prostatic Hyperplasia |
| Skin |  | AK: Actinic keratosis |
| cSCC: Cutaneous squamous cell carcinoma | ||
| SCCIS:squamous cell carcinoma in situ | ||
| Thyroid |  | ATC: Anaplastic thyroid cancer |
| HT: Hashimoto's thyroiditis | ||
| PTC: Papillary thyroid cancer |
| ∗log2FC in expression of this searched gene in stem-like cells from each diseased tissue sample relative to stem-like cells in normal samples in each tissue plotted against the malignancy continuum. Samples are colored based on if they are from different disease stage. |
Top |
Malignant transformation related pathway analysis |
| Find out the enriched GO biological processes and KEGG pathways involved in transition from healthy to precancer to cancer |
| Tissue | Disease Stage | Enriched GO biological Processes |
| Colorectum | AD |  |
| Colorectum | SER |  |
| Colorectum | MSS |  |
| Colorectum | MSI-H |  |
| Colorectum | FAP |  |
| ∗Top 15 enriched GO BP terms are showed in the bar plot of each disease state in each tissue. Each row represents a significant GO biological process which is colored according to the -log10(p.adjust). |
| Page: 1 2 3 4 5 6 7 8 9 |
| GO ID | Tissue | Disease Stage | Description | Gene Ratio | Bg Ratio | pvalue | p.adjust | Count |
| Page: 1 |
| Pathway ID | Tissue | Disease Stage | Description | Gene Ratio | Bg Ratio | pvalue | p.adjust | qvalue | Count |
| Page: 1 |
Top |
Cell-cell communication analysis |
| Identification of potential cell-cell interactions between two cell types and their ligand-receptor pairs for different disease states |
| Ligand | Receptor | LRpair | Pathway | Tissue | Disease Stage |
| Page: 1 |
Top |
Single-cell gene regulatory network inference analysis |
| Find out the significant the regulons (TFs) and the target genes of each regulon across cell types for different disease states |
| TF | Cell Type | Tissue | Disease Stage | Target Gene | RSS | Regulon Activity |
| ∗The dot plots of a searched regulon are shown for all cell subpopulations in each disease state of each tissue based on the regulon specific score inferred using pySCENIC and by calculating the average expression. |
| Page: 1 |
Top |
Somatic mutation of malignant transformation related genes |
| Annotation of somatic variants for genes involved in malignant transformation |
| Hugo Symbol | Variant Class | Variant Classification | dbSNP RS | HGVSc | HGVSp | HGVSp Short | SWISSPROT | BIOTYPE | SIFT | PolyPhen | Tumor Sample Barcode | Tissue | Histology | Sex | Age | Stage | Therapy Types | Drugs | Outcome |
| HNRNPDL | SNV | Missense_Mutation | c.347G>C | p.Ser116Thr | p.S116T | O14979 | protein_coding | tolerated_low_confidence(0.41) | benign(0.05) | TCGA-A1-A0SJ-01 | Breast | breast invasive carcinoma | Female | <65 | III/IV | Unknown | Unknown | SD | |
| HNRNPDL | SNV | Missense_Mutation | c.227A>C | p.Lys76Thr | p.K76T | O14979 | protein_coding | deleterious_low_confidence(0) | benign(0.129) | TCGA-E2-A14Y-01 | Breast | breast invasive carcinoma | Female | <65 | I/II | Chemotherapy | carboplatin | SD | |
| HNRNPDL | SNV | Missense_Mutation | c.1124N>A | p.Gly375Asp | p.G375D | O14979 | protein_coding | tolerated_low_confidence(0.1) | possibly_damaging(0.808) | TCGA-EW-A1IZ-01 | Breast | breast invasive carcinoma | Female | <65 | III/IV | Chemotherapy | taxotere | SD | |
| HNRNPDL | SNV | Missense_Mutation | novel | c.837N>G | p.Ile279Met | p.I279M | O14979 | protein_coding | deleterious(0) | probably_damaging(0.986) | TCGA-VS-A8QM-01 | Cervix | cervical & endocervical cancer | Female | <65 | I/II | Chemotherapy | cisplatin | PD |
| HNRNPDL | SNV | Missense_Mutation | novel | c.1102N>A | p.Asp368Asn | p.D368N | O14979 | protein_coding | tolerated(0.28) | benign(0.01) | TCGA-VS-A94Z-01 | Cervix | cervical & endocervical cancer | Female | <65 | I/II | Chemotherapy | cisplatin | CR |
| HNRNPDL | SNV | Missense_Mutation | rs141595181 | c.337N>T | p.Pro113Ser | p.P113S | O14979 | protein_coding | deleterious_low_confidence(0.03) | benign(0) | TCGA-AA-3660-01 | Colorectum | colon adenocarcinoma | Female | <65 | I/II | Unknown | Unknown | SD |
| HNRNPDL | SNV | Missense_Mutation | novel | c.1204A>G | p.Thr402Ala | p.T402A | O14979 | protein_coding | deleterious_low_confidence(0.04) | benign(0.259) | TCGA-AA-3811-01 | Colorectum | colon adenocarcinoma | Female | >=65 | III/IV | Unknown | Unknown | PD |
| HNRNPDL | SNV | Missense_Mutation | novel | c.411G>T | p.Lys137Asn | p.K137N | O14979 | protein_coding | deleterious(0.03) | possibly_damaging(0.767) | TCGA-AA-3980-01 | Colorectum | colon adenocarcinoma | Female | >=65 | I/II | Unknown | Unknown | SD |
| HNRNPDL | SNV | Missense_Mutation | rs752922266 | c.380N>A | p.Ser127Asn | p.S127N | O14979 | protein_coding | tolerated_low_confidence(0.08) | benign(0.003) | TCGA-AA-A00N-01 | Colorectum | colon adenocarcinoma | Male | >=65 | I/II | Unknown | Unknown | PD |
| HNRNPDL | SNV | Missense_Mutation | novel | c.649N>G | p.Leu217Val | p.L217V | O14979 | protein_coding | tolerated(0.57) | benign(0.089) | TCGA-CA-6717-01 | Colorectum | colon adenocarcinoma | Male | <65 | I/II | Chemotherapy | oxaliplatin | CR |
| Page: 1 2 3 4 5 |
Top |
Related drugs of malignant transformation related genes |
| Identification of chemicals and drugs interact with genes involved in malignant transfromation |
| (DGIdb 4.0) |
| Entrez ID | Symbol | Category | Interaction Types | Drug Claim Name | Drug Name | PMIDs |
| Page: 1 |

Copyright 2023-Present -The University of Texas Health Science Center at Houston |