
|
|||||
|
 | |
| |
| |
| |
| |
| |
|
Gene: HNRNPAB |
Gene summary for HNRNPAB |
| Gene information | Species | Human | Gene symbol | HNRNPAB | Gene ID | 3182 |
| Gene name | heterogeneous nuclear ribonucleoprotein A/B | |
| Gene Alias | ABBP1 | |
| Cytomap | 5q35.3 | |
| Gene Type | protein-coding | GO ID | GO:0001837 | UniProtAcc | Q99729 |
Top |
Malignant transformation analysis |
| Identification of the aberrant gene expression in precancerous and cancerous lesions by comparing the gene expression of stem-like cells in diseased tissues with normal stem cells |
| Entrez ID | Symbol | Replicates | Species | Organ | Tissue | Adj P-value | Log2FC | Malignancy |
| 3182 | HNRNPAB | GSM4909285 | Human | Breast | IDC | 2.76e-03 | 1.55e-01 | 0.21 |
| 3182 | HNRNPAB | GSM4909286 | Human | Breast | IDC | 1.88e-03 | -1.94e-01 | 0.1081 |
| 3182 | HNRNPAB | GSM4909288 | Human | Breast | IDC | 9.65e-03 | 1.19e-01 | 0.0988 |
| 3182 | HNRNPAB | GSM4909293 | Human | Breast | IDC | 1.13e-21 | 5.40e-01 | 0.1581 |
| 3182 | HNRNPAB | GSM4909294 | Human | Breast | IDC | 8.02e-05 | 2.71e-01 | 0.2022 |
| 3182 | HNRNPAB | GSM4909296 | Human | Breast | IDC | 4.47e-03 | -2.14e-01 | 0.1524 |
| 3182 | HNRNPAB | GSM4909297 | Human | Breast | IDC | 1.73e-09 | -2.06e-01 | 0.1517 |
| 3182 | HNRNPAB | GSM4909304 | Human | Breast | IDC | 1.93e-02 | 2.55e-01 | 0.1636 |
| 3182 | HNRNPAB | GSM4909311 | Human | Breast | IDC | 4.19e-19 | -3.39e-01 | 0.1534 |
| 3182 | HNRNPAB | GSM4909312 | Human | Breast | IDC | 2.59e-07 | -1.77e-01 | 0.1552 |
| 3182 | HNRNPAB | GSM4909316 | Human | Breast | IDC | 8.20e-03 | 1.36e-01 | 0.21 |
| 3182 | HNRNPAB | GSM4909317 | Human | Breast | IDC | 2.33e-02 | 2.75e-01 | 0.1355 |
| 3182 | HNRNPAB | GSM4909318 | Human | Breast | IDC | 1.86e-04 | 5.11e-01 | 0.2031 |
| 3182 | HNRNPAB | GSM4909319 | Human | Breast | IDC | 3.76e-30 | -2.47e-01 | 0.1563 |
| 3182 | HNRNPAB | GSM4909320 | Human | Breast | IDC | 2.40e-04 | 1.41e-01 | 0.1575 |
| 3182 | HNRNPAB | GSM4909321 | Human | Breast | IDC | 3.74e-07 | -7.47e-02 | 0.1559 |
| 3182 | HNRNPAB | brca10 | Human | Breast | Precancer | 1.25e-03 | -3.20e-01 | -0.0029 |
| 3182 | HNRNPAB | M2 | Human | Breast | IDC | 8.42e-10 | 5.78e-01 | 0.21 |
| 3182 | HNRNPAB | NCCBC14 | Human | Breast | DCIS | 1.34e-04 | 1.76e-01 | 0.2021 |
| 3182 | HNRNPAB | NCCBC2 | Human | Breast | DCIS | 5.82e-07 | 3.78e-01 | 0.1554 |
| Page: 1 2 3 4 5 6 7 8 9 10 11 12 |
| Tissue | Expression Dynamics | Abbreviation |
| Breast | 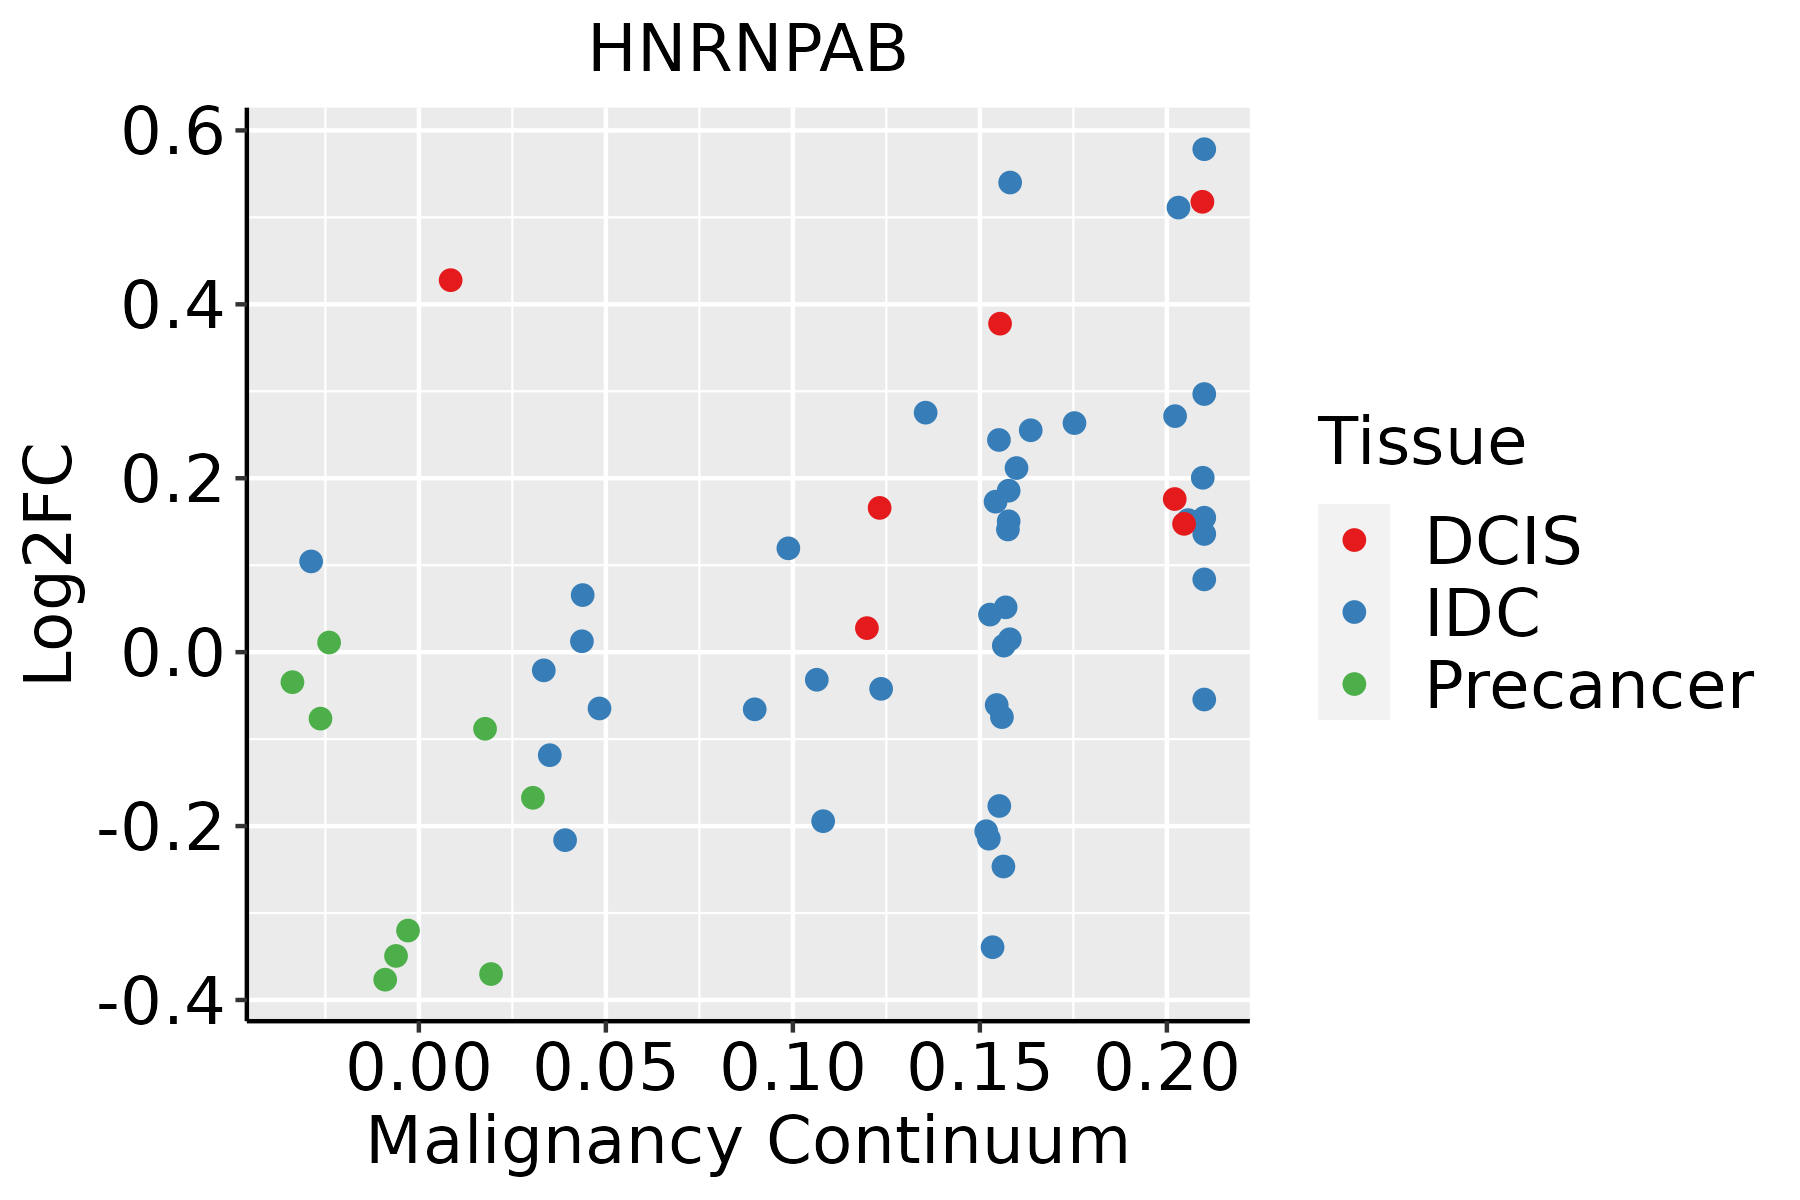 | IDC: Invasive ductal carcinoma |
| DCIS: Ductal carcinoma in situ | ||
| Precancer(BRCA1-mut): Precancerous lesion from BRCA1 mutation carriers | ||
| Cervix |  | CC: Cervix cancer |
| HSIL_HPV: HPV-infected high-grade squamous intraepithelial lesions | ||
| N_HPV: HPV-infected normal cervix | ||
| Colorectum (GSE201348) |  | FAP: Familial adenomatous polyposis |
| CRC: Colorectal cancer | ||
| Colorectum (HTA11) |  | AD: Adenomas |
| SER: Sessile serrated lesions | ||
| MSI-H: Microsatellite-high colorectal cancer | ||
| MSS: Microsatellite stable colorectal cancer | ||
| Endometrium |  | AEH: Atypical endometrial hyperplasia |
| EEC: Endometrioid Cancer | ||
| Esophagus | 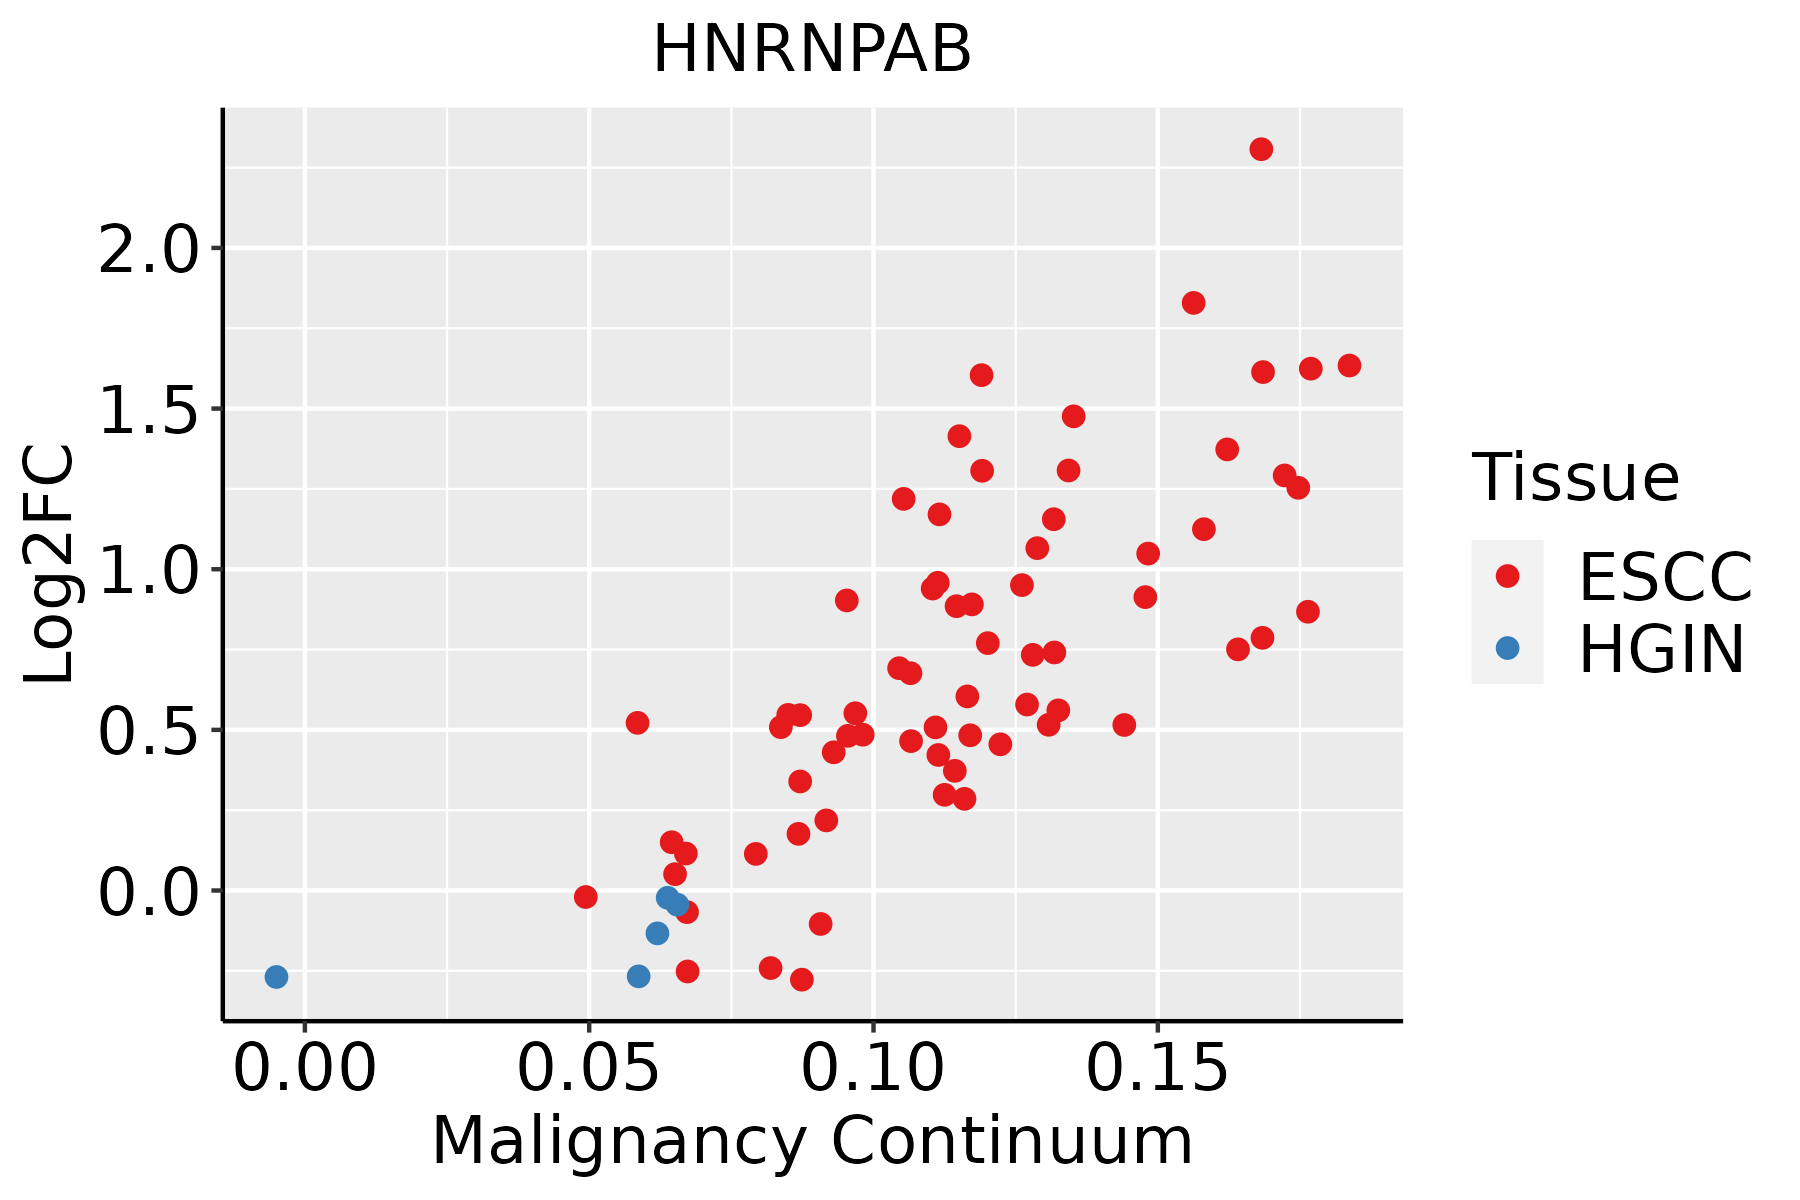 | ESCC: Esophageal squamous cell carcinoma |
| HGIN: High-grade intraepithelial neoplasias | ||
| LGIN: Low-grade intraepithelial neoplasias | ||
| Liver | 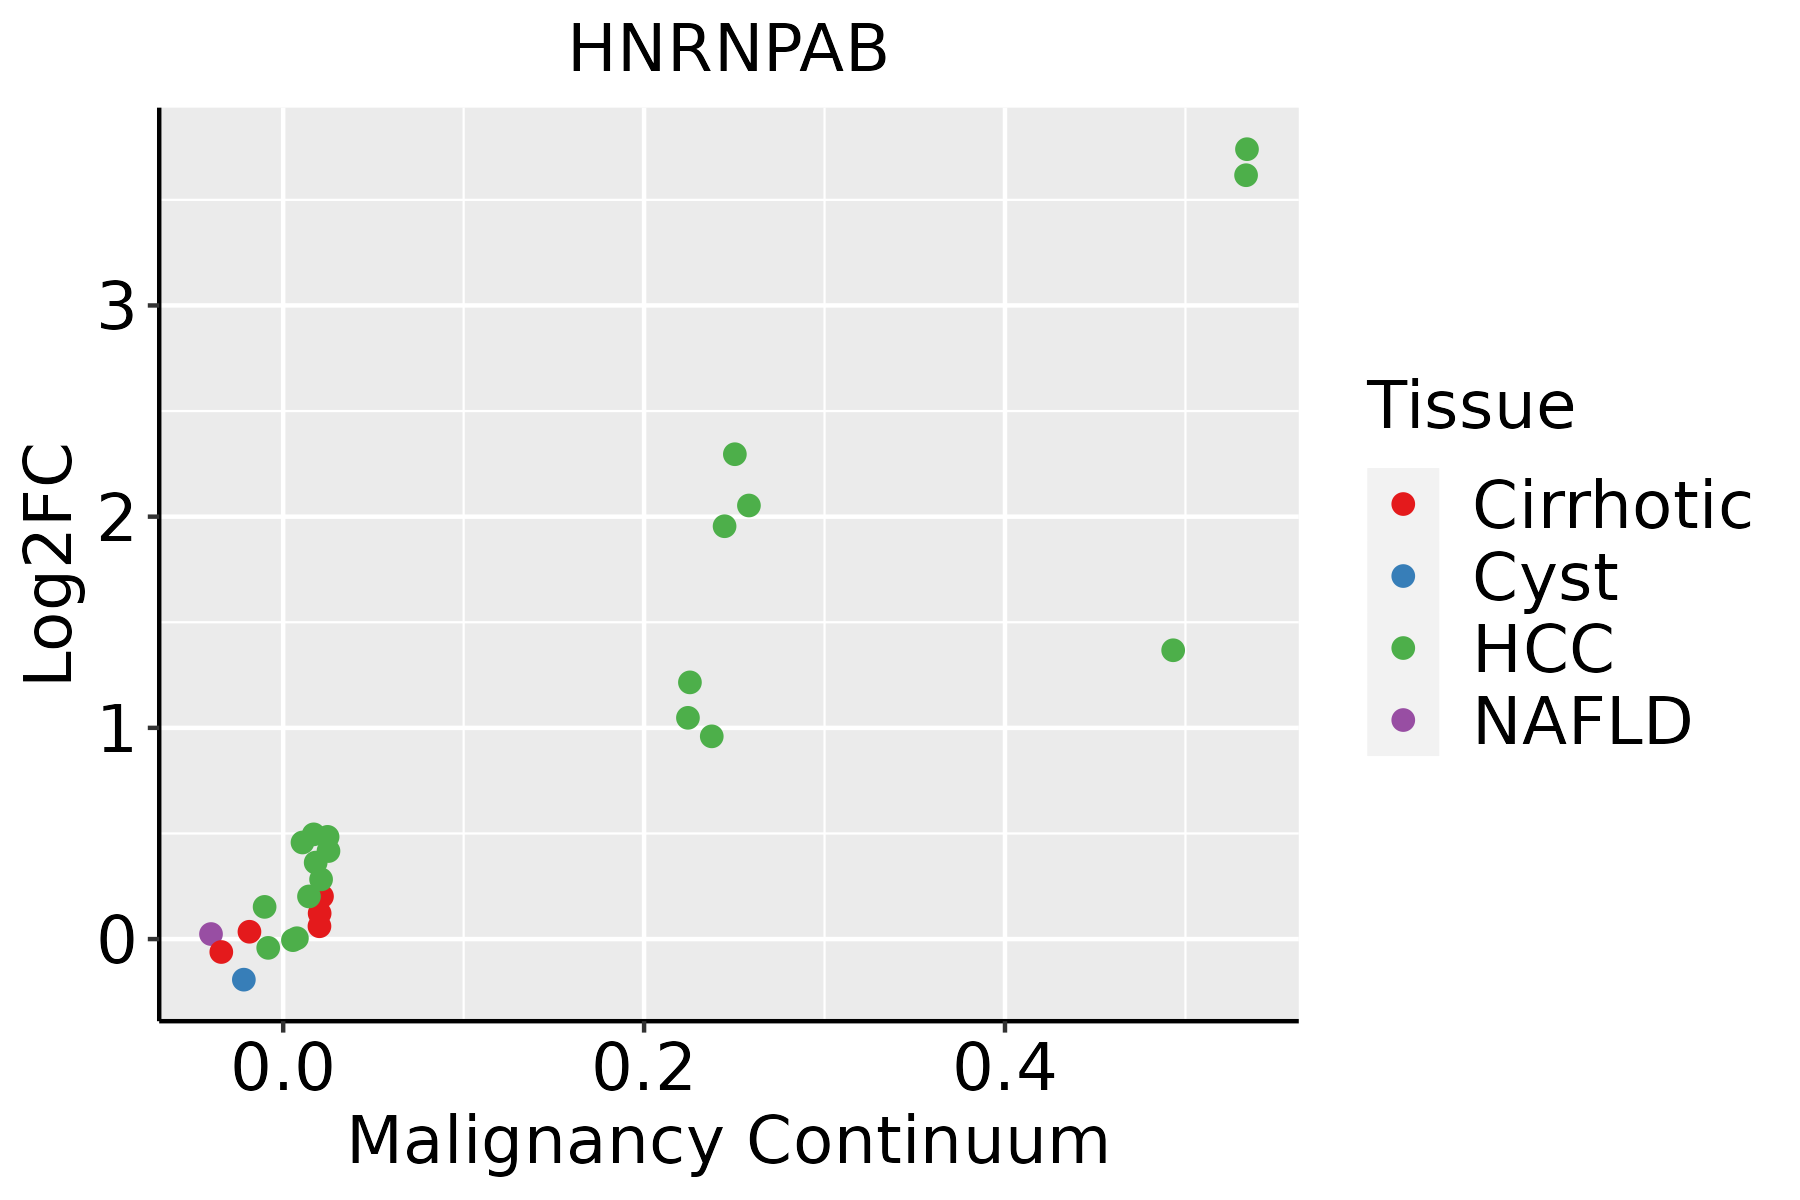 | HCC: Hepatocellular carcinoma |
| NAFLD: Non-alcoholic fatty liver disease | ||
| Oral Cavity | 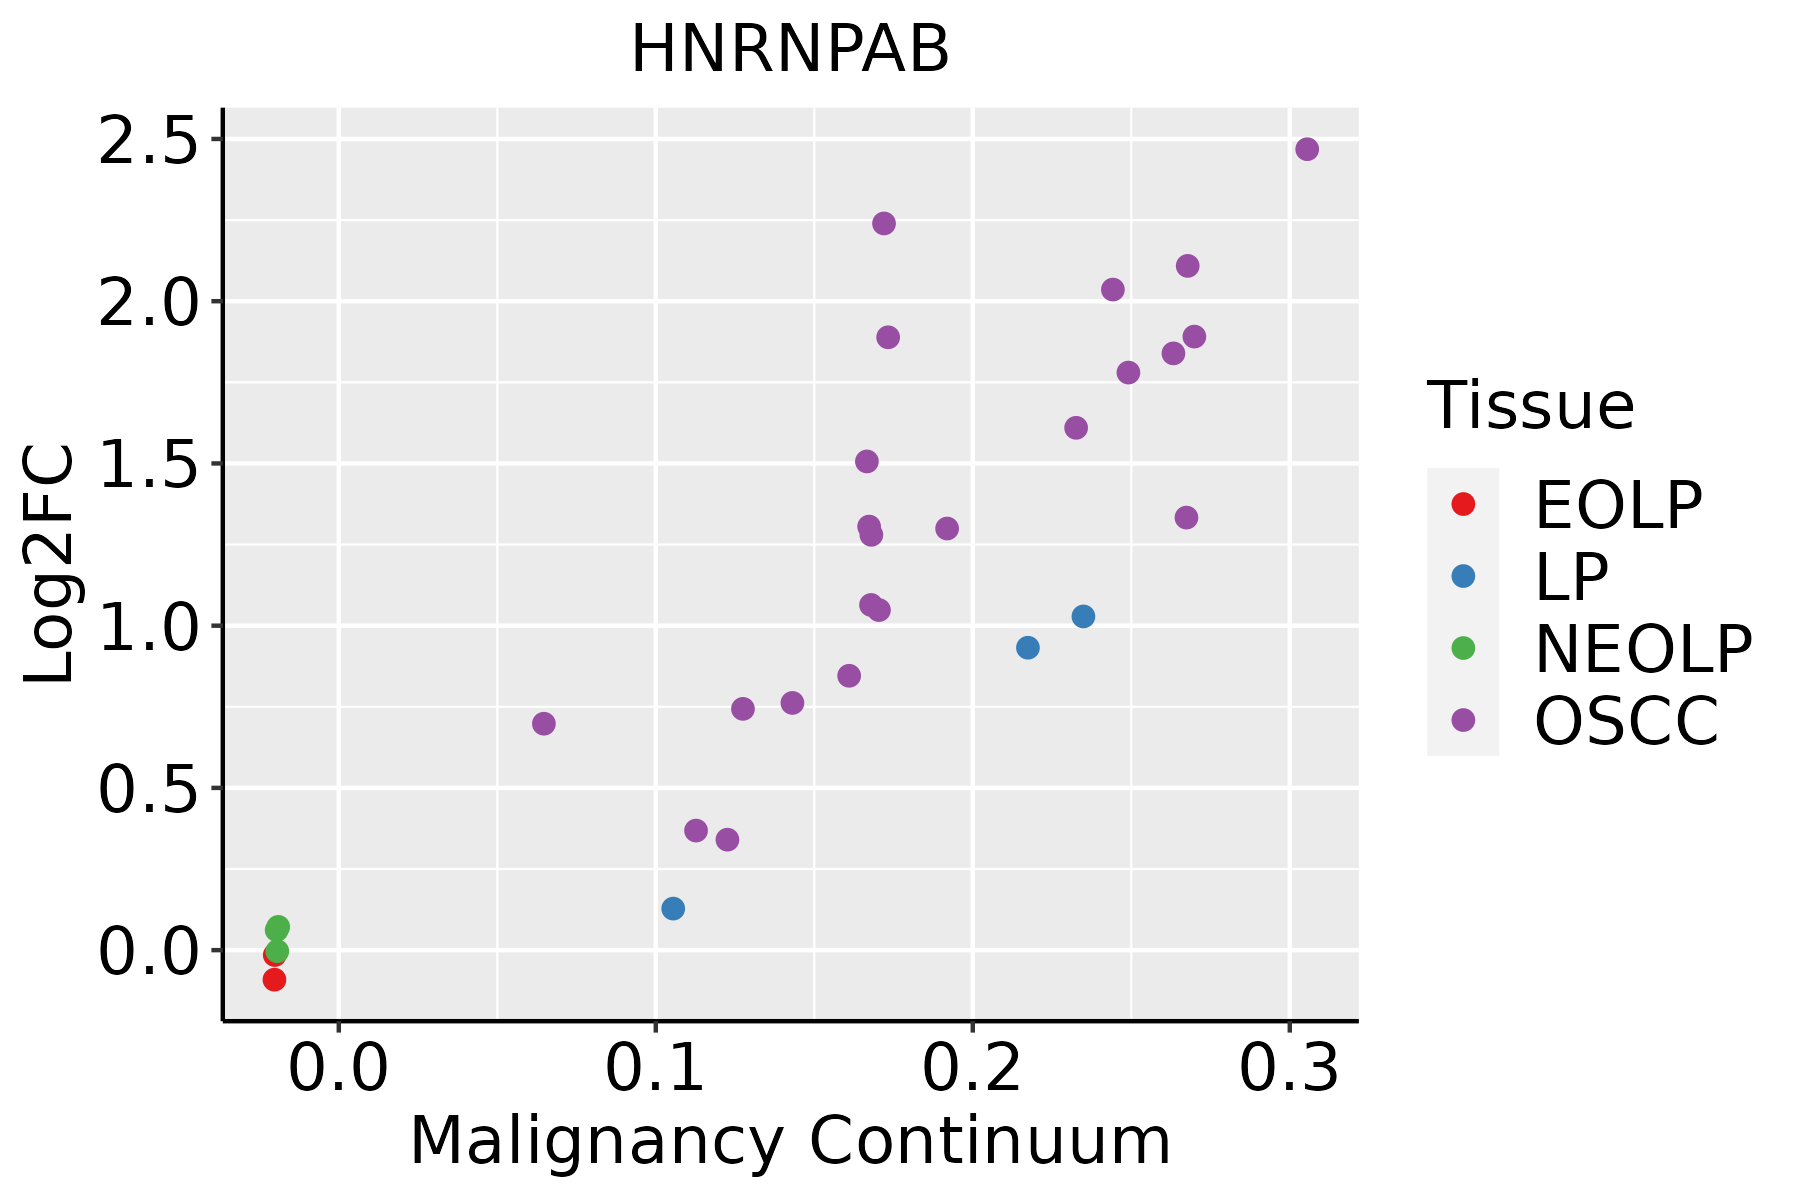 | EOLP: Erosive Oral lichen planus |
| LP: leukoplakia | ||
| NEOLP: Non-erosive oral lichen planus | ||
| OSCC: Oral squamous cell carcinoma | ||
| Prostate | 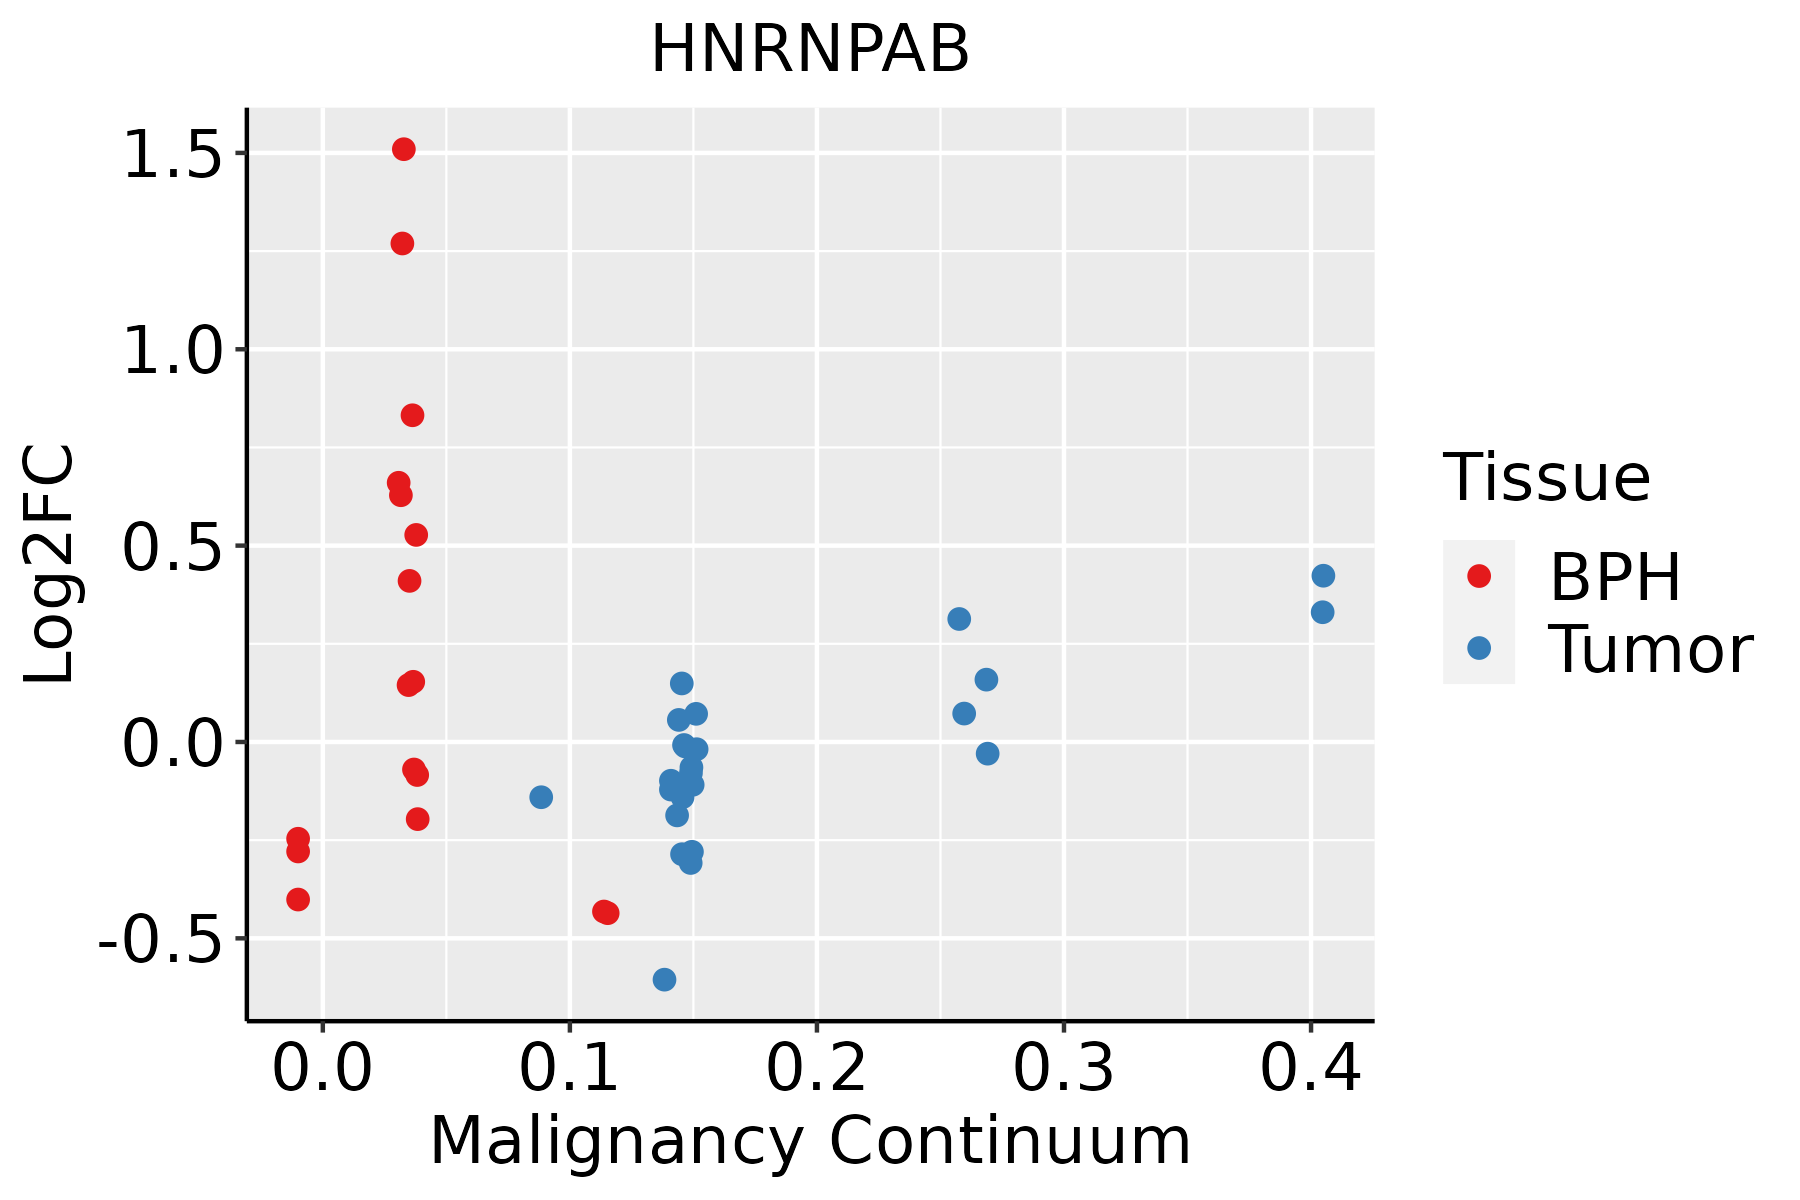 | BPH: Benign Prostatic Hyperplasia |
| Skin | 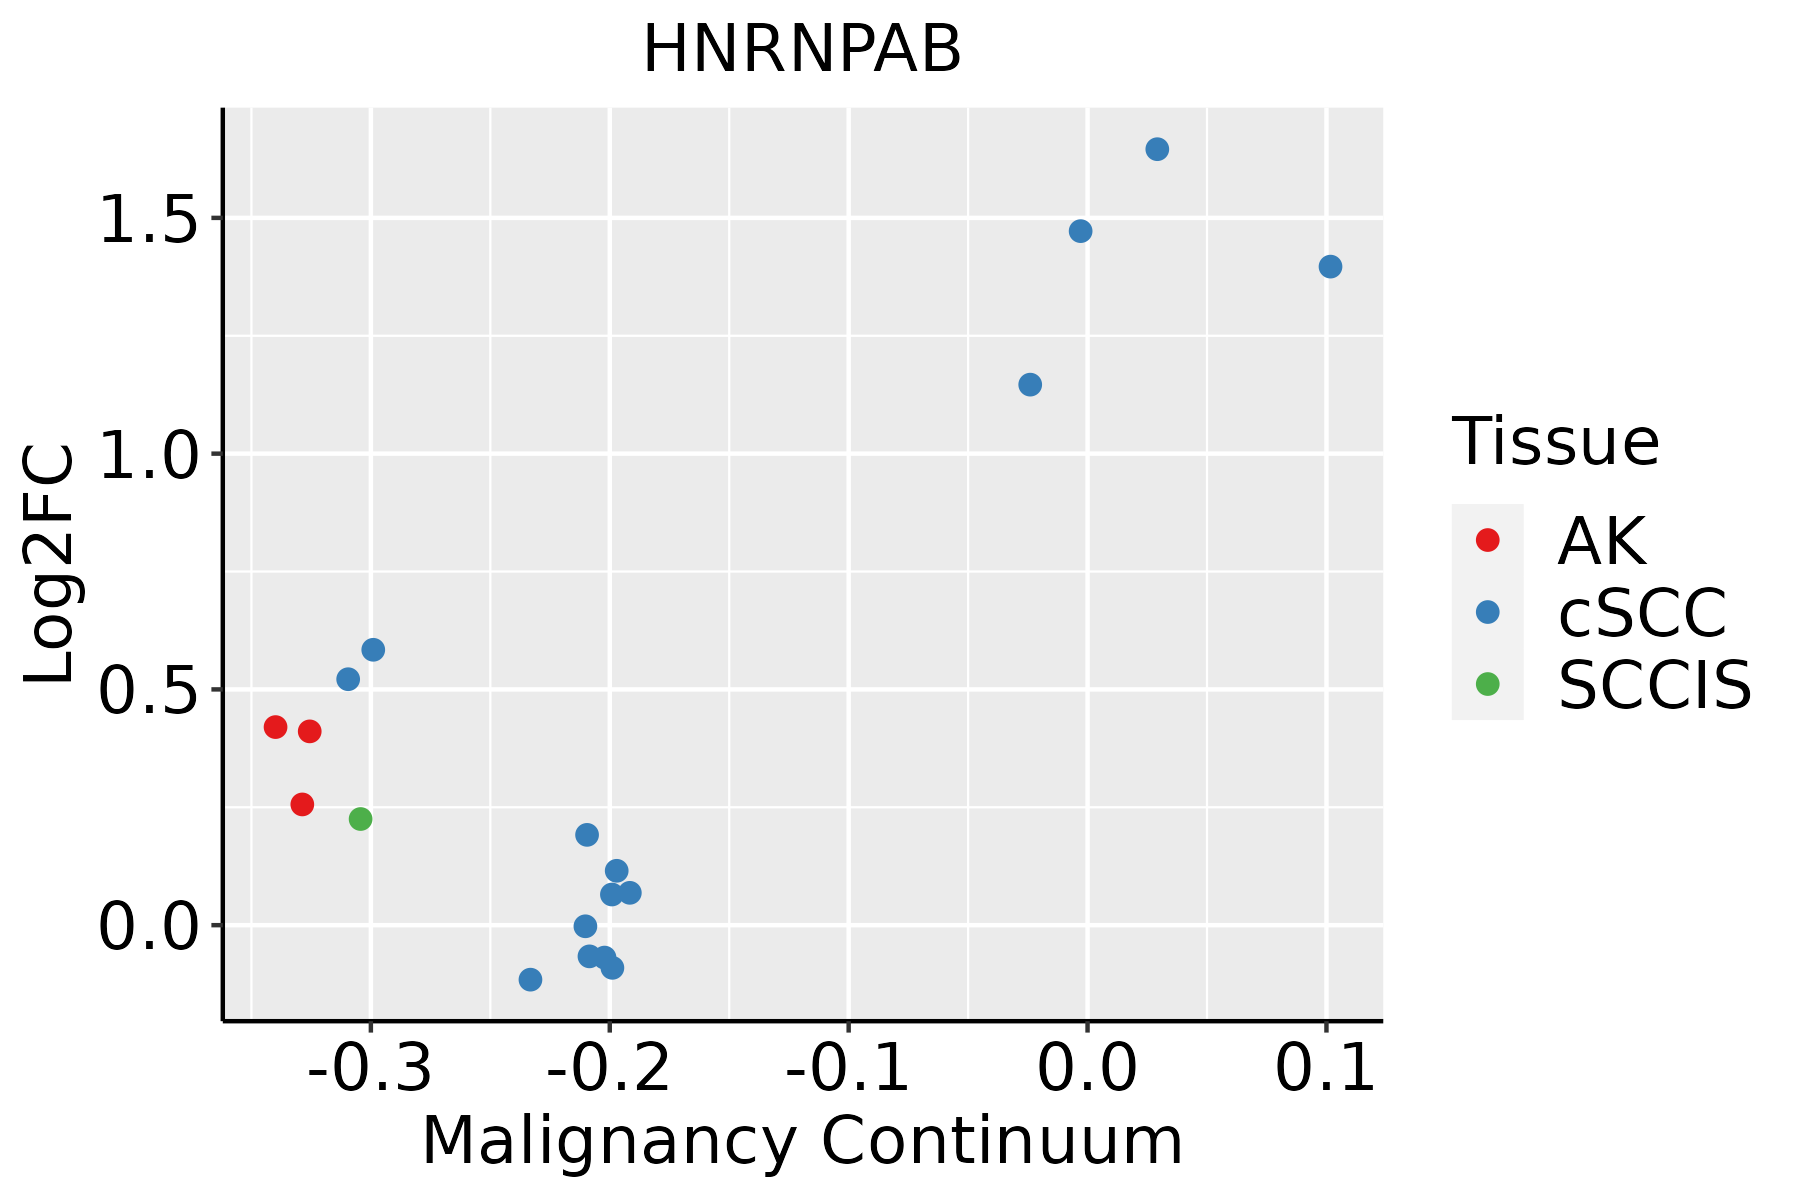 | AK: Actinic keratosis |
| cSCC: Cutaneous squamous cell carcinoma | ||
| SCCIS:squamous cell carcinoma in situ | ||
| Thyroid | 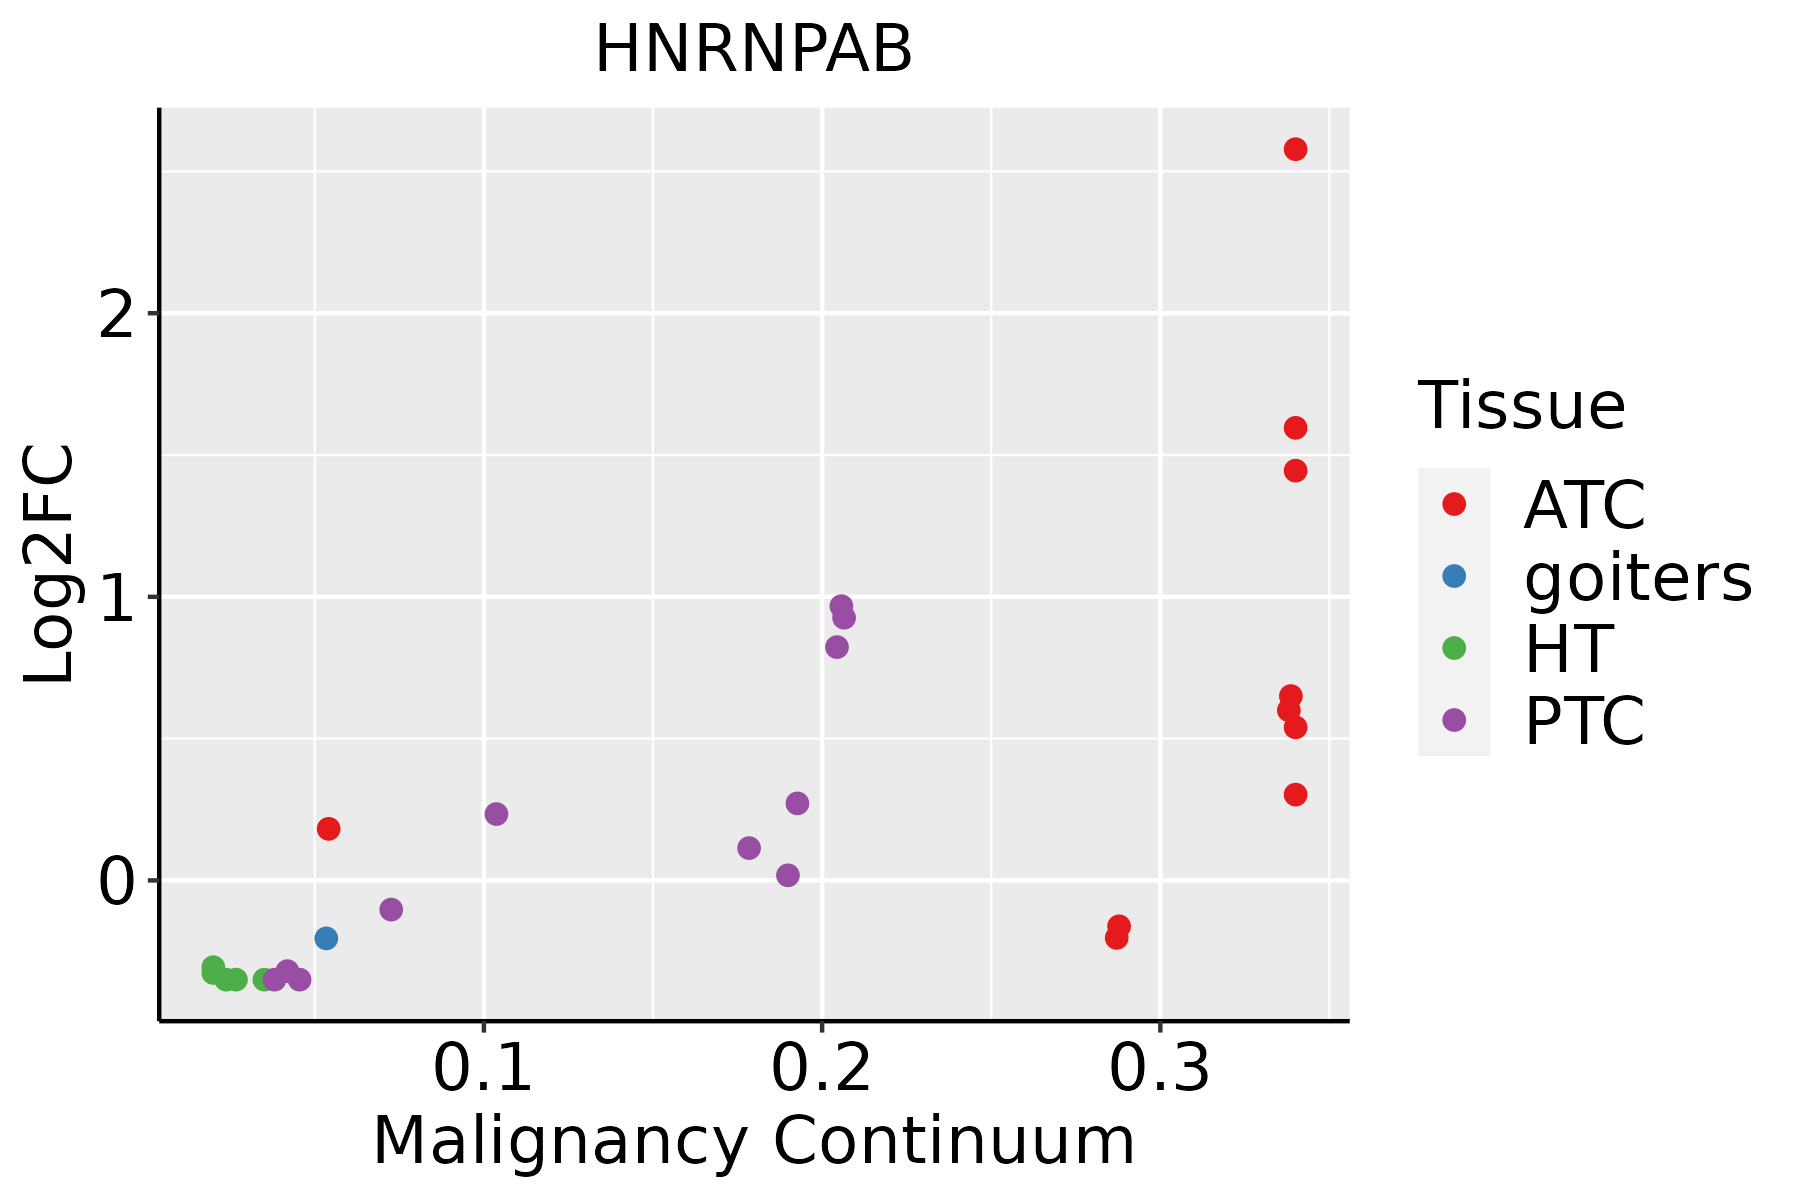 | ATC: Anaplastic thyroid cancer |
| HT: Hashimoto's thyroiditis | ||
| PTC: Papillary thyroid cancer |
| ∗log2FC in expression of this searched gene in stem-like cells from each diseased tissue sample relative to stem-like cells in normal samples in each tissue plotted against the malignancy continuum. Samples are colored based on if they are from different disease stage. |
Top |
Malignant transformation related pathway analysis |
| Find out the enriched GO biological processes and KEGG pathways involved in transition from healthy to precancer to cancer |
| Tissue | Disease Stage | Enriched GO biological Processes |
| Colorectum | AD |  |
| Colorectum | SER |  |
| Colorectum | MSS |  |
| Colorectum | MSI-H |  |
| Colorectum | FAP |  |
| ∗Top 15 enriched GO BP terms are showed in the bar plot of each disease state in each tissue. Each row represents a significant GO biological process which is colored according to the -log10(p.adjust). |
| Page: 1 2 3 4 5 6 7 8 9 |
| GO ID | Tissue | Disease Stage | Description | Gene Ratio | Bg Ratio | pvalue | p.adjust | Count |
| GO:00018373 | Breast | Precancer | epithelial to mesenchymal transition | 19/1080 | 157/18723 | 1.78e-03 | 1.75e-02 | 19 |
| GO:000183711 | Breast | IDC | epithelial to mesenchymal transition | 23/1434 | 157/18723 | 1.97e-03 | 1.88e-02 | 23 |
| GO:000183721 | Breast | DCIS | epithelial to mesenchymal transition | 22/1390 | 157/18723 | 2.92e-03 | 2.50e-02 | 22 |
| GO:00018374 | Cervix | CC | epithelial to mesenchymal transition | 31/2311 | 157/18723 | 5.25e-03 | 3.08e-02 | 31 |
| GO:00487624 | Cervix | CC | mesenchymal cell differentiation | 42/2311 | 236/18723 | 9.12e-03 | 4.60e-02 | 42 |
| GO:0048762 | Colorectum | MSS | mesenchymal cell differentiation | 59/3467 | 236/18723 | 7.79e-03 | 4.84e-02 | 59 |
| GO:00487621 | Colorectum | FAP | mesenchymal cell differentiation | 52/2622 | 236/18723 | 5.08e-04 | 5.80e-03 | 52 |
| GO:0001837 | Colorectum | FAP | epithelial to mesenchymal transition | 36/2622 | 157/18723 | 1.67e-03 | 1.47e-02 | 36 |
| GO:0060485 | Colorectum | FAP | mesenchyme development | 59/2622 | 291/18723 | 1.94e-03 | 1.64e-02 | 59 |
| GO:00487625 | Endometrium | AEH | mesenchymal cell differentiation | 46/2100 | 236/18723 | 1.27e-04 | 1.74e-03 | 46 |
| GO:00604853 | Endometrium | AEH | mesenchyme development | 54/2100 | 291/18723 | 1.34e-04 | 1.83e-03 | 54 |
| GO:00018375 | Endometrium | AEH | epithelial to mesenchymal transition | 33/2100 | 157/18723 | 2.64e-04 | 3.09e-03 | 33 |
| GO:004876212 | Endometrium | EEC | mesenchymal cell differentiation | 47/2168 | 236/18723 | 1.35e-04 | 1.76e-03 | 47 |
| GO:006048512 | Endometrium | EEC | mesenchyme development | 54/2168 | 291/18723 | 3.01e-04 | 3.37e-03 | 54 |
| GO:000183712 | Endometrium | EEC | epithelial to mesenchymal transition | 33/2168 | 157/18723 | 4.71e-04 | 4.84e-03 | 33 |
| GO:00018378 | Esophagus | ESCC | epithelial to mesenchymal transition | 95/8552 | 157/18723 | 1.25e-04 | 8.56e-04 | 95 |
| GO:00487628 | Esophagus | ESCC | mesenchymal cell differentiation | 133/8552 | 236/18723 | 5.94e-04 | 3.22e-03 | 133 |
| GO:00604856 | Esophagus | ESCC | mesenchyme development | 156/8552 | 291/18723 | 3.76e-03 | 1.53e-02 | 156 |
| GO:00018377 | Oral cavity | OSCC | epithelial to mesenchymal transition | 82/7305 | 157/18723 | 5.09e-04 | 2.98e-03 | 82 |
| GO:00487627 | Oral cavity | OSCC | mesenchymal cell differentiation | 109/7305 | 236/18723 | 1.43e-02 | 4.69e-02 | 109 |
| Page: 1 2 3 |
| Pathway ID | Tissue | Disease Stage | Description | Gene Ratio | Bg Ratio | pvalue | p.adjust | qvalue | Count |
| Page: 1 |
Top |
Cell-cell communication analysis |
| Identification of potential cell-cell interactions between two cell types and their ligand-receptor pairs for different disease states |
| Ligand | Receptor | LRpair | Pathway | Tissue | Disease Stage |
| Page: 1 |
Top |
Single-cell gene regulatory network inference analysis |
| Find out the significant the regulons (TFs) and the target genes of each regulon across cell types for different disease states |
| TF | Cell Type | Tissue | Disease Stage | Target Gene | RSS | Regulon Activity |
| ∗The dot plots of a searched regulon are shown for all cell subpopulations in each disease state of each tissue based on the regulon specific score inferred using pySCENIC and by calculating the average expression. |
| Page: 1 |
Top |
Somatic mutation of malignant transformation related genes |
| Annotation of somatic variants for genes involved in malignant transformation |
| Hugo Symbol | Variant Class | Variant Classification | dbSNP RS | HGVSc | HGVSp | HGVSp Short | SWISSPROT | BIOTYPE | SIFT | PolyPhen | Tumor Sample Barcode | Tissue | Histology | Sex | Age | Stage | Therapy Types | Drugs | Outcome |
| HNRNPAB | SNV | Missense_Mutation | rs377150533 | c.859G>A | p.Gly287Arg | p.G287R | Q99729 | protein_coding | tolerated(0.17) | probably_damaging(1) | TCGA-2W-A8YY-01 | Cervix | cervical & endocervical cancer | Female | <65 | I/II | Chemotherapy | cisplatin | CR |
| HNRNPAB | SNV | Missense_Mutation | c.380T>C | p.Val127Ala | p.V127A | Q99729 | protein_coding | deleterious(0.05) | probably_damaging(0.95) | TCGA-AA-3663-01 | Colorectum | colon adenocarcinoma | Male | <65 | I/II | Unknown | Unknown | SD | |
| HNRNPAB | SNV | Missense_Mutation | c.447N>T | p.Lys149Asn | p.K149N | Q99729 | protein_coding | deleterious(0.04) | probably_damaging(0.974) | TCGA-AA-A010-01 | Colorectum | colon adenocarcinoma | Female | <65 | I/II | Chemotherapy | folinic | CR | |
| HNRNPAB | SNV | Missense_Mutation | rs528992480 | c.922G>A | p.Asp308Asn | p.D308N | Q99729 | protein_coding | tolerated(0.14) | benign(0.025) | TCGA-AG-A002-01 | Colorectum | rectum adenocarcinoma | Male | <65 | I/II | Unknown | Unknown | SD |
| HNRNPAB | insertion | Frame_Shift_Ins | novel | c.644_645insTAAGCCCT | p.Lys215AsnfsTer130 | p.K215Nfs*130 | Q99729 | protein_coding | TCGA-AM-5820-01 | Colorectum | colon adenocarcinoma | Female | <65 | I/II | Unknown | Unknown | SD | ||
| HNRNPAB | insertion | Frame_Shift_Ins | novel | c.426_427insA | p.Ala145GlyfsTer20 | p.A145Gfs*20 | Q99729 | protein_coding | TCGA-QG-A5YV-01 | Colorectum | colon adenocarcinoma | Female | <65 | III/IV | Chemotherapy | xeloda | CR | ||
| HNRNPAB | insertion | Frame_Shift_Ins | novel | c.978_979insA | p.Asn327LysfsTer2 | p.N327Kfs*2 | Q99729 | protein_coding | TCGA-DC-6160-01 | Colorectum | rectum adenocarcinoma | Male | >=65 | I/II | Unknown | Unknown | SD | ||
| HNRNPAB | deletion | In_Frame_Del | c.389_391delNNN | p.Lys131del | p.K131del | Q99729 | protein_coding | TCGA-EI-6507-01 | Colorectum | rectum adenocarcinoma | Male | <65 | I/II | Unknown | Unknown | SD | |||
| HNRNPAB | deletion | Frame_Shift_Del | c.606delT | p.Phe202LeufsTer7 | p.F202Lfs*7 | Q99729 | protein_coding | TCGA-F5-6864-01 | Colorectum | rectum adenocarcinoma | Female | >=65 | III/IV | Chemotherapy | 5-fluorouracil | CR | |||
| HNRNPAB | SNV | Missense_Mutation | rs750746697 | c.547A>G | p.Ile183Val | p.I183V | Q99729 | protein_coding | tolerated(0.08) | benign(0.279) | TCGA-A5-A1OF-01 | Endometrium | uterine corpus endometrioid carcinoma | Female | <65 | I/II | Unknown | Unknown | SD |
| Page: 1 2 3 4 5 |
Top |
Related drugs of malignant transformation related genes |
| Identification of chemicals and drugs interact with genes involved in malignant transfromation |
| (DGIdb 4.0) |
| Entrez ID | Symbol | Category | Interaction Types | Drug Claim Name | Drug Name | PMIDs |
| Page: 1 |

Copyright 2023-Present -The University of Texas Health Science Center at Houston |