
|
|||||
|
 | |
| |
| |
| |
| |
| |
|
Gene: HNRNPA1L2 |
Gene summary for HNRNPA1L2 |
| Gene information | Species | Human | Gene symbol | HNRNPA1L2 | Gene ID | 144983 |
| Gene name | heterogeneous nuclear ribonucleoprotein A1 like 2 | |
| Gene Alias | HNRNPA1L2 | |
| Cytomap | 13q14.3 | |
| Gene Type | protein-coding | GO ID | GO:0006139 | UniProtAcc | A0A024QZ98 |
Top |
Malignant transformation analysis |
| Identification of the aberrant gene expression in precancerous and cancerous lesions by comparing the gene expression of stem-like cells in diseased tissues with normal stem cells |
| Entrez ID | Symbol | Replicates | Species | Organ | Tissue | Adj P-value | Log2FC | Malignancy |
| 144983 | HNRNPA1L2 | AEH-subject1 | Human | Endometrium | AEH | 1.16e-39 | -6.04e-01 | -0.3059 |
| 144983 | HNRNPA1L2 | AEH-subject2 | Human | Endometrium | AEH | 1.05e-32 | -6.00e-01 | -0.2525 |
| 144983 | HNRNPA1L2 | AEH-subject3 | Human | Endometrium | AEH | 2.87e-42 | -6.03e-01 | -0.2576 |
| 144983 | HNRNPA1L2 | AEH-subject4 | Human | Endometrium | AEH | 8.00e-27 | -6.02e-01 | -0.2657 |
| 144983 | HNRNPA1L2 | AEH-subject5 | Human | Endometrium | AEH | 2.01e-45 | -6.13e-01 | -0.2953 |
| 144983 | HNRNPA1L2 | EEC-subject1 | Human | Endometrium | EEC | 1.70e-41 | -6.05e-01 | -0.2682 |
| 144983 | HNRNPA1L2 | EEC-subject2 | Human | Endometrium | EEC | 3.82e-47 | -6.10e-01 | -0.2607 |
| 144983 | HNRNPA1L2 | EEC-subject3 | Human | Endometrium | EEC | 1.25e-47 | -6.14e-01 | -0.2525 |
| 144983 | HNRNPA1L2 | EEC-subject4 | Human | Endometrium | EEC | 2.07e-43 | -6.00e-01 | -0.2571 |
| 144983 | HNRNPA1L2 | EEC-subject5 | Human | Endometrium | EEC | 2.42e-46 | -6.07e-01 | -0.249 |
| 144983 | HNRNPA1L2 | GSM5276934 | Human | Endometrium | EEC | 1.01e-44 | -6.00e-01 | -0.0913 |
| 144983 | HNRNPA1L2 | GSM5276935 | Human | Endometrium | EEC | 4.83e-40 | -6.06e-01 | -0.123 |
| 144983 | HNRNPA1L2 | GSM5276937 | Human | Endometrium | EEC | 4.70e-38 | -6.23e-01 | -0.0897 |
| 144983 | HNRNPA1L2 | GSM6177620_NYU_UCEC1_lib1_lib1 | Human | Endometrium | EEC | 2.51e-33 | -6.23e-01 | -0.1869 |
| 144983 | HNRNPA1L2 | GSM6177620_NYU_UCEC1_lib2_lib2 | Human | Endometrium | EEC | 8.55e-27 | -6.10e-01 | -0.1875 |
| 144983 | HNRNPA1L2 | GSM6177620_NYU_UCEC1_lib3_lib3 | Human | Endometrium | EEC | 1.93e-34 | -6.23e-01 | -0.1883 |
| 144983 | HNRNPA1L2 | GSM6177621_NYU_UCEC2_lib1_lib1 | Human | Endometrium | EEC | 2.00e-47 | -6.08e-01 | -0.1934 |
| 144983 | HNRNPA1L2 | GSM6177622_NYU_UCEC3_lib1_lib1 | Human | Endometrium | EEC | 1.09e-51 | -6.12e-01 | -0.1917 |
| 144983 | HNRNPA1L2 | GSM6177622_NYU_UCEC3_lib2_lib2 | Human | Endometrium | EEC | 5.68e-44 | -6.23e-01 | -0.1916 |
| 144983 | HNRNPA1L2 | GSM6177623_NYU_UCEC3_Vis | Human | Endometrium | EEC | 3.39e-37 | -5.75e-01 | -0.1269 |
| Page: 1 2 |
| Tissue | Expression Dynamics | Abbreviation |
| Endometrium |  | AEH: Atypical endometrial hyperplasia |
| EEC: Endometrioid Cancer | ||
| Oral Cavity | 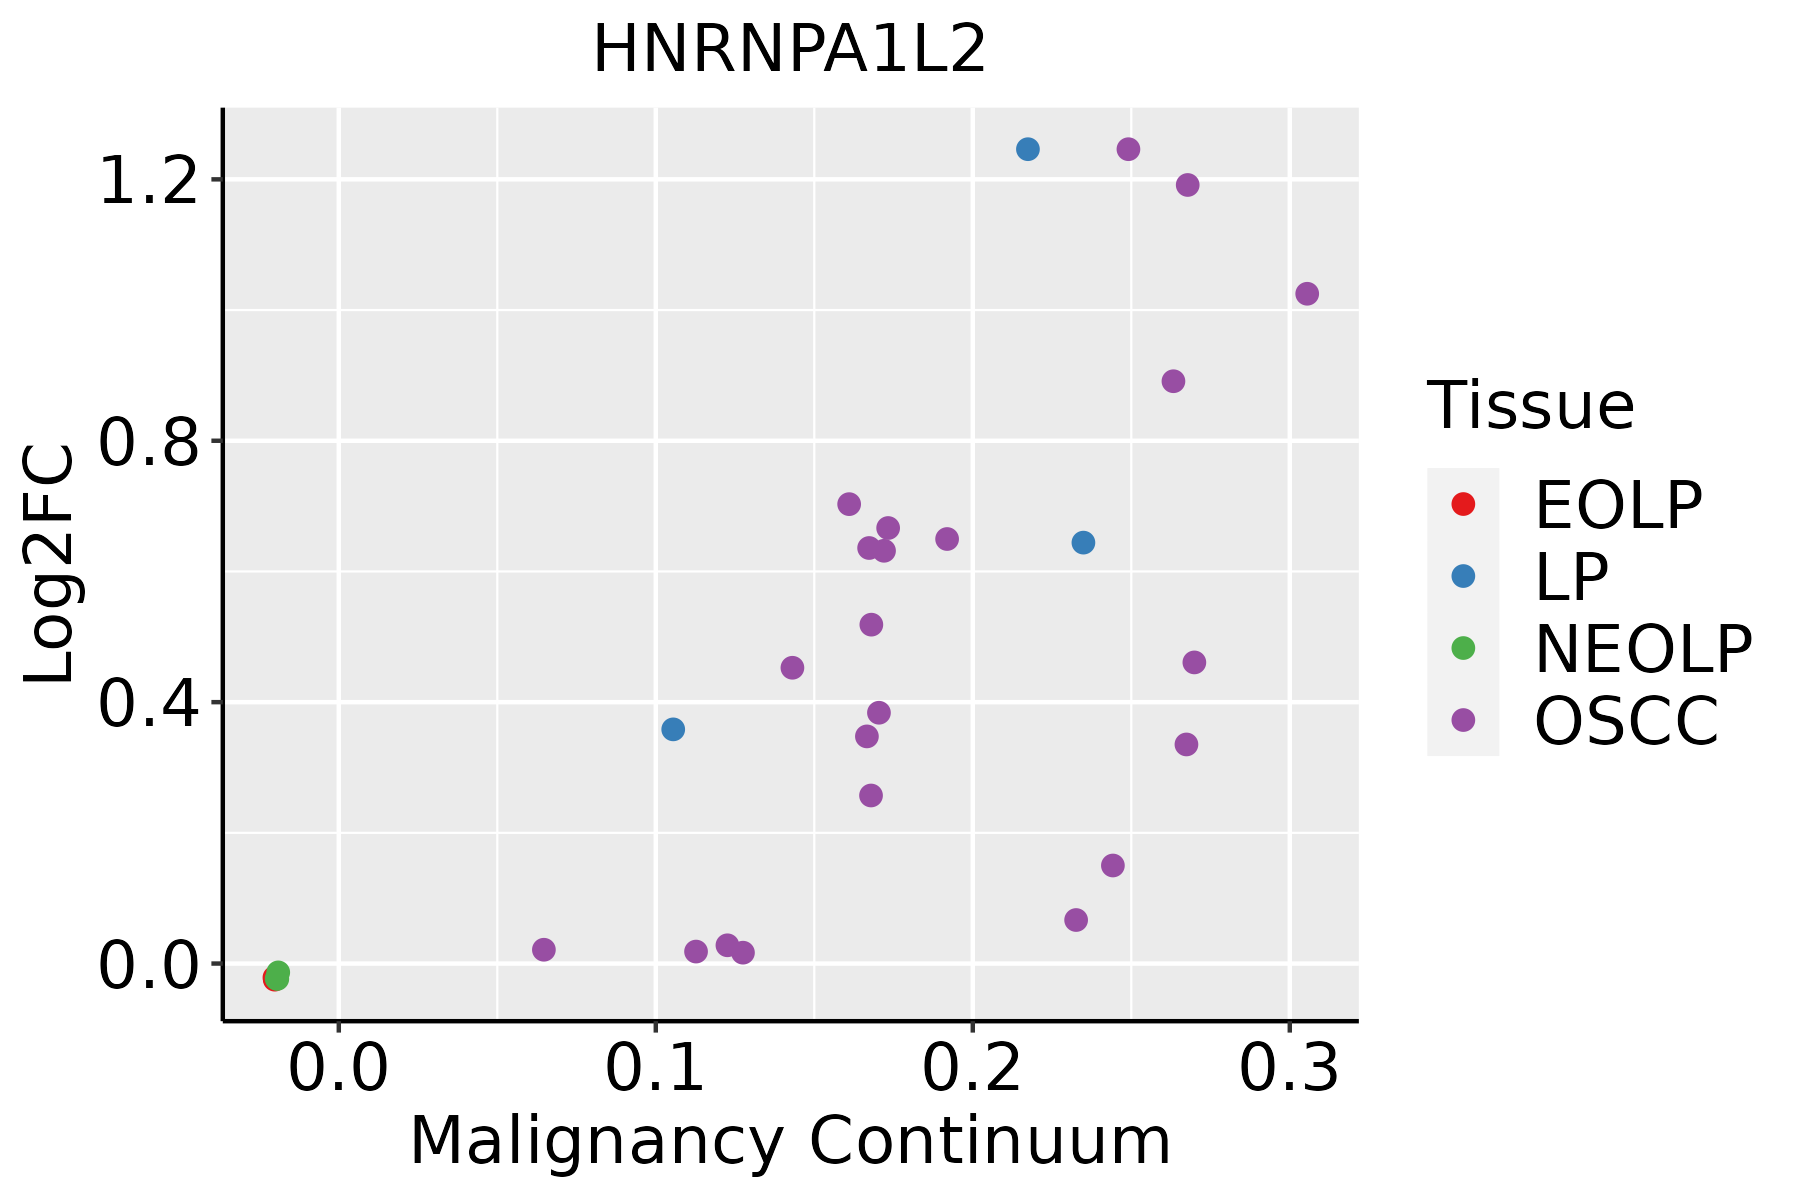 | EOLP: Erosive Oral lichen planus |
| LP: leukoplakia | ||
| NEOLP: Non-erosive oral lichen planus | ||
| OSCC: Oral squamous cell carcinoma | ||
| Prostate |  | BPH: Benign Prostatic Hyperplasia |
| Skin |  | AK: Actinic keratosis |
| cSCC: Cutaneous squamous cell carcinoma | ||
| SCCIS:squamous cell carcinoma in situ |
| ∗log2FC in expression of this searched gene in stem-like cells from each diseased tissue sample relative to stem-like cells in normal samples in each tissue plotted against the malignancy continuum. Samples are colored based on if they are from different disease stage. |
Top |
Malignant transformation related pathway analysis |
| Find out the enriched GO biological processes and KEGG pathways involved in transition from healthy to precancer to cancer |
| Tissue | Disease Stage | Enriched GO biological Processes |
| Colorectum | AD |  |
| Colorectum | SER |  |
| Colorectum | MSS |  |
| Colorectum | MSI-H |  |
| Colorectum | FAP |  |
| ∗Top 15 enriched GO BP terms are showed in the bar plot of each disease state in each tissue. Each row represents a significant GO biological process which is colored according to the -log10(p.adjust). |
| Page: 1 2 3 4 5 6 7 8 9 |
| GO ID | Tissue | Disease Stage | Description | Gene Ratio | Bg Ratio | pvalue | p.adjust | Count |
| GO:000838016 | Endometrium | AEH | RNA splicing | 111/2100 | 434/18723 | 2.42e-17 | 1.12e-14 | 111 |
| GO:000640314 | Endometrium | AEH | RNA localization | 51/2100 | 201/18723 | 1.39e-08 | 8.98e-07 | 51 |
| GO:00506579 | Endometrium | AEH | nucleic acid transport | 37/2100 | 163/18723 | 2.04e-05 | 4.09e-04 | 37 |
| GO:00506589 | Endometrium | AEH | RNA transport | 37/2100 | 163/18723 | 2.04e-05 | 4.09e-04 | 37 |
| GO:00512369 | Endometrium | AEH | establishment of RNA localization | 37/2100 | 166/18723 | 3.13e-05 | 5.66e-04 | 37 |
| GO:00159319 | Endometrium | AEH | nucleobase-containing compound transport | 44/2100 | 222/18723 | 1.19e-04 | 1.66e-03 | 44 |
| GO:00510285 | Endometrium | AEH | mRNA transport | 28/2100 | 130/18723 | 4.94e-04 | 5.06e-03 | 28 |
| GO:000838017 | Endometrium | EEC | RNA splicing | 111/2168 | 434/18723 | 2.45e-16 | 1.13e-13 | 111 |
| GO:000640315 | Endometrium | EEC | RNA localization | 53/2168 | 201/18723 | 5.20e-09 | 3.47e-07 | 53 |
| GO:005065712 | Endometrium | EEC | nucleic acid transport | 39/2168 | 163/18723 | 7.00e-06 | 1.63e-04 | 39 |
| GO:005065812 | Endometrium | EEC | RNA transport | 39/2168 | 163/18723 | 7.00e-06 | 1.63e-04 | 39 |
| GO:005123612 | Endometrium | EEC | establishment of RNA localization | 39/2168 | 166/18723 | 1.11e-05 | 2.33e-04 | 39 |
| GO:001593112 | Endometrium | EEC | nucleobase-containing compound transport | 46/2168 | 222/18723 | 5.91e-05 | 9.13e-04 | 46 |
| GO:005102812 | Endometrium | EEC | mRNA transport | 29/2168 | 130/18723 | 3.63e-04 | 3.95e-03 | 29 |
| GO:000838020 | Oral cavity | OSCC | RNA splicing | 308/7305 | 434/18723 | 2.43e-42 | 7.70e-39 | 308 |
| GO:000640318 | Oral cavity | OSCC | RNA localization | 150/7305 | 201/18723 | 6.90e-25 | 1.98e-22 | 150 |
| GO:00510287 | Oral cavity | OSCC | mRNA transport | 101/7305 | 130/18723 | 2.19e-19 | 3.15e-17 | 101 |
| GO:005065714 | Oral cavity | OSCC | nucleic acid transport | 120/7305 | 163/18723 | 2.31e-19 | 3.18e-17 | 120 |
| GO:005065814 | Oral cavity | OSCC | RNA transport | 120/7305 | 163/18723 | 2.31e-19 | 3.18e-17 | 120 |
| GO:005123614 | Oral cavity | OSCC | establishment of RNA localization | 121/7305 | 166/18723 | 6.38e-19 | 8.24e-17 | 121 |
| Page: 1 2 3 |
| Pathway ID | Tissue | Disease Stage | Description | Gene Ratio | Bg Ratio | pvalue | p.adjust | qvalue | Count |
| hsa0501420 | Endometrium | AEH | Amyotrophic lateral sclerosis | 123/1197 | 364/8465 | 2.17e-22 | 7.82e-21 | 5.72e-21 | 123 |
| hsa030409 | Endometrium | AEH | Spliceosome | 54/1197 | 217/8465 | 1.47e-05 | 1.65e-04 | 1.21e-04 | 54 |
| hsa05014110 | Endometrium | AEH | Amyotrophic lateral sclerosis | 123/1197 | 364/8465 | 2.17e-22 | 7.82e-21 | 5.72e-21 | 123 |
| hsa0304014 | Endometrium | AEH | Spliceosome | 54/1197 | 217/8465 | 1.47e-05 | 1.65e-04 | 1.21e-04 | 54 |
| hsa0501425 | Endometrium | EEC | Amyotrophic lateral sclerosis | 128/1237 | 364/8465 | 9.83e-24 | 4.04e-22 | 3.01e-22 | 128 |
| hsa0304024 | Endometrium | EEC | Spliceosome | 54/1237 | 217/8465 | 3.78e-05 | 3.88e-04 | 2.89e-04 | 54 |
| hsa0501435 | Endometrium | EEC | Amyotrophic lateral sclerosis | 128/1237 | 364/8465 | 9.83e-24 | 4.04e-22 | 3.01e-22 | 128 |
| hsa0304034 | Endometrium | EEC | Spliceosome | 54/1237 | 217/8465 | 3.78e-05 | 3.88e-04 | 2.89e-04 | 54 |
| hsa0501428 | Oral cavity | OSCC | Amyotrophic lateral sclerosis | 246/3704 | 364/8465 | 6.65e-21 | 1.11e-18 | 5.67e-19 | 246 |
| hsa0304016 | Oral cavity | OSCC | Spliceosome | 123/3704 | 217/8465 | 7.21e-05 | 2.74e-04 | 1.40e-04 | 123 |
| hsa05014112 | Oral cavity | OSCC | Amyotrophic lateral sclerosis | 246/3704 | 364/8465 | 6.65e-21 | 1.11e-18 | 5.67e-19 | 246 |
| hsa0304017 | Oral cavity | OSCC | Spliceosome | 123/3704 | 217/8465 | 7.21e-05 | 2.74e-04 | 1.40e-04 | 123 |
| hsa0501429 | Oral cavity | LP | Amyotrophic lateral sclerosis | 197/2418 | 364/8465 | 1.25e-25 | 1.39e-23 | 8.93e-24 | 197 |
| hsa0304026 | Oral cavity | LP | Spliceosome | 106/2418 | 217/8465 | 1.30e-10 | 2.40e-09 | 1.55e-09 | 106 |
| hsa0501437 | Oral cavity | LP | Amyotrophic lateral sclerosis | 197/2418 | 364/8465 | 1.25e-25 | 1.39e-23 | 8.93e-24 | 197 |
| hsa0304036 | Oral cavity | LP | Spliceosome | 106/2418 | 217/8465 | 1.30e-10 | 2.40e-09 | 1.55e-09 | 106 |
| hsa0501427 | Prostate | Tumor | Amyotrophic lateral sclerosis | 155/1791 | 364/8465 | 3.41e-21 | 1.13e-19 | 6.99e-20 | 155 |
| hsa0304025 | Prostate | Tumor | Spliceosome | 66/1791 | 217/8465 | 7.53e-04 | 3.59e-03 | 2.23e-03 | 66 |
| hsa0501436 | Prostate | Tumor | Amyotrophic lateral sclerosis | 155/1791 | 364/8465 | 3.41e-21 | 1.13e-19 | 6.99e-20 | 155 |
| hsa0304035 | Prostate | Tumor | Spliceosome | 66/1791 | 217/8465 | 7.53e-04 | 3.59e-03 | 2.23e-03 | 66 |
| Page: 1 |
Top |
Cell-cell communication analysis |
| Identification of potential cell-cell interactions between two cell types and their ligand-receptor pairs for different disease states |
| Ligand | Receptor | LRpair | Pathway | Tissue | Disease Stage |
| Page: 1 |
Top |
Single-cell gene regulatory network inference analysis |
| Find out the significant the regulons (TFs) and the target genes of each regulon across cell types for different disease states |
| TF | Cell Type | Tissue | Disease Stage | Target Gene | RSS | Regulon Activity |
| ∗The dot plots of a searched regulon are shown for all cell subpopulations in each disease state of each tissue based on the regulon specific score inferred using pySCENIC and by calculating the average expression. |
| Page: 1 |
Top |
Somatic mutation of malignant transformation related genes |
| Annotation of somatic variants for genes involved in malignant transformation |
| Hugo Symbol | Variant Class | Variant Classification | dbSNP RS | HGVSc | HGVSp | HGVSp Short | SWISSPROT | BIOTYPE | SIFT | PolyPhen | Tumor Sample Barcode | Tissue | Histology | Sex | Age | Stage | Therapy Types | Drugs | Outcome |
| HNRNPA1L2 | SNV | Missense_Mutation | novel | c.386G>A | p.Gly129Glu | p.G129E | Q32P51 | protein_coding | deleterious(0.04) | probably_damaging(0.959) | TCGA-2W-A8YY-01 | Cervix | cervical & endocervical cancer | Female | <65 | I/II | Chemotherapy | cisplatin | CR |
| HNRNPA1L2 | SNV | Missense_Mutation | rs757332292 | c.245N>A | p.Arg82Lys | p.R82K | Q32P51 | protein_coding | tolerated(0.06) | benign(0.409) | TCGA-DR-A0ZM-01 | Cervix | cervical & endocervical cancer | Female | <65 | III/IV | Unspecific | Cisplatin | SD |
| HNRNPA1L2 | SNV | Missense_Mutation | novel | c.95N>T | p.Ser32Ile | p.S32I | Q32P51 | protein_coding | deleterious(0.02) | probably_damaging(0.989) | TCGA-EK-A2RB-01 | Cervix | cervical & endocervical cancer | Female | <65 | I/II | Unknown | Unknown | SD |
| HNRNPA1L2 | SNV | Missense_Mutation | c.460G>C | p.Asp154His | p.D154H | Q32P51 | protein_coding | deleterious(0.01) | probably_damaging(0.998) | TCGA-MU-A51Y-01 | Cervix | cervical & endocervical cancer | Female | <65 | I/II | Unknown | Unknown | SD | |
| HNRNPA1L2 | SNV | Missense_Mutation | novel | c.953G>T | p.Arg318Ile | p.R318I | Q32P51 | protein_coding | deleterious(0) | benign(0.078) | TCGA-A5-A1OF-01 | Endometrium | uterine corpus endometrioid carcinoma | Female | <65 | I/II | Unknown | Unknown | SD |
| HNRNPA1L2 | SNV | Missense_Mutation | rs766473221 | c.445G>A | p.Ala149Thr | p.A149T | Q32P51 | protein_coding | deleterious(0.01) | probably_damaging(0.995) | TCGA-AJ-A5DW-01 | Endometrium | uterine corpus endometrioid carcinoma | Female | <65 | I/II | Unknown | Unknown | SD |
| HNRNPA1L2 | SNV | Missense_Mutation | novel | c.77N>A | p.Thr26Asn | p.T26N | Q32P51 | protein_coding | deleterious(0.04) | probably_damaging(0.996) | TCGA-AP-A1DK-01 | Endometrium | uterine corpus endometrioid carcinoma | Female | <65 | I/II | Unknown | Unknown | SD |
| HNRNPA1L2 | SNV | Missense_Mutation | novel | c.482N>C | p.Lys161Thr | p.K161T | Q32P51 | protein_coding | deleterious(0.02) | probably_damaging(0.975) | TCGA-AX-A1CE-01 | Endometrium | uterine corpus endometrioid carcinoma | Female | <65 | I/II | Unspecific | Paclitaxel | SD |
| HNRNPA1L2 | SNV | Missense_Mutation | rs768647313 | c.944N>A | p.Gly315Asp | p.G315D | Q32P51 | protein_coding | tolerated(0.06) | probably_damaging(0.988) | TCGA-AX-A1CE-01 | Endometrium | uterine corpus endometrioid carcinoma | Female | <65 | I/II | Unspecific | Paclitaxel | SD |
| HNRNPA1L2 | SNV | Missense_Mutation | rs758275368 | c.587N>A | p.Arg196Gln | p.R196Q | Q32P51 | protein_coding | tolerated(0.49) | benign(0.001) | TCGA-AX-A2HC-01 | Endometrium | uterine corpus endometrioid carcinoma | Female | <65 | III/IV | Chemotherapy | paclitaxel | PD |
| Page: 1 2 3 |
Top |
Related drugs of malignant transformation related genes |
| Identification of chemicals and drugs interact with genes involved in malignant transfromation |
| (DGIdb 4.0) |
| Entrez ID | Symbol | Category | Interaction Types | Drug Claim Name | Drug Name | PMIDs |
| Page: 1 |

Copyright 2023-Present -The University of Texas Health Science Center at Houston |