
|
|||||
|
 | |
| |
| |
| |
| |
| |
|
Gene: HNRNPA0 |
Gene summary for HNRNPA0 |
| Gene information | Species | Human | Gene symbol | HNRNPA0 | Gene ID | 10949 |
| Gene name | heterogeneous nuclear ribonucleoprotein A0 | |
| Gene Alias | HNRPA0 | |
| Cytomap | 5q31.2 | |
| Gene Type | protein-coding | GO ID | GO:0002237 | UniProtAcc | Q13151 |
Top |
Malignant transformation analysis |
| Identification of the aberrant gene expression in precancerous and cancerous lesions by comparing the gene expression of stem-like cells in diseased tissues with normal stem cells |
| Entrez ID | Symbol | Replicates | Species | Organ | Tissue | Adj P-value | Log2FC | Malignancy |
| 10949 | HNRNPA0 | GSM4909277 | Human | Breast | Precancer | 3.36e-04 | 3.20e-01 | 0.0177 |
| 10949 | HNRNPA0 | GSM4909282 | Human | Breast | IDC | 8.45e-08 | 2.65e-01 | -0.0288 |
| 10949 | HNRNPA0 | GSM4909286 | Human | Breast | IDC | 2.10e-04 | 1.30e-01 | 0.1081 |
| 10949 | HNRNPA0 | GSM4909290 | Human | Breast | IDC | 1.35e-03 | -3.89e-01 | 0.2096 |
| 10949 | HNRNPA0 | GSM4909294 | Human | Breast | IDC | 6.68e-06 | -2.67e-01 | 0.2022 |
| 10949 | HNRNPA0 | GSM4909296 | Human | Breast | IDC | 1.93e-20 | -4.91e-01 | 0.1524 |
| 10949 | HNRNPA0 | GSM4909297 | Human | Breast | IDC | 1.95e-21 | -1.32e-01 | 0.1517 |
| 10949 | HNRNPA0 | GSM4909301 | Human | Breast | IDC | 1.19e-04 | -2.74e-01 | 0.1577 |
| 10949 | HNRNPA0 | GSM4909302 | Human | Breast | IDC | 7.47e-05 | -3.56e-01 | 0.1545 |
| 10949 | HNRNPA0 | GSM4909304 | Human | Breast | IDC | 4.64e-05 | -3.82e-01 | 0.1636 |
| 10949 | HNRNPA0 | GSM4909308 | Human | Breast | IDC | 1.22e-04 | 2.98e-01 | 0.158 |
| 10949 | HNRNPA0 | GSM4909309 | Human | Breast | IDC | 1.17e-04 | -8.06e-02 | 0.0483 |
| 10949 | HNRNPA0 | GSM4909311 | Human | Breast | IDC | 8.20e-45 | -4.20e-01 | 0.1534 |
| 10949 | HNRNPA0 | GSM4909312 | Human | Breast | IDC | 3.19e-17 | 1.88e-01 | 0.1552 |
| 10949 | HNRNPA0 | GSM4909313 | Human | Breast | IDC | 2.44e-10 | 2.54e-01 | 0.0391 |
| 10949 | HNRNPA0 | GSM4909315 | Human | Breast | IDC | 2.44e-02 | -3.24e-01 | 0.21 |
| 10949 | HNRNPA0 | GSM4909316 | Human | Breast | IDC | 2.87e-05 | -3.54e-01 | 0.21 |
| 10949 | HNRNPA0 | GSM4909318 | Human | Breast | IDC | 4.27e-04 | 1.98e-01 | 0.2031 |
| 10949 | HNRNPA0 | GSM4909319 | Human | Breast | IDC | 5.01e-58 | -3.12e-01 | 0.1563 |
| 10949 | HNRNPA0 | GSM4909320 | Human | Breast | IDC | 1.47e-14 | -7.07e-01 | 0.1575 |
| Page: 1 2 3 4 5 6 7 8 9 10 11 12 13 14 |
| Tissue | Expression Dynamics | Abbreviation |
| Breast |  | IDC: Invasive ductal carcinoma |
| DCIS: Ductal carcinoma in situ | ||
| Precancer(BRCA1-mut): Precancerous lesion from BRCA1 mutation carriers | ||
| Colorectum (GSE201348) |  | FAP: Familial adenomatous polyposis |
| CRC: Colorectal cancer | ||
| Colorectum (HTA11) |  | AD: Adenomas |
| SER: Sessile serrated lesions | ||
| MSI-H: Microsatellite-high colorectal cancer | ||
| MSS: Microsatellite stable colorectal cancer | ||
| Endometrium |  | AEH: Atypical endometrial hyperplasia |
| EEC: Endometrioid Cancer | ||
| Esophagus | 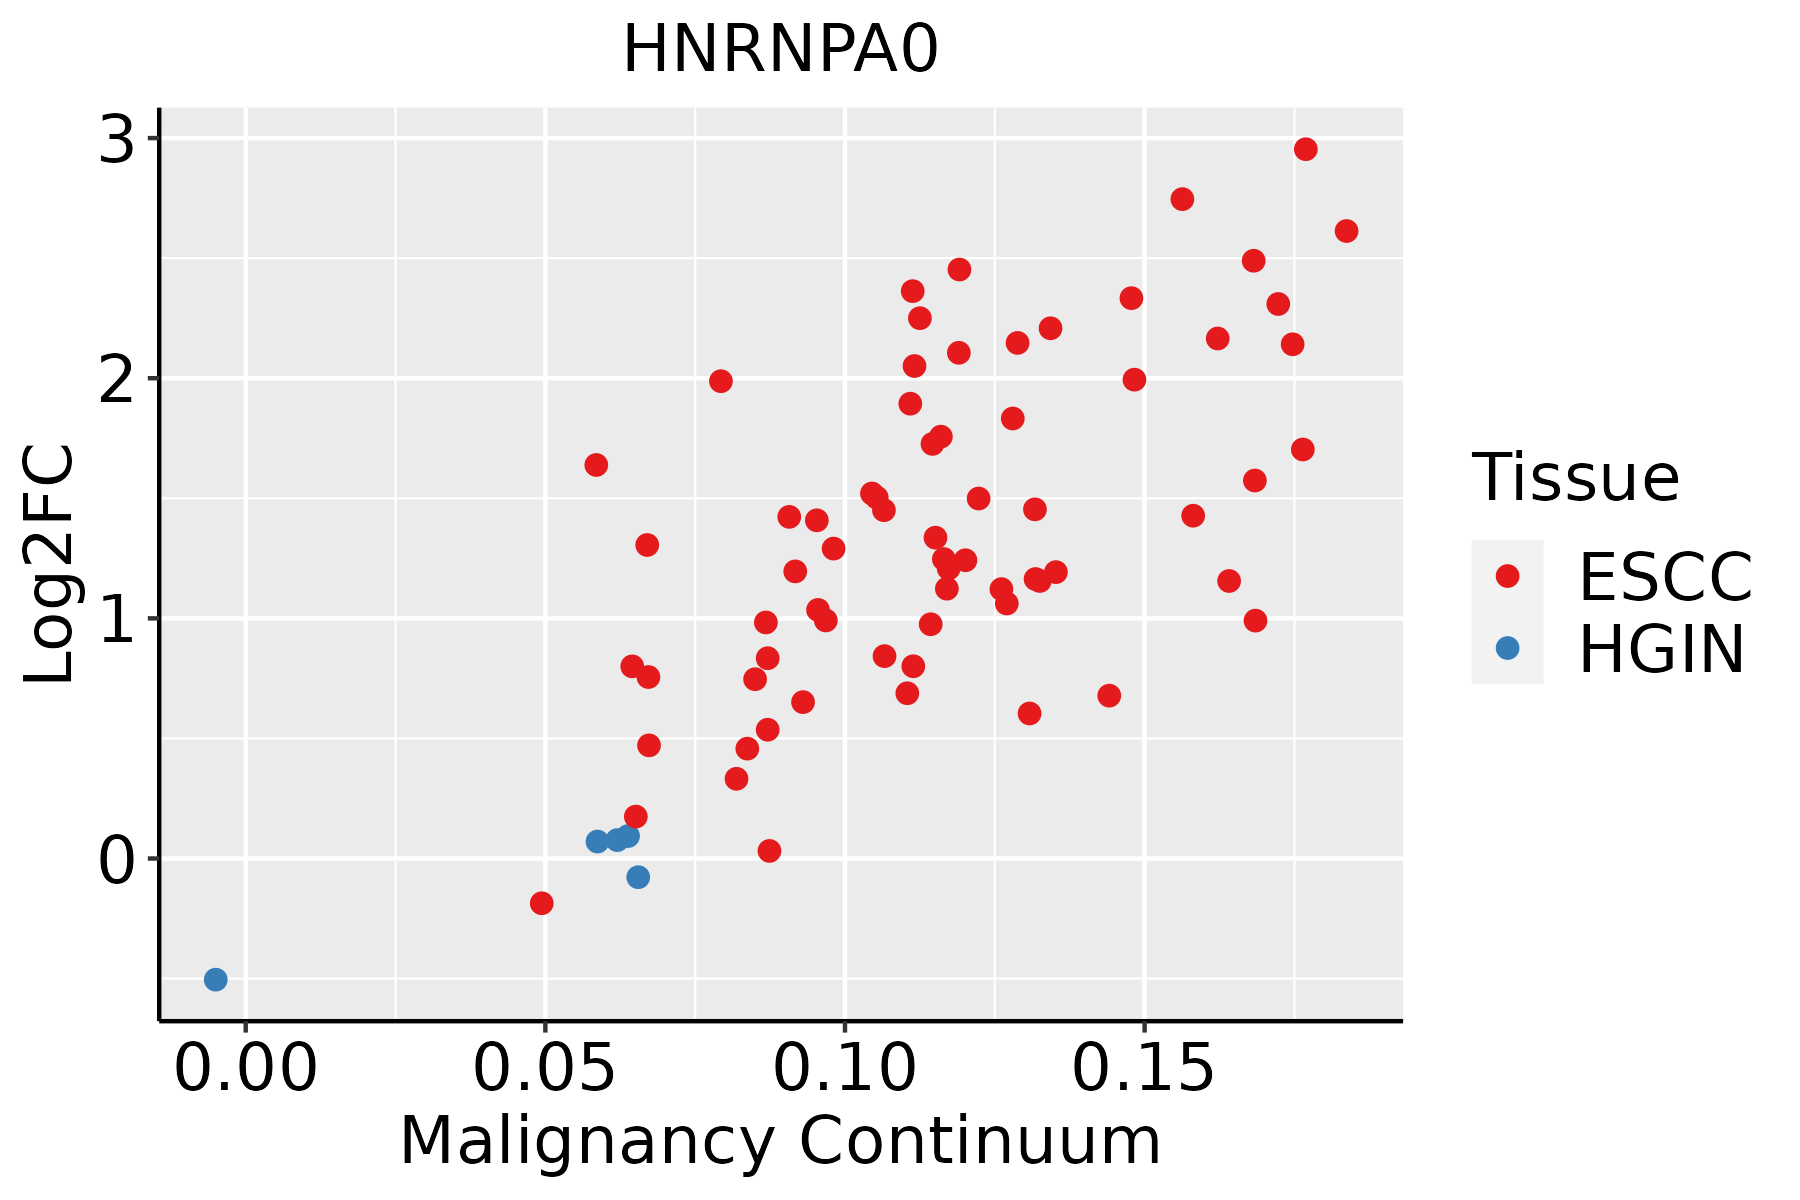 | ESCC: Esophageal squamous cell carcinoma |
| HGIN: High-grade intraepithelial neoplasias | ||
| LGIN: Low-grade intraepithelial neoplasias | ||
| Liver | 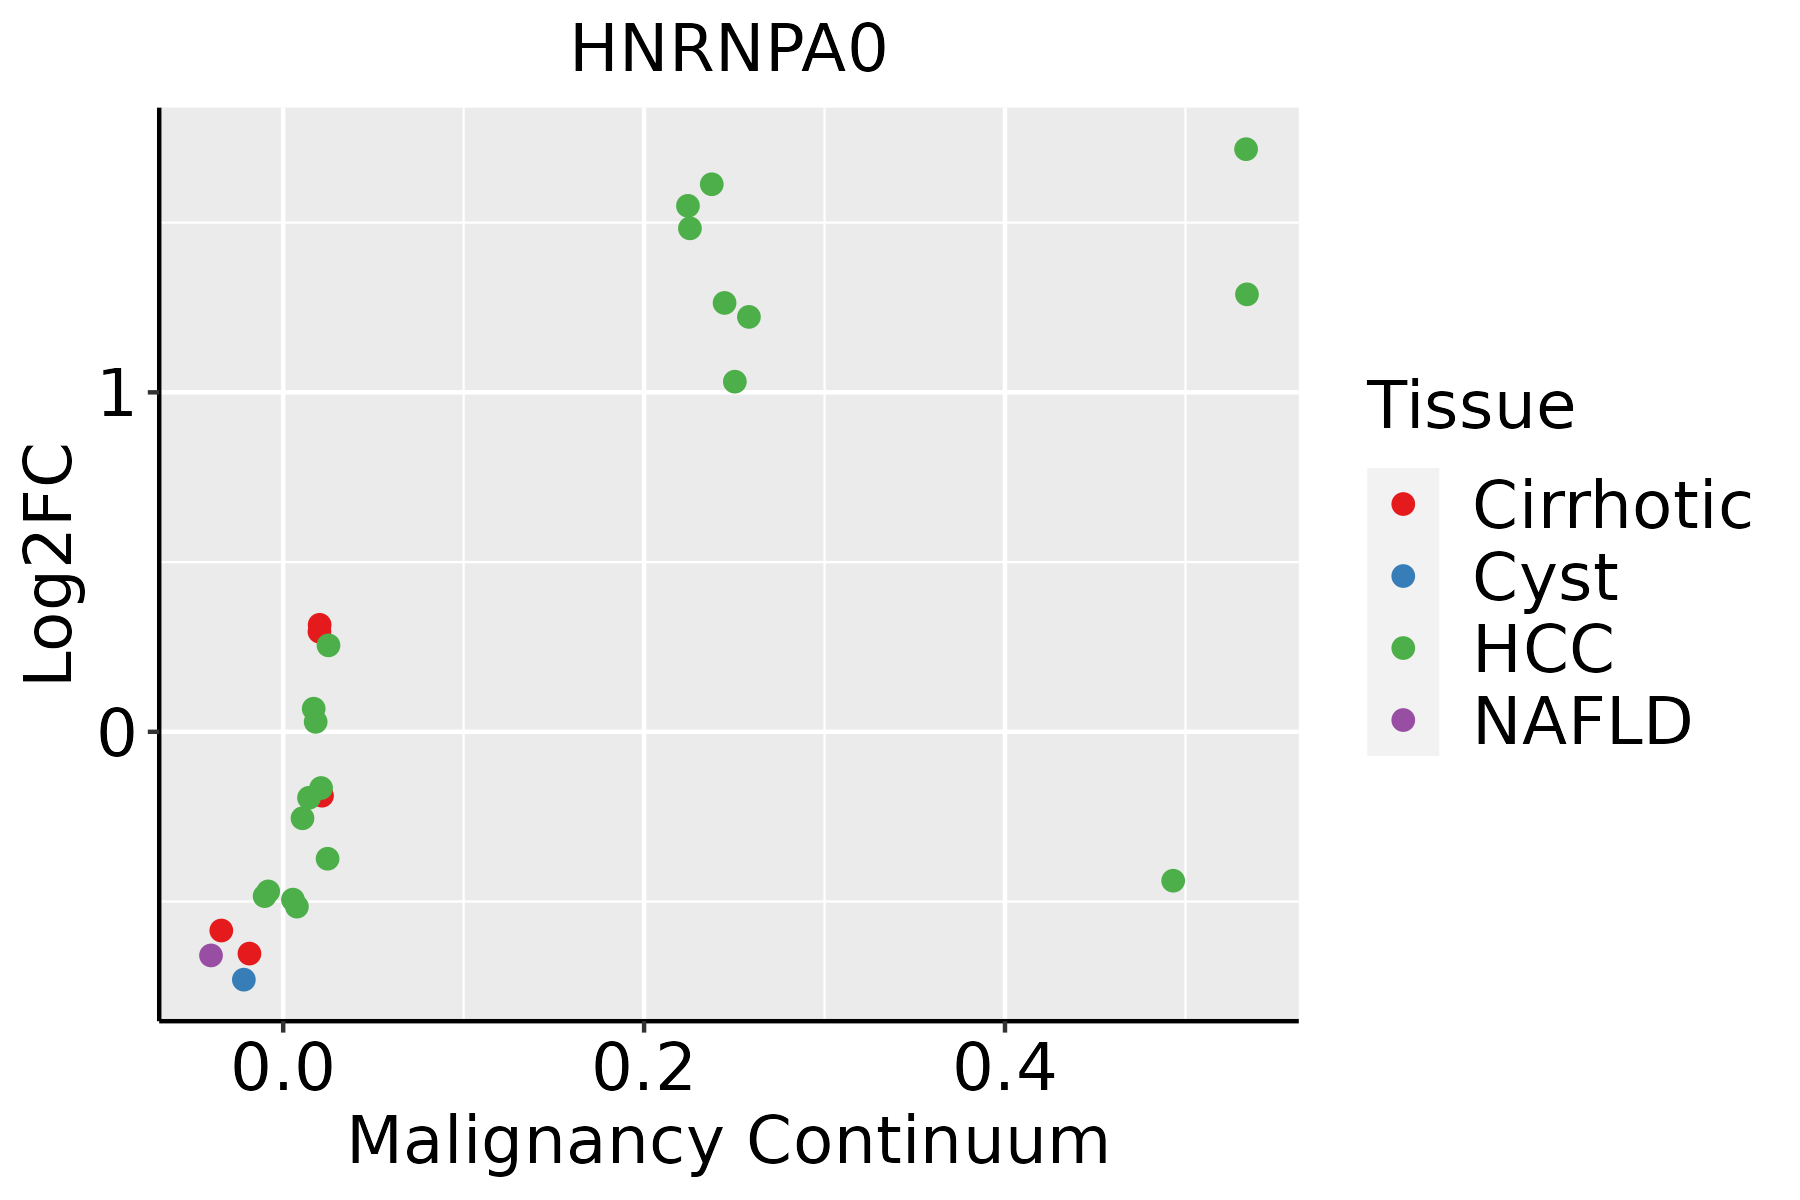 | HCC: Hepatocellular carcinoma |
| NAFLD: Non-alcoholic fatty liver disease | ||
| Oral Cavity | 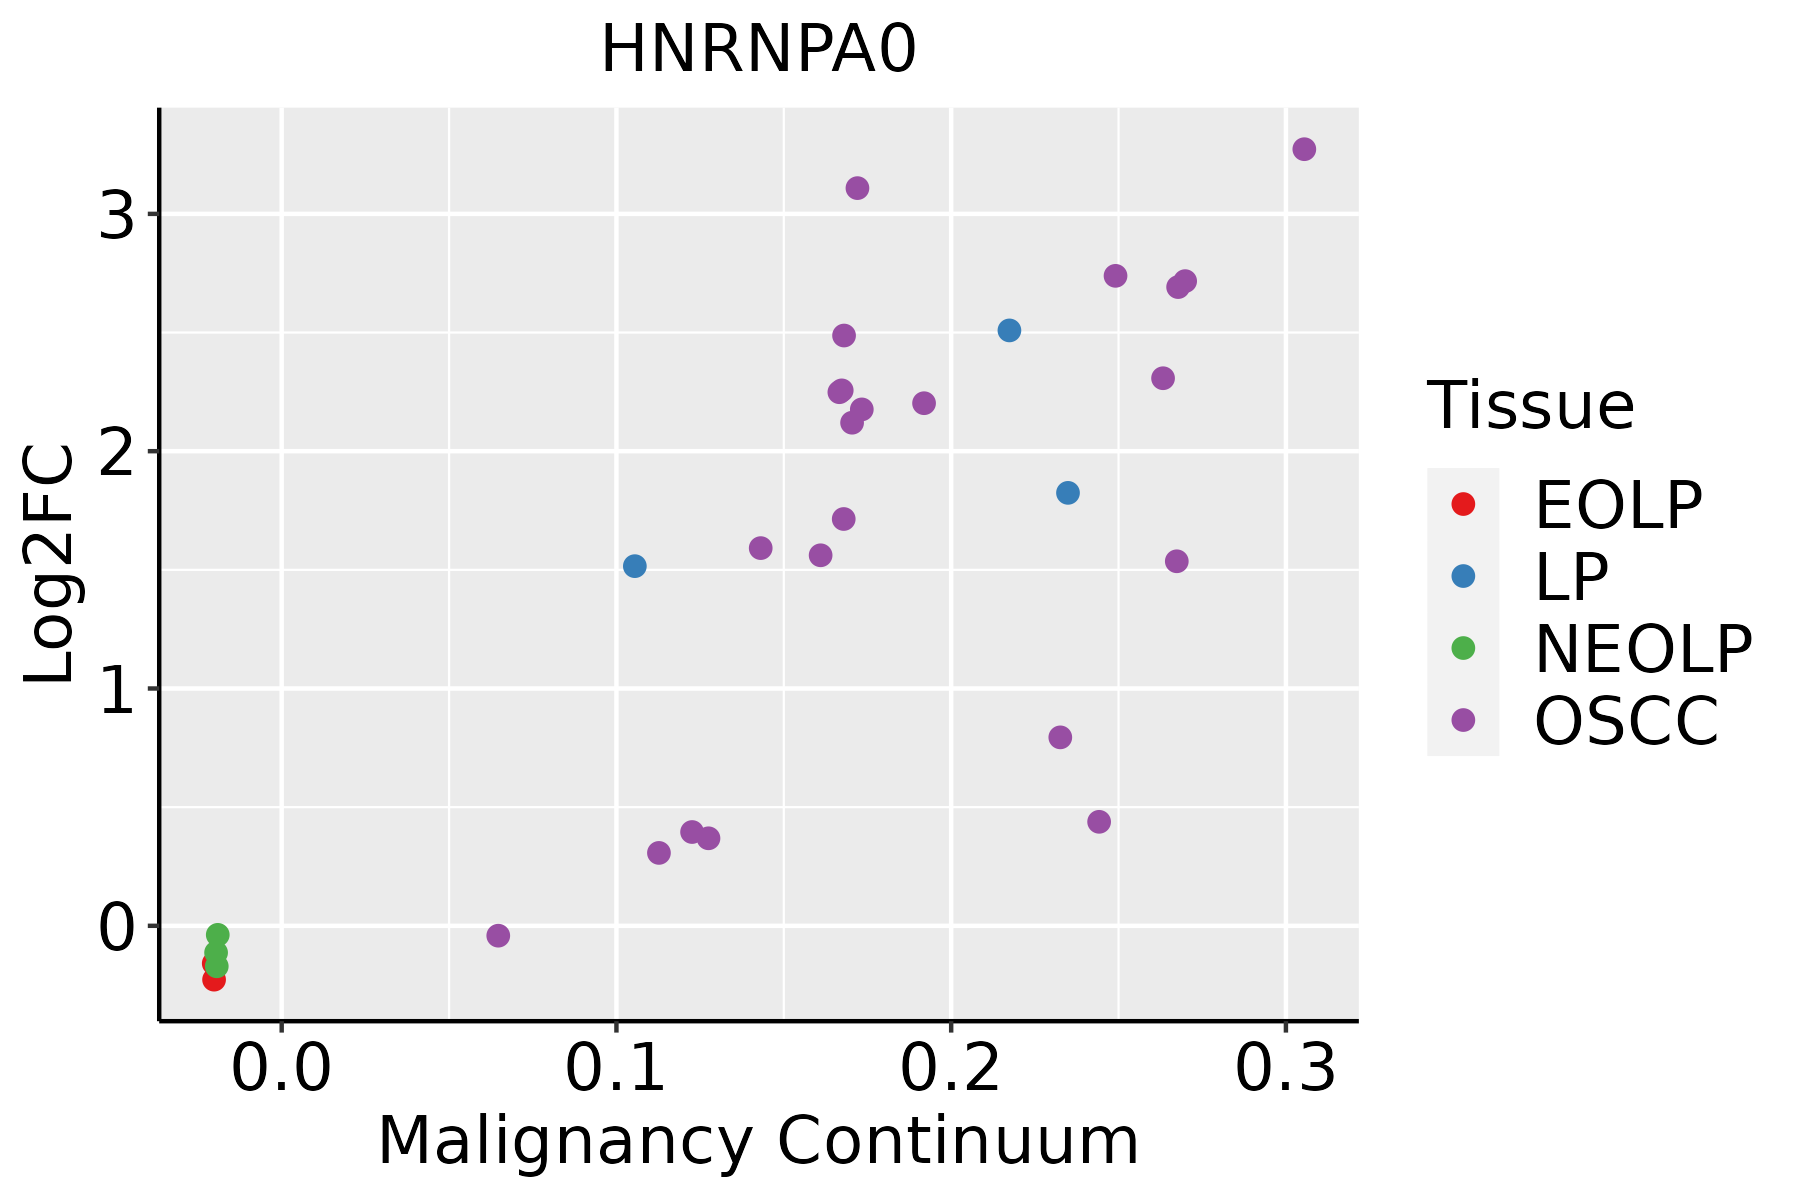 | EOLP: Erosive Oral lichen planus |
| LP: leukoplakia | ||
| NEOLP: Non-erosive oral lichen planus | ||
| OSCC: Oral squamous cell carcinoma | ||
| Prostate | 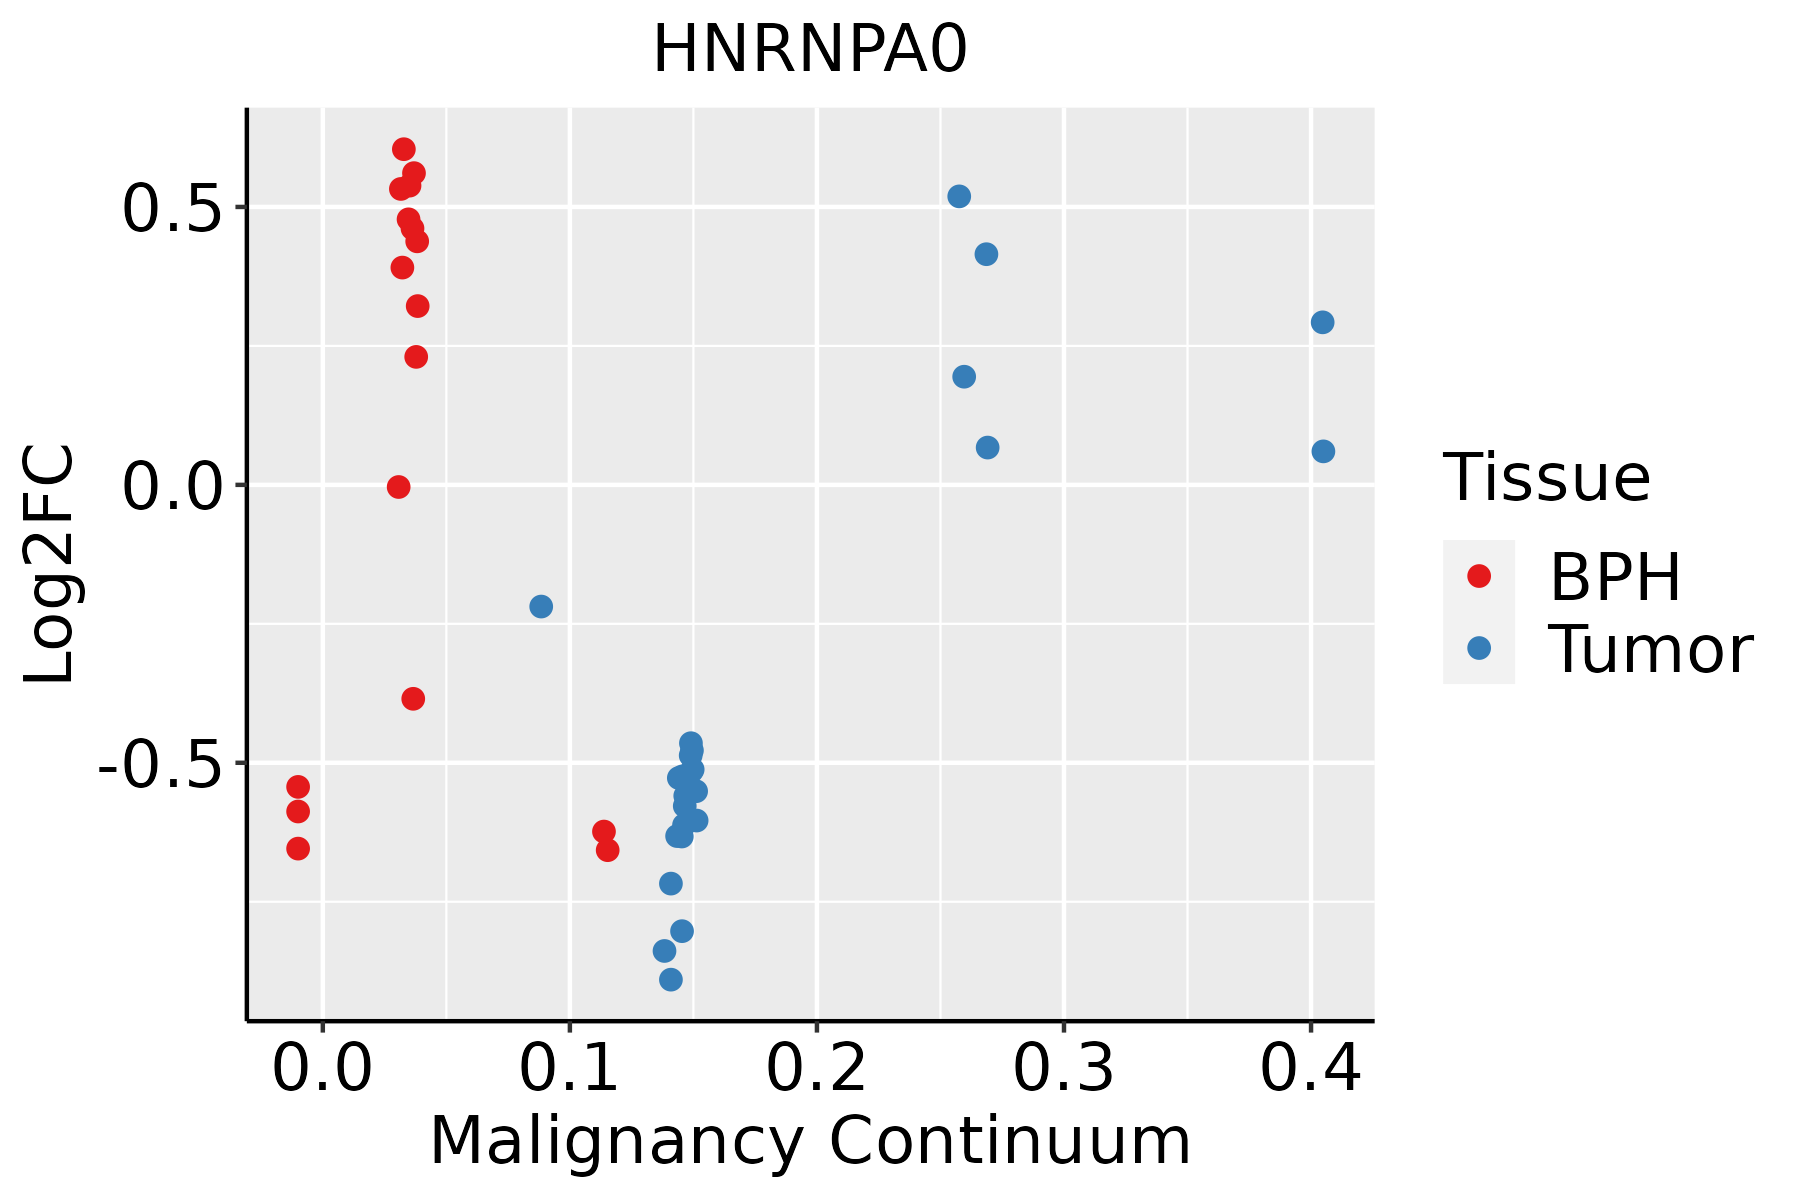 | BPH: Benign Prostatic Hyperplasia |
| Skin | 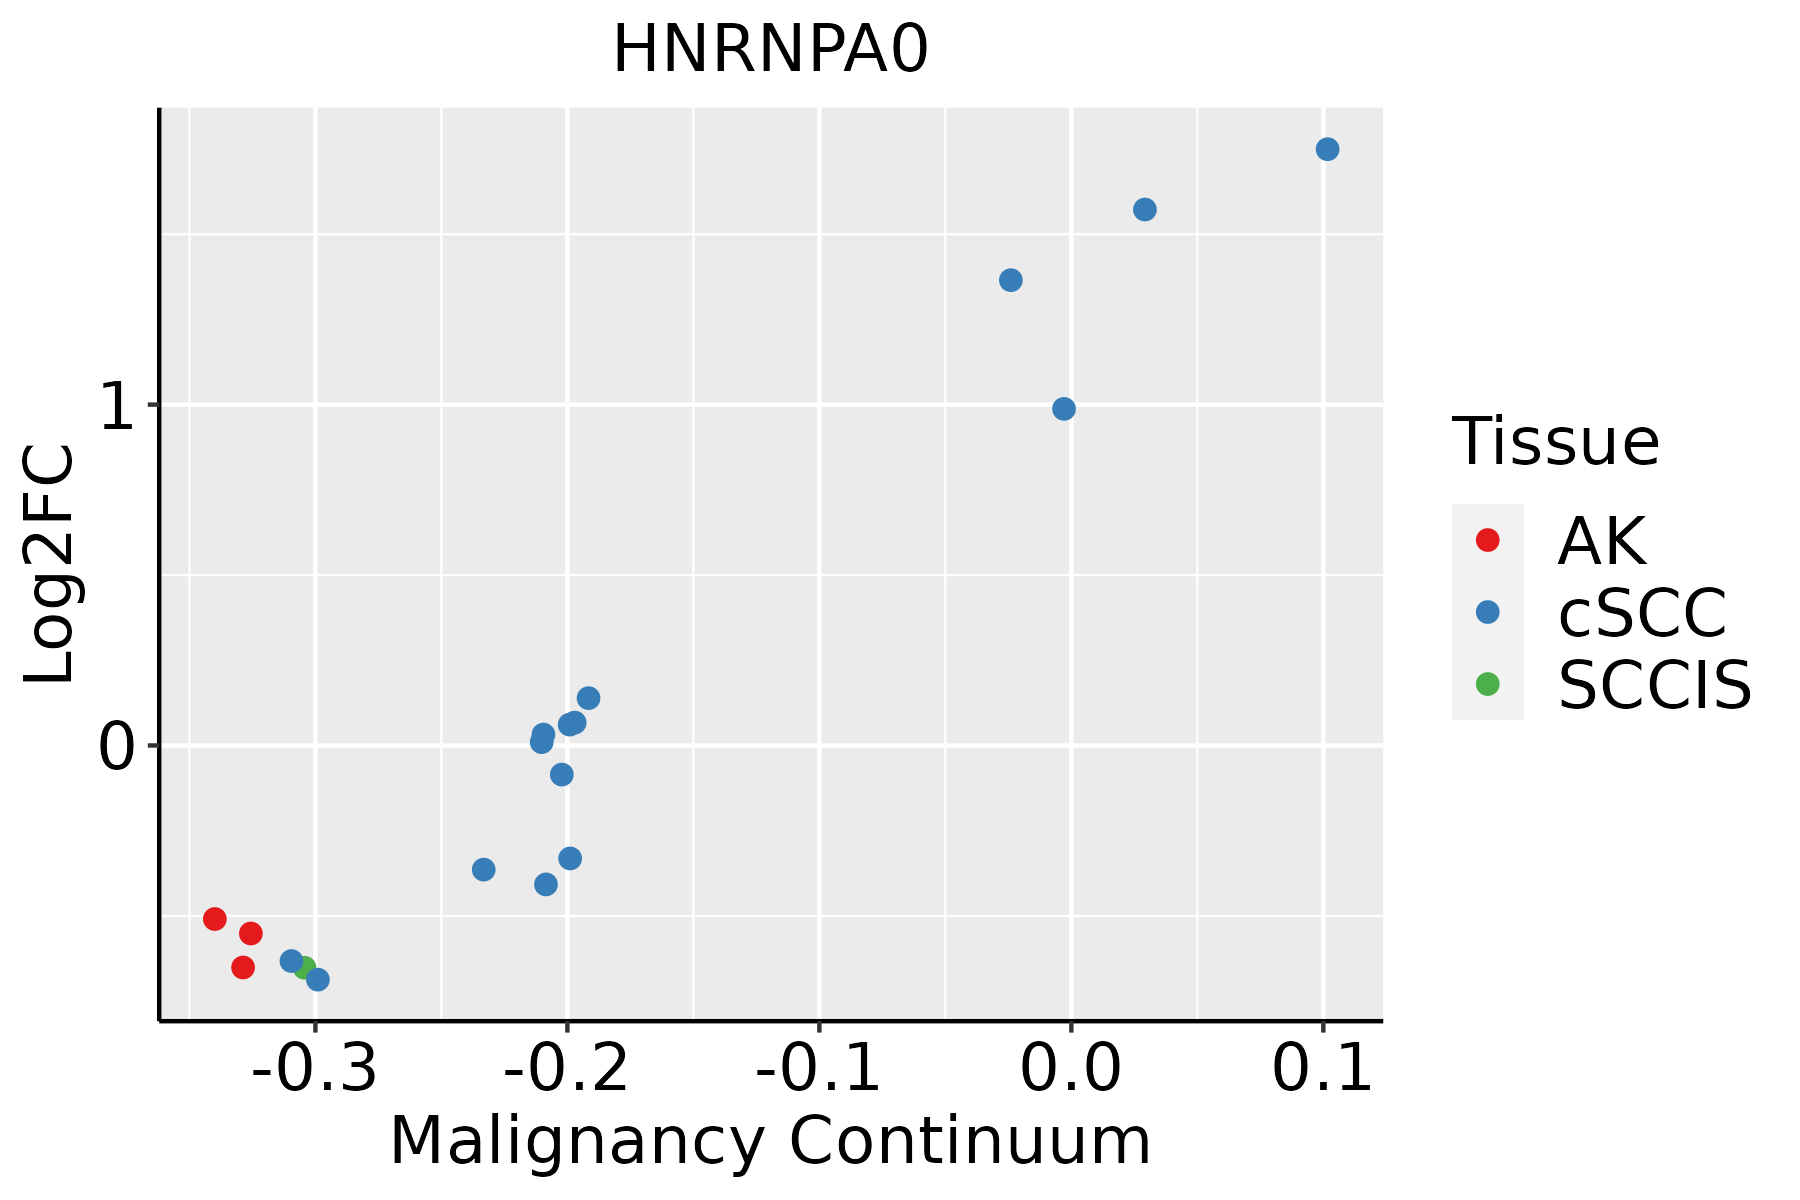 | AK: Actinic keratosis |
| cSCC: Cutaneous squamous cell carcinoma | ||
| SCCIS:squamous cell carcinoma in situ | ||
| Thyroid | 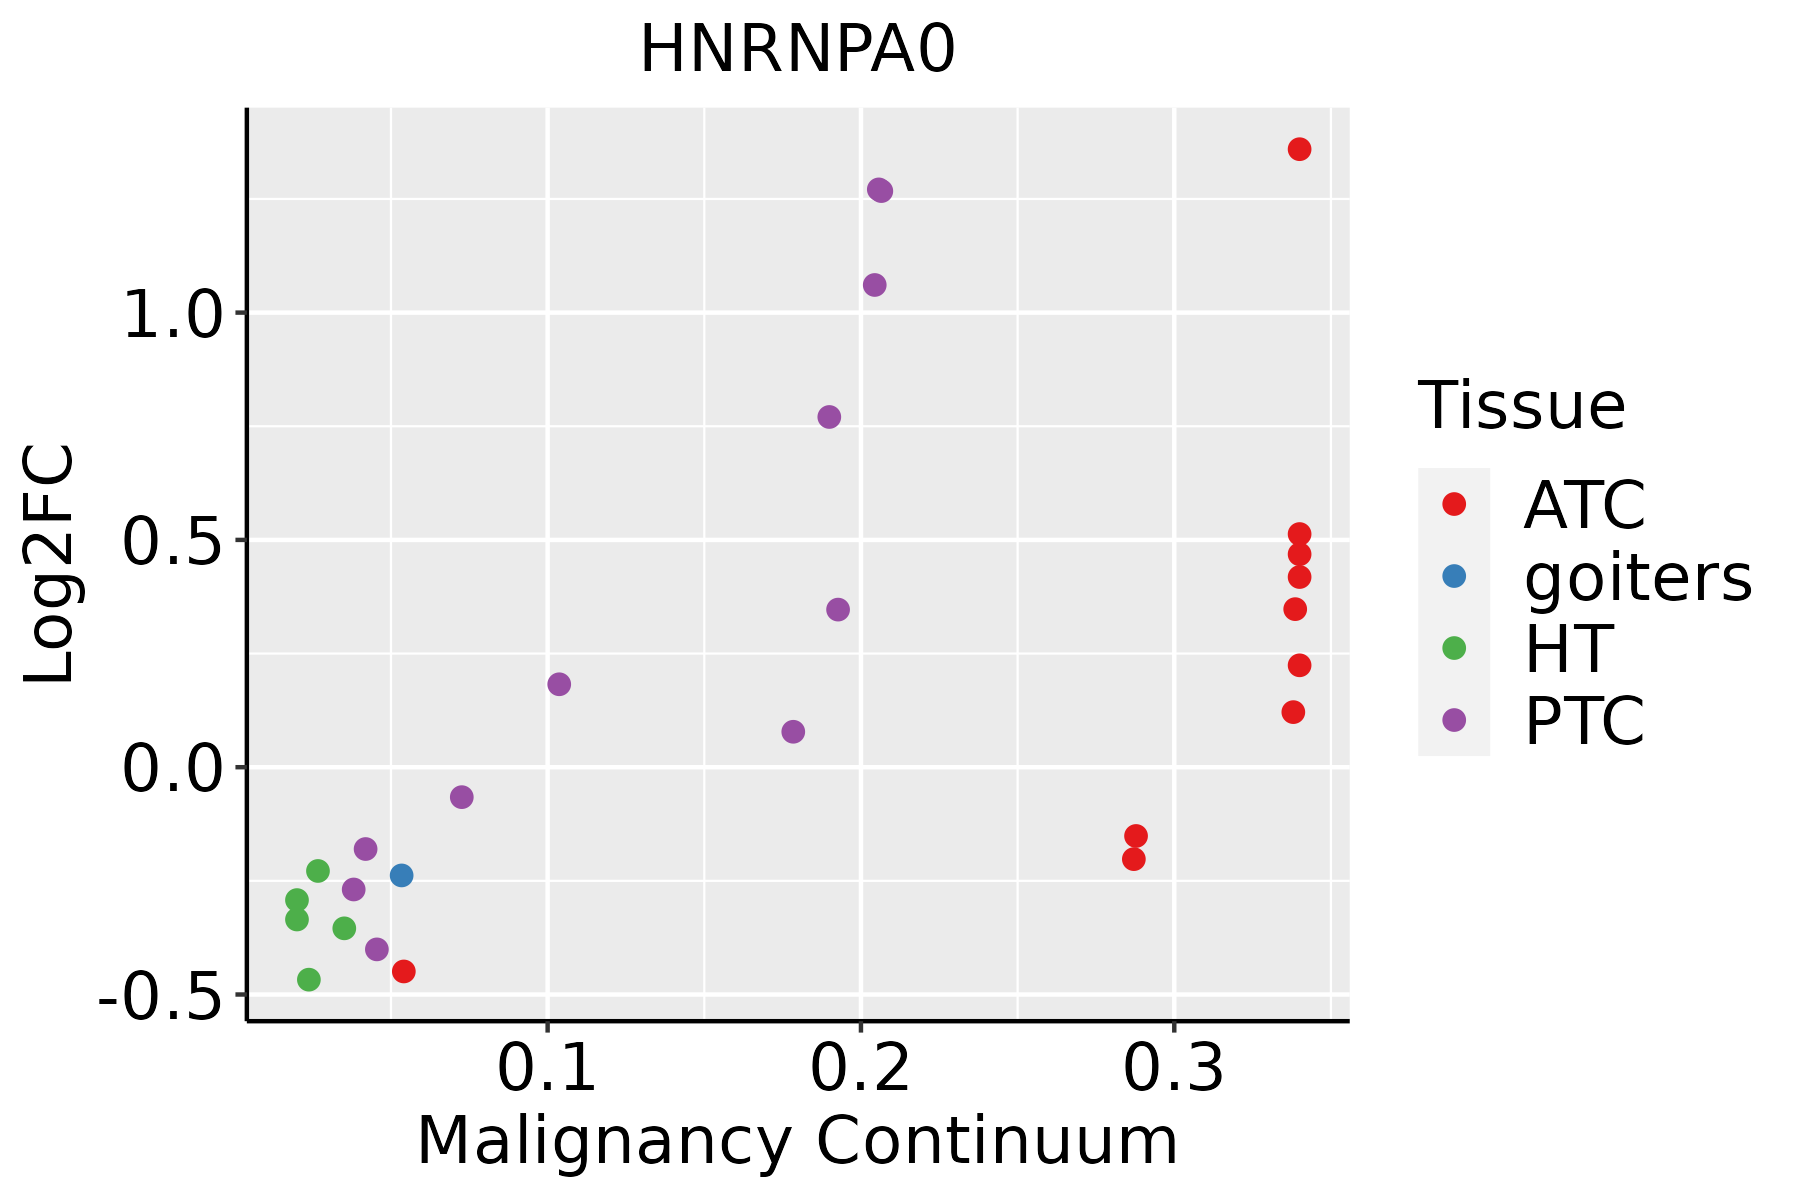 | ATC: Anaplastic thyroid cancer |
| HT: Hashimoto's thyroiditis | ||
| PTC: Papillary thyroid cancer |
| ∗log2FC in expression of this searched gene in stem-like cells from each diseased tissue sample relative to stem-like cells in normal samples in each tissue plotted against the malignancy continuum. Samples are colored based on if they are from different disease stage. |
Top |
Malignant transformation related pathway analysis |
| Find out the enriched GO biological processes and KEGG pathways involved in transition from healthy to precancer to cancer |
| Tissue | Disease Stage | Enriched GO biological Processes |
| Colorectum | AD |  |
| Colorectum | SER |  |
| Colorectum | MSS |  |
| Colorectum | MSI-H |  |
| Colorectum | FAP |  |
| ∗Top 15 enriched GO BP terms are showed in the bar plot of each disease state in each tissue. Each row represents a significant GO biological process which is colored according to the -log10(p.adjust). |
| Page: 1 2 3 4 5 6 7 8 9 |
| GO ID | Tissue | Disease Stage | Description | Gene Ratio | Bg Ratio | pvalue | p.adjust | Count |
| GO:19033118 | Breast | Precancer | regulation of mRNA metabolic process | 38/1080 | 288/18723 | 1.63e-06 | 5.97e-05 | 38 |
| GO:00022378 | Breast | Precancer | response to molecule of bacterial origin | 43/1080 | 363/18723 | 6.05e-06 | 1.72e-04 | 43 |
| GO:00324968 | Breast | Precancer | response to lipopolysaccharide | 41/1080 | 343/18723 | 7.94e-06 | 2.17e-04 | 41 |
| GO:00313309 | Breast | Precancer | negative regulation of cellular catabolic process | 34/1080 | 262/18723 | 8.16e-06 | 2.20e-04 | 34 |
| GO:00064028 | Breast | Precancer | mRNA catabolic process | 31/1080 | 232/18723 | 1.12e-05 | 2.93e-04 | 31 |
| GO:00064018 | Breast | Precancer | RNA catabolic process | 34/1080 | 278/18723 | 2.88e-05 | 6.39e-04 | 34 |
| GO:19033129 | Breast | Precancer | negative regulation of mRNA metabolic process | 16/1080 | 92/18723 | 6.70e-05 | 1.35e-03 | 16 |
| GO:00098959 | Breast | Precancer | negative regulation of catabolic process | 36/1080 | 320/18723 | 9.92e-05 | 1.83e-03 | 36 |
| GO:00346558 | Breast | Precancer | nucleobase-containing compound catabolic process | 42/1080 | 407/18723 | 1.91e-04 | 3.06e-03 | 42 |
| GO:00467007 | Breast | Precancer | heterocycle catabolic process | 44/1080 | 445/18723 | 3.49e-04 | 4.88e-03 | 44 |
| GO:00442708 | Breast | Precancer | cellular nitrogen compound catabolic process | 44/1080 | 451/18723 | 4.64e-04 | 6.12e-03 | 44 |
| GO:00194397 | Breast | Precancer | aromatic compound catabolic process | 44/1080 | 467/18723 | 9.55e-04 | 1.07e-02 | 44 |
| GO:19013617 | Breast | Precancer | organic cyclic compound catabolic process | 45/1080 | 495/18723 | 1.73e-03 | 1.74e-02 | 45 |
| GO:00434888 | Breast | Precancer | regulation of mRNA stability | 19/1080 | 158/18723 | 1.92e-03 | 1.86e-02 | 19 |
| GO:19023737 | Breast | Precancer | negative regulation of mRNA catabolic process | 10/1080 | 63/18723 | 3.07e-03 | 2.62e-02 | 10 |
| GO:00610138 | Breast | Precancer | regulation of mRNA catabolic process | 19/1080 | 166/18723 | 3.36e-03 | 2.83e-02 | 19 |
| GO:19023697 | Breast | Precancer | negative regulation of RNA catabolic process | 11/1080 | 75/18723 | 3.67e-03 | 3.02e-02 | 11 |
| GO:00434878 | Breast | Precancer | regulation of RNA stability | 19/1080 | 170/18723 | 4.38e-03 | 3.42e-02 | 19 |
| GO:00482558 | Breast | Precancer | mRNA stabilization | 9/1080 | 56/18723 | 4.47e-03 | 3.47e-02 | 9 |
| GO:003249612 | Breast | IDC | response to lipopolysaccharide | 47/1434 | 343/18723 | 7.13e-05 | 1.43e-03 | 47 |
| Page: 1 2 3 4 5 6 7 8 9 10 11 12 13 14 15 16 17 18 19 |
| Pathway ID | Tissue | Disease Stage | Description | Gene Ratio | Bg Ratio | pvalue | p.adjust | qvalue | Count |
| Page: 1 |
Top |
Cell-cell communication analysis |
| Identification of potential cell-cell interactions between two cell types and their ligand-receptor pairs for different disease states |
| Ligand | Receptor | LRpair | Pathway | Tissue | Disease Stage |
| Page: 1 |
Top |
Single-cell gene regulatory network inference analysis |
| Find out the significant the regulons (TFs) and the target genes of each regulon across cell types for different disease states |
| TF | Cell Type | Tissue | Disease Stage | Target Gene | RSS | Regulon Activity |
| ∗The dot plots of a searched regulon are shown for all cell subpopulations in each disease state of each tissue based on the regulon specific score inferred using pySCENIC and by calculating the average expression. |
| Page: 1 |
Top |
Somatic mutation of malignant transformation related genes |
| Annotation of somatic variants for genes involved in malignant transformation |
| Hugo Symbol | Variant Class | Variant Classification | dbSNP RS | HGVSc | HGVSp | HGVSp Short | SWISSPROT | BIOTYPE | SIFT | PolyPhen | Tumor Sample Barcode | Tissue | Histology | Sex | Age | Stage | Therapy Types | Drugs | Outcome |
| HNRNPA0 | SNV | Missense_Mutation | c.263C>T | p.Ser88Leu | p.S88L | Q13151 | protein_coding | deleterious(0.01) | possibly_damaging(0.474) | TCGA-C5-A7UH-01 | Cervix | cervical & endocervical cancer | Female | <65 | III/IV | Chemotherapy | cisplatin | SD | |
| HNRNPA0 | SNV | Missense_Mutation | novel | c.415C>T | p.Arg139Cys | p.R139C | Q13151 | protein_coding | deleterious(0) | probably_damaging(0.999) | TCGA-A6-6781-01 | Colorectum | colon adenocarcinoma | Male | <65 | III/IV | Chemotherapy | oxaliplatin | SD |
| HNRNPA0 | SNV | Missense_Mutation | novel | c.414N>T | p.Lys138Asn | p.K138N | Q13151 | protein_coding | deleterious(0) | probably_damaging(0.998) | TCGA-CA-6717-01 | Colorectum | colon adenocarcinoma | Male | <65 | I/II | Chemotherapy | oxaliplatin | CR |
| HNRNPA0 | SNV | Missense_Mutation | c.333N>T | p.Glu111Asp | p.E111D | Q13151 | protein_coding | deleterious(0.04) | benign(0.018) | TCGA-A5-A0G2-01 | Endometrium | uterine corpus endometrioid carcinoma | Female | <65 | III/IV | Unknown | Unknown | SD | |
| HNRNPA0 | SNV | Missense_Mutation | novel | c.411N>T | p.Lys137Asn | p.K137N | Q13151 | protein_coding | deleterious(0.01) | probably_damaging(0.984) | TCGA-AP-A1DV-01 | Endometrium | uterine corpus endometrioid carcinoma | Female | <65 | I/II | Unknown | Unknown | SD |
| HNRNPA0 | SNV | Missense_Mutation | novel | c.695N>G | p.Asn232Ser | p.N232S | Q13151 | protein_coding | tolerated(0.64) | benign(0.012) | TCGA-AX-A1CJ-01 | Endometrium | uterine corpus endometrioid carcinoma | Female | <65 | I/II | Unknown | Unknown | SD |
| HNRNPA0 | SNV | Missense_Mutation | novel | c.133A>G | p.Lys45Glu | p.K45E | Q13151 | protein_coding | deleterious(0.01) | benign(0.25) | TCGA-B5-A3FA-01 | Endometrium | uterine corpus endometrioid carcinoma | Female | >=65 | I/II | Unknown | Unknown | SD |
| HNRNPA0 | SNV | Missense_Mutation | novel | c.190N>A | p.Ala64Thr | p.A64T | Q13151 | protein_coding | deleterious(0.02) | probably_damaging(0.999) | TCGA-BS-A0VI-01 | Endometrium | uterine corpus endometrioid carcinoma | Female | <65 | I/II | Unknown | Unknown | SD |
| HNRNPA0 | SNV | Missense_Mutation | novel | c.384N>T | p.Glu128Asp | p.E128D | Q13151 | protein_coding | tolerated(0.07) | benign(0.392) | TCGA-E6-A1LX-01 | Endometrium | uterine corpus endometrioid carcinoma | Female | <65 | I/II | Unknown | Unknown | SD |
| HNRNPA0 | SNV | Missense_Mutation | c.191N>G | p.Ala64Gly | p.A64G | Q13151 | protein_coding | deleterious(0) | probably_damaging(0.993) | TCGA-86-8073-01 | Lung | lung adenocarcinoma | Male | <65 | I/II | Unknown | Unknown | SD |
| Page: 1 2 |
Top |
Related drugs of malignant transformation related genes |
| Identification of chemicals and drugs interact with genes involved in malignant transfromation |
| (DGIdb 4.0) |
| Entrez ID | Symbol | Category | Interaction Types | Drug Claim Name | Drug Name | PMIDs |
| Page: 1 |

Copyright 2023-Present -The University of Texas Health Science Center at Houston |