
|
|||||
|
 | |
| |
| |
| |
| |
| |
|
Gene: HNMT |
Gene summary for HNMT |
| Gene information | Species | Human | Gene symbol | HNMT | Gene ID | 3176 |
| Gene name | histamine N-methyltransferase | |
| Gene Alias | HMT | |
| Cytomap | 2q22.1 | |
| Gene Type | protein-coding | GO ID | GO:0001505 | UniProtAcc | P50135 |
Top |
Malignant transformation analysis |
| Identification of the aberrant gene expression in precancerous and cancerous lesions by comparing the gene expression of stem-like cells in diseased tissues with normal stem cells |
| Entrez ID | Symbol | Replicates | Species | Organ | Tissue | Adj P-value | Log2FC | Malignancy |
| 3176 | HNMT | NAFLD1 | Human | Liver | NAFLD | 7.04e-03 | 2.53e-01 | -0.04 |
| 3176 | HNMT | S43 | Human | Liver | Cirrhotic | 3.94e-26 | -6.32e-01 | -0.0187 |
| 3176 | HNMT | HCC1_Meng | Human | Liver | HCC | 7.46e-69 | -5.38e-02 | 0.0246 |
| 3176 | HNMT | HCC2_Meng | Human | Liver | HCC | 1.70e-35 | -1.46e-01 | 0.0107 |
| 3176 | HNMT | cirrhotic1 | Human | Liver | Cirrhotic | 4.05e-18 | 2.55e-01 | 0.0202 |
| 3176 | HNMT | cirrhotic2 | Human | Liver | Cirrhotic | 7.79e-18 | 2.84e-01 | 0.0201 |
| 3176 | HNMT | cirrhotic3 | Human | Liver | Cirrhotic | 9.37e-11 | -2.73e-01 | 0.0215 |
| 3176 | HNMT | p6 | Human | Liver | Cyst | 9.24e-06 | -8.10e-01 | -0.0218 |
| 3176 | HNMT | HCC1 | Human | Liver | HCC | 3.28e-10 | 3.08e+00 | 0.5336 |
| 3176 | HNMT | HCC2 | Human | Liver | HCC | 1.38e-06 | 3.56e+00 | 0.5341 |
| 3176 | HNMT | HCC5 | Human | Liver | HCC | 5.48e-11 | 1.08e+00 | 0.4932 |
| 3176 | HNMT | Pt13.b | Human | Liver | HCC | 1.02e-22 | -1.98e-01 | 0.0251 |
| 3176 | HNMT | Pt14.b | Human | Liver | HCC | 1.04e-06 | -1.11e-01 | 0.018 |
| 3176 | HNMT | S028 | Human | Liver | HCC | 2.93e-03 | 5.40e-01 | 0.2503 |
| 3176 | HNMT | S029 | Human | Liver | HCC | 8.67e-05 | 6.41e-01 | 0.2581 |
| 3176 | HNMT | male-WTA | Human | Thyroid | PTC | 4.45e-08 | 2.07e-02 | 0.1037 |
| 3176 | HNMT | PTC01 | Human | Thyroid | PTC | 2.26e-07 | 6.49e-02 | 0.1899 |
| 3176 | HNMT | PTC05 | Human | Thyroid | PTC | 1.39e-08 | 3.22e-01 | 0.2065 |
| 3176 | HNMT | PTC07 | Human | Thyroid | PTC | 6.35e-13 | 1.39e-01 | 0.2044 |
| 3176 | HNMT | ATC12 | Human | Thyroid | ATC | 3.66e-06 | 1.43e-01 | 0.34 |
| Page: 1 2 |
| Tissue | Expression Dynamics | Abbreviation |
| Liver | 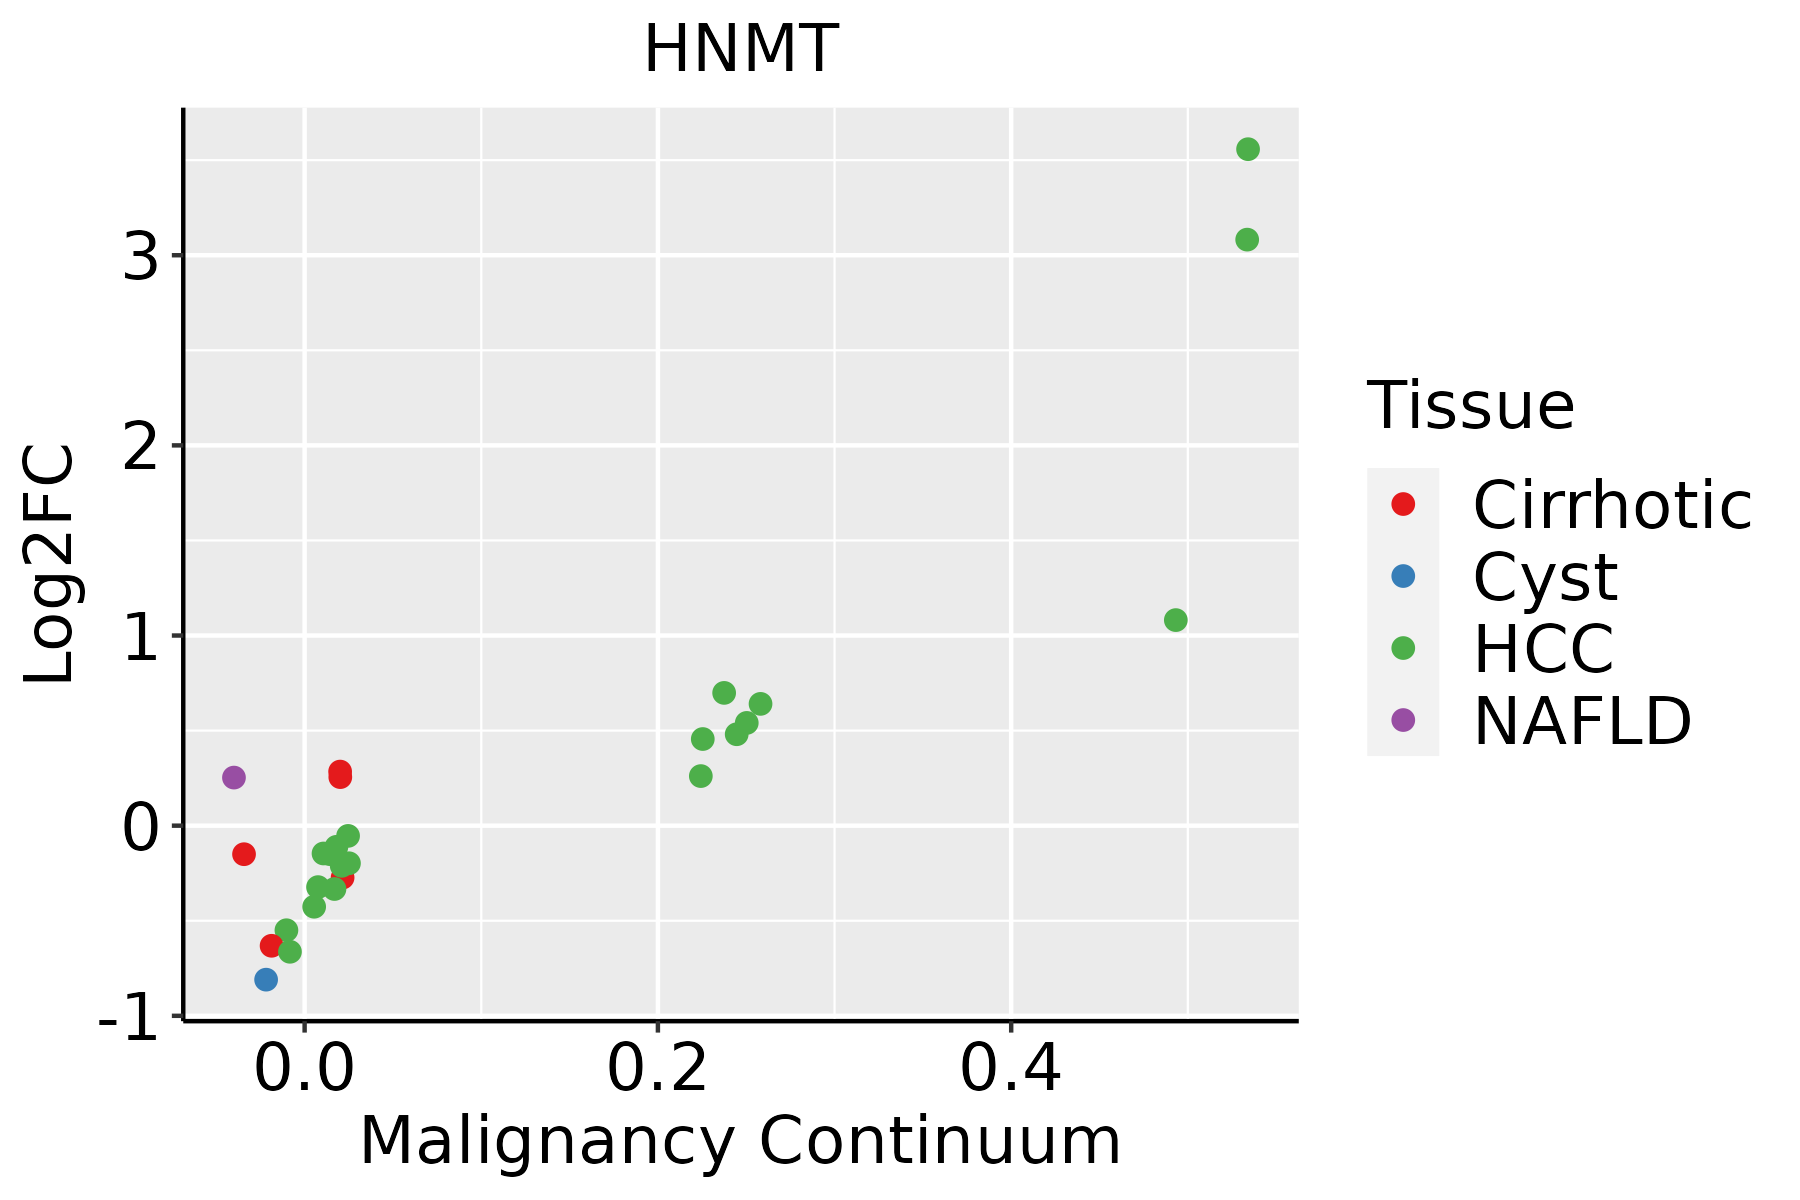 | HCC: Hepatocellular carcinoma |
| NAFLD: Non-alcoholic fatty liver disease | ||
| Thyroid | 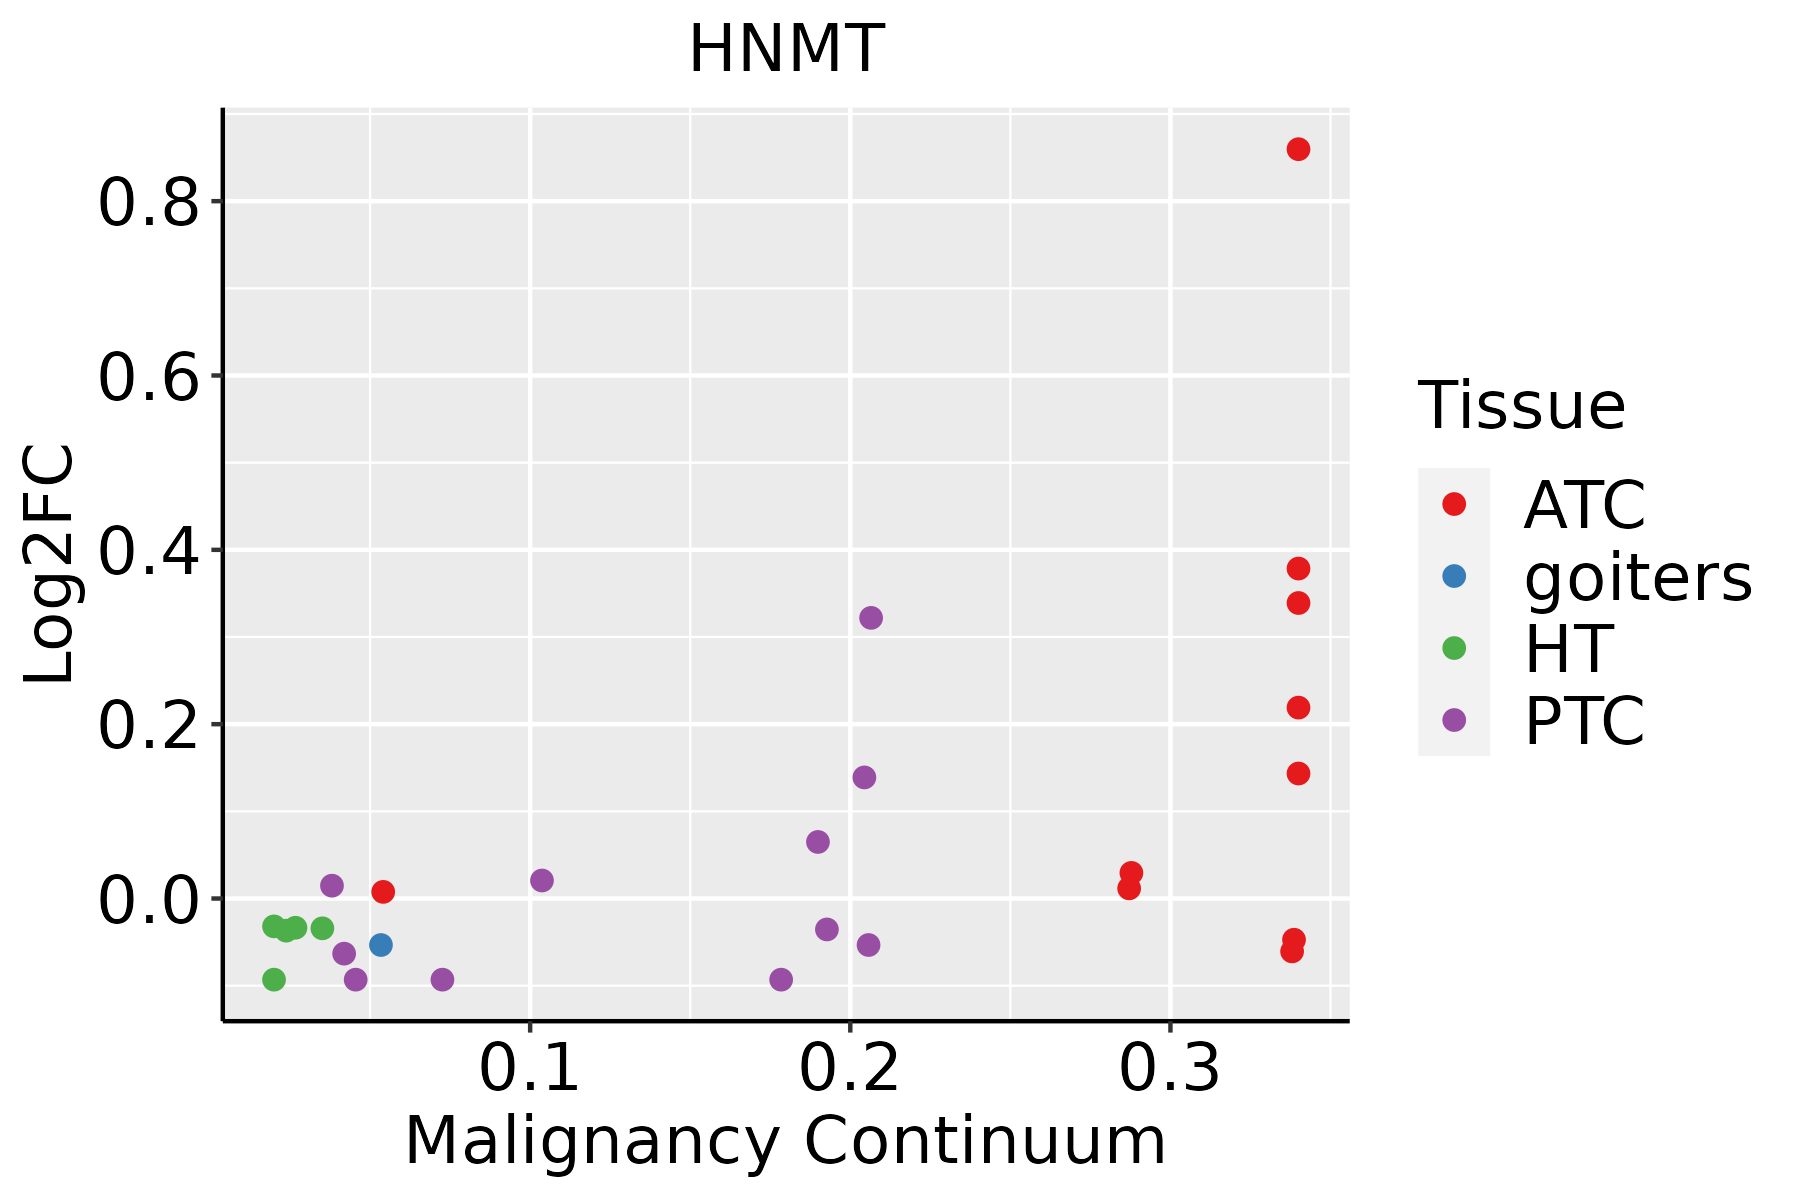 | ATC: Anaplastic thyroid cancer |
| HT: Hashimoto's thyroiditis | ||
| PTC: Papillary thyroid cancer |
| ∗log2FC in expression of this searched gene in stem-like cells from each diseased tissue sample relative to stem-like cells in normal samples in each tissue plotted against the malignancy continuum. Samples are colored based on if they are from different disease stage. |
Top |
Malignant transformation related pathway analysis |
| Find out the enriched GO biological processes and KEGG pathways involved in transition from healthy to precancer to cancer |
| Tissue | Disease Stage | Enriched GO biological Processes |
| Colorectum | AD |  |
| Colorectum | SER |  |
| Colorectum | MSS |  |
| Colorectum | MSI-H |  |
| Colorectum | FAP |  |
| ∗Top 15 enriched GO BP terms are showed in the bar plot of each disease state in each tissue. Each row represents a significant GO biological process which is colored according to the -log10(p.adjust). |
| Page: 1 2 3 4 5 6 7 8 9 |
| GO ID | Tissue | Disease Stage | Description | Gene Ratio | Bg Ratio | pvalue | p.adjust | Count |
| GO:00463953 | Liver | NAFLD | carboxylic acid catabolic process | 73/1882 | 236/18723 | 4.16e-19 | 1.22e-15 | 73 |
| GO:00160544 | Liver | NAFLD | organic acid catabolic process | 73/1882 | 240/18723 | 1.20e-18 | 2.34e-15 | 73 |
| GO:00442825 | Liver | NAFLD | small molecule catabolic process | 91/1882 | 376/18723 | 8.96e-16 | 1.31e-12 | 91 |
| GO:00194396 | Liver | NAFLD | aromatic compound catabolic process | 102/1882 | 467/18723 | 2.29e-14 | 1.91e-11 | 102 |
| GO:19013616 | Liver | NAFLD | organic cyclic compound catabolic process | 105/1882 | 495/18723 | 7.04e-14 | 5.15e-11 | 105 |
| GO:00442707 | Liver | NAFLD | cellular nitrogen compound catabolic process | 93/1882 | 451/18723 | 1.04e-11 | 4.34e-09 | 93 |
| GO:00467006 | Liver | NAFLD | heterocycle catabolic process | 92/1882 | 445/18723 | 1.16e-11 | 4.52e-09 | 92 |
| GO:00485457 | Liver | NAFLD | response to steroid hormone | 75/1882 | 339/18723 | 3.44e-11 | 1.12e-08 | 75 |
| GO:0009063 | Liver | NAFLD | cellular amino acid catabolic process | 36/1882 | 110/18723 | 6.56e-11 | 1.99e-08 | 36 |
| GO:00065203 | Liver | NAFLD | cellular amino acid metabolic process | 63/1882 | 284/18723 | 1.14e-09 | 2.17e-07 | 63 |
| GO:00513846 | Liver | NAFLD | response to glucocorticoid | 36/1882 | 148/18723 | 3.88e-07 | 2.52e-05 | 36 |
| GO:00319606 | Liver | NAFLD | response to corticosteroid | 37/1882 | 167/18723 | 3.03e-06 | 1.23e-04 | 37 |
| GO:00069703 | Liver | NAFLD | response to osmotic stress | 20/1882 | 84/18723 | 1.95e-04 | 3.41e-03 | 20 |
| GO:0009310 | Liver | NAFLD | amine catabolic process | 9/1882 | 29/18723 | 1.59e-03 | 1.71e-02 | 9 |
| GO:0042220 | Liver | NAFLD | response to cocaine | 13/1882 | 55/18723 | 2.64e-03 | 2.42e-02 | 13 |
| GO:0042402 | Liver | NAFLD | cellular biogenic amine catabolic process | 8/1882 | 27/18723 | 3.97e-03 | 3.34e-02 | 8 |
| GO:190136111 | Liver | Cirrhotic | organic cyclic compound catabolic process | 213/4634 | 495/18723 | 1.58e-19 | 3.67e-17 | 213 |
| GO:001943911 | Liver | Cirrhotic | aromatic compound catabolic process | 202/4634 | 467/18723 | 6.93e-19 | 1.28e-16 | 202 |
| GO:004427011 | Liver | Cirrhotic | cellular nitrogen compound catabolic process | 195/4634 | 451/18723 | 2.99e-18 | 4.94e-16 | 195 |
| GO:004670011 | Liver | Cirrhotic | heterocycle catabolic process | 192/4634 | 445/18723 | 7.17e-18 | 1.12e-15 | 192 |
| Page: 1 2 3 4 |
| Pathway ID | Tissue | Disease Stage | Description | Gene Ratio | Bg Ratio | pvalue | p.adjust | qvalue | Count |
| Page: 1 |
Top |
Cell-cell communication analysis |
| Identification of potential cell-cell interactions between two cell types and their ligand-receptor pairs for different disease states |
| Ligand | Receptor | LRpair | Pathway | Tissue | Disease Stage |
| Page: 1 |
Top |
Single-cell gene regulatory network inference analysis |
| Find out the significant the regulons (TFs) and the target genes of each regulon across cell types for different disease states |
| TF | Cell Type | Tissue | Disease Stage | Target Gene | RSS | Regulon Activity |
| ∗The dot plots of a searched regulon are shown for all cell subpopulations in each disease state of each tissue based on the regulon specific score inferred using pySCENIC and by calculating the average expression. |
| Page: 1 |
Top |
Somatic mutation of malignant transformation related genes |
| Annotation of somatic variants for genes involved in malignant transformation |
| Hugo Symbol | Variant Class | Variant Classification | dbSNP RS | HGVSc | HGVSp | HGVSp Short | SWISSPROT | BIOTYPE | SIFT | PolyPhen | Tumor Sample Barcode | Tissue | Histology | Sex | Age | Stage | Therapy Types | Drugs | Outcome |
| HNMT | SNV | Missense_Mutation | c.82N>A | p.Glu28Lys | p.E28K | P50135 | protein_coding | deleterious(0) | probably_damaging(1) | TCGA-BH-A0HF-01 | Breast | breast invasive carcinoma | Female | >=65 | I/II | Hormone Therapy | arimidex | SD | |
| HNMT | SNV | Missense_Mutation | rs141349661 | c.497N>T | p.Ala166Val | p.A166V | P50135 | protein_coding | deleterious(0) | benign(0.06) | TCGA-BH-A0HF-01 | Breast | breast invasive carcinoma | Female | >=65 | I/II | Hormone Therapy | arimidex | SD |
| HNMT | SNV | Missense_Mutation | c.423N>A | p.Met141Ile | p.M141I | P50135 | protein_coding | deleterious(0) | possibly_damaging(0.86) | TCGA-AA-3814-01 | Colorectum | colon adenocarcinoma | Female | >=65 | I/II | Unknown | Unknown | SD | |
| HNMT | SNV | Missense_Mutation | c.471N>A | p.Phe157Leu | p.F157L | P50135 | protein_coding | tolerated(0.06) | probably_damaging(0.978) | TCGA-AA-A010-01 | Colorectum | colon adenocarcinoma | Female | <65 | I/II | Chemotherapy | folinic | CR | |
| HNMT | SNV | Missense_Mutation | c.590A>G | p.Gln197Arg | p.Q197R | P50135 | protein_coding | tolerated(0.34) | benign(0.031) | TCGA-AD-6964-01 | Colorectum | colon adenocarcinoma | Male | <65 | III/IV | Chemotherapy | folfox | PD | |
| HNMT | SNV | Missense_Mutation | c.577N>T | p.Asp193Tyr | p.D193Y | P50135 | protein_coding | tolerated(0.08) | possibly_damaging(0.867) | TCGA-AZ-4615-01 | Colorectum | colon adenocarcinoma | Male | >=65 | III/IV | Chemotherapy | xeloda | PD | |
| HNMT | insertion | Frame_Shift_Ins | novel | c.570_571insC | p.Gln192ProfsTer3 | p.Q192Pfs*3 | P50135 | protein_coding | TCGA-A6-6653-01 | Colorectum | colon adenocarcinoma | Male | >=65 | I/II | Unknown | Unknown | SD | ||
| HNMT | SNV | Missense_Mutation | novel | c.657N>G | p.Asp219Glu | p.D219E | P50135 | protein_coding | tolerated(1) | benign(0) | TCGA-A5-A0G2-01 | Endometrium | uterine corpus endometrioid carcinoma | Female | <65 | III/IV | Unknown | Unknown | SD |
| HNMT | SNV | Missense_Mutation | novel | c.784N>A | p.Leu262Ile | p.L262I | P50135 | protein_coding | tolerated(1) | benign(0) | TCGA-A5-A0G2-01 | Endometrium | uterine corpus endometrioid carcinoma | Female | <65 | III/IV | Unknown | Unknown | SD |
| HNMT | SNV | Missense_Mutation | novel | c.358N>C | p.Ser120Pro | p.S120P | P50135 | protein_coding | deleterious(0.02) | probably_damaging(0.987) | TCGA-A5-A2K7-01 | Endometrium | uterine corpus endometrioid carcinoma | Female | <65 | I/II | Chemotherapy | taxol | SD |
| Page: 1 2 3 4 |
Top |
Related drugs of malignant transformation related genes |
| Identification of chemicals and drugs interact with genes involved in malignant transfromation |
| (DGIdb 4.0) |
| Entrez ID | Symbol | Category | Interaction Types | Drug Claim Name | Drug Name | PMIDs |
| 3176 | HNMT | ENZYME, DRUGGABLE GENOME | Amodiaquine | AMODIAQUINE | ||
| 3176 | HNMT | ENZYME, DRUGGABLE GENOME | DABIGATRAN | DABIGATRAN | 22494098 | |
| 3176 | HNMT | ENZYME, DRUGGABLE GENOME | Metoprine | METOPRINE | ||
| 3176 | HNMT | ENZYME, DRUGGABLE GENOME | anthracyclines and related substances | 23441093,21900104 | ||
| 3176 | HNMT | ENZYME, DRUGGABLE GENOME | aspirin | ASPIRIN | 19178400 | |
| 3176 | HNMT | ENZYME, DRUGGABLE GENOME | Diphenhydramine | DIPHENHYDRAMINE |
| Page: 1 |

Copyright 2023-Present -The University of Texas Health Science Center at Houston |