
|
|||||
|
 | |
| |
| |
| |
| |
| |
|
Gene: HNF4G |
Gene summary for HNF4G |
| Gene information | Species | Human | Gene symbol | HNF4G | Gene ID | 3174 |
| Gene name | hepatocyte nuclear factor 4 gamma | |
| Gene Alias | NR2A2 | |
| Cytomap | 8q21.13 | |
| Gene Type | protein-coding | GO ID | GO:0006139 | UniProtAcc | Q14541 |
Top |
Malignant transformation analysis |
| Identification of the aberrant gene expression in precancerous and cancerous lesions by comparing the gene expression of stem-like cells in diseased tissues with normal stem cells |
| Entrez ID | Symbol | Replicates | Species | Organ | Tissue | Adj P-value | Log2FC | Malignancy |
| 3174 | HNF4G | HTA11_3410_2000001011 | Human | Colorectum | AD | 4.64e-42 | -8.82e-01 | 0.0155 |
| 3174 | HNF4G | HTA11_2951_2000001011 | Human | Colorectum | AD | 3.09e-02 | -6.84e-01 | 0.0216 |
| 3174 | HNF4G | HTA11_347_2000001011 | Human | Colorectum | AD | 3.61e-08 | 6.08e-01 | -0.1954 |
| 3174 | HNF4G | HTA11_3361_2000001011 | Human | Colorectum | AD | 2.04e-12 | -7.00e-01 | -0.1207 |
| 3174 | HNF4G | HTA11_5212_2000001011 | Human | Colorectum | AD | 9.34e-03 | -4.38e-01 | -0.2061 |
| 3174 | HNF4G | HTA11_7862_2000001011 | Human | Colorectum | AD | 8.65e-04 | -5.52e-01 | -0.0179 |
| 3174 | HNF4G | HTA11_866_3004761011 | Human | Colorectum | AD | 5.51e-25 | -6.74e-01 | 0.096 |
| 3174 | HNF4G | HTA11_9408_2000001011 | Human | Colorectum | AD | 6.08e-03 | -8.41e-01 | 0.0451 |
| 3174 | HNF4G | HTA11_8622_2000001021 | Human | Colorectum | SER | 4.03e-06 | -6.37e-01 | 0.0528 |
| 3174 | HNF4G | HTA11_10711_2000001011 | Human | Colorectum | AD | 1.57e-08 | -5.60e-01 | 0.0338 |
| 3174 | HNF4G | HTA11_7696_3000711011 | Human | Colorectum | AD | 5.17e-10 | -5.38e-01 | 0.0674 |
| 3174 | HNF4G | HTA11_6818_2000001021 | Human | Colorectum | AD | 3.40e-09 | -6.43e-01 | 0.0588 |
| 3174 | HNF4G | HTA11_99999970781_79442 | Human | Colorectum | MSS | 7.50e-36 | -8.50e-01 | 0.294 |
| 3174 | HNF4G | HTA11_99999971662_82457 | Human | Colorectum | MSS | 8.53e-05 | -4.10e-01 | 0.3859 |
| 3174 | HNF4G | HTA11_99999973899_84307 | Human | Colorectum | MSS | 5.21e-16 | -8.85e-01 | 0.2585 |
| 3174 | HNF4G | HTA11_99999974143_84620 | Human | Colorectum | MSS | 1.03e-28 | -7.22e-01 | 0.3005 |
| 3174 | HNF4G | F007 | Human | Colorectum | FAP | 2.33e-07 | -5.07e-01 | 0.1176 |
| 3174 | HNF4G | A001-C-207 | Human | Colorectum | FAP | 3.36e-14 | -6.05e-01 | 0.1278 |
| 3174 | HNF4G | A015-C-203 | Human | Colorectum | FAP | 3.82e-45 | -9.18e-01 | -0.1294 |
| 3174 | HNF4G | A015-C-204 | Human | Colorectum | FAP | 1.24e-20 | -7.38e-01 | -0.0228 |
| Page: 1 2 3 4 |
| Tissue | Expression Dynamics | Abbreviation |
| Colorectum (GSE201348) | 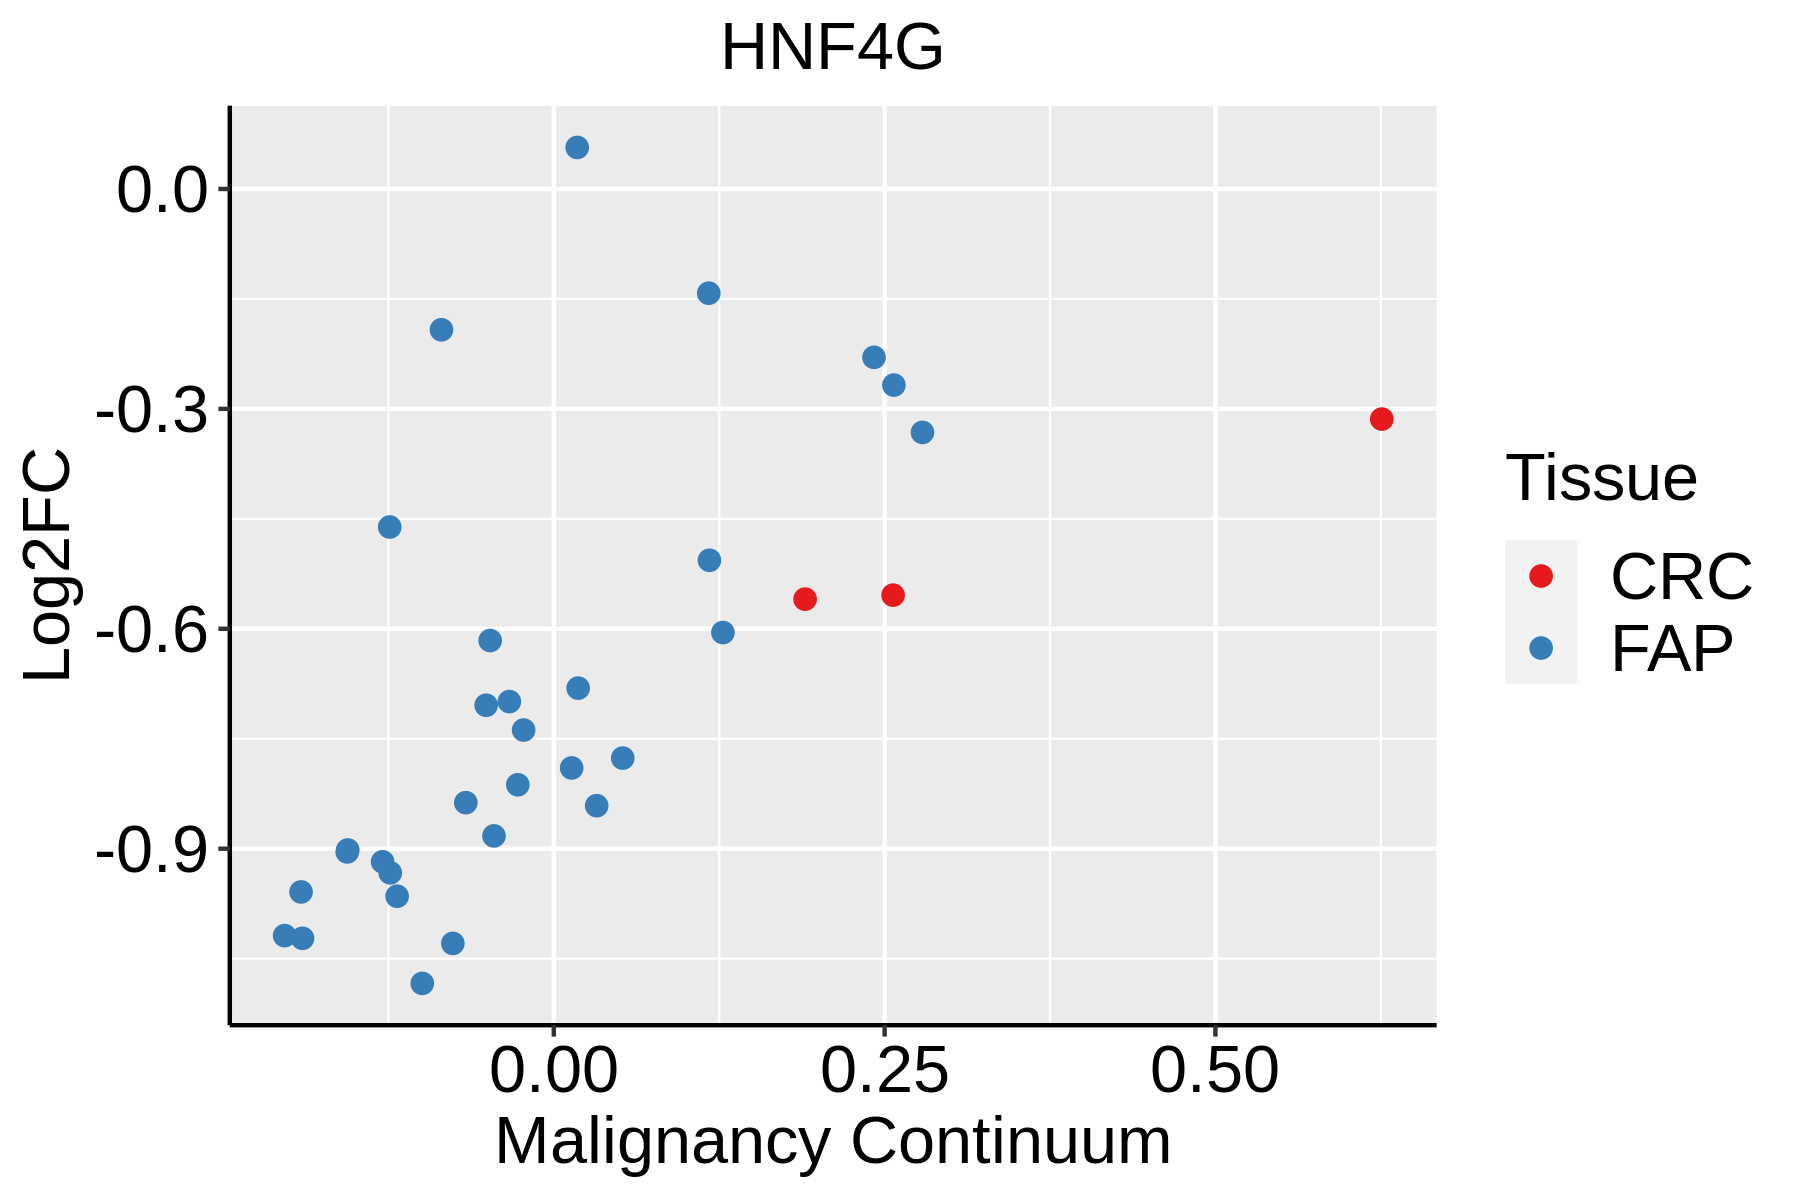 | FAP: Familial adenomatous polyposis |
| CRC: Colorectal cancer | ||
| Colorectum (HTA11) |  | AD: Adenomas |
| SER: Sessile serrated lesions | ||
| MSI-H: Microsatellite-high colorectal cancer | ||
| MSS: Microsatellite stable colorectal cancer | ||
| GC | 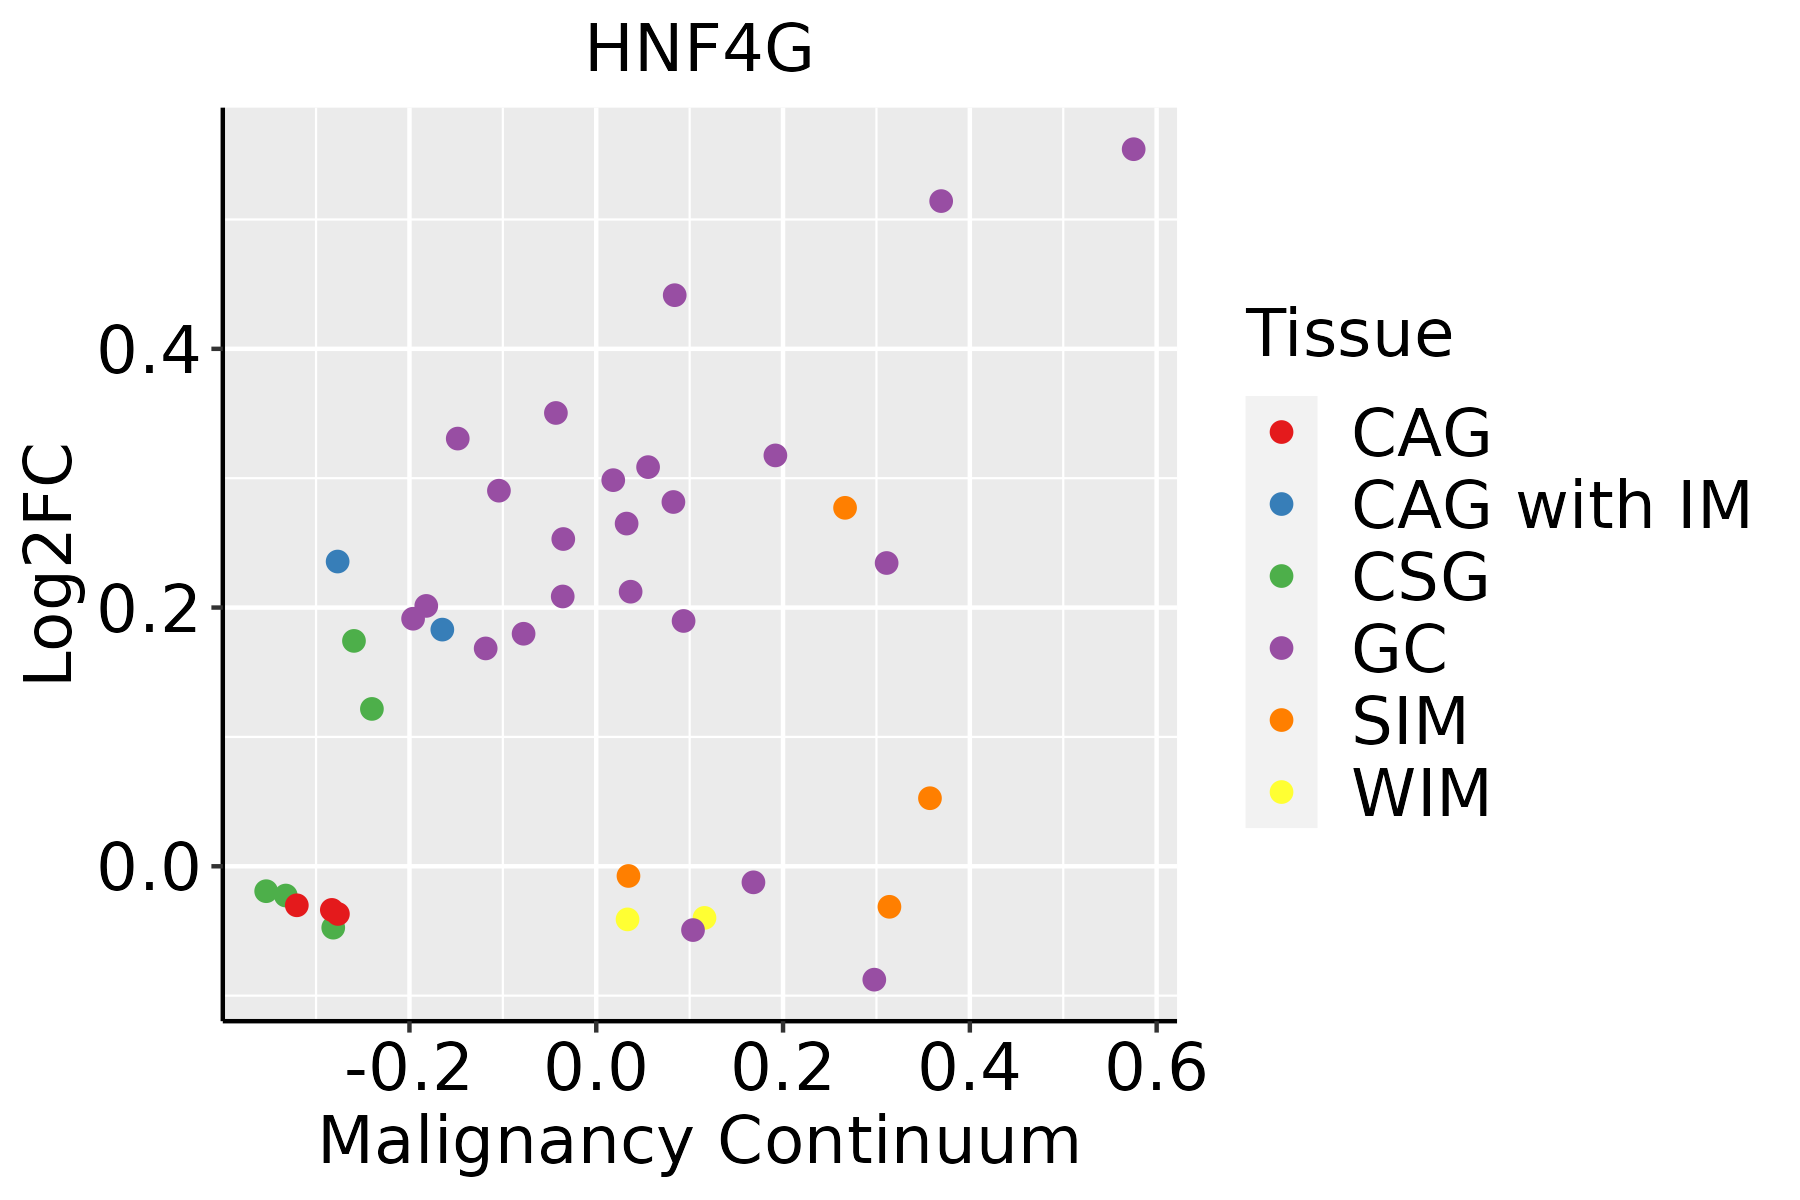 | CAG: Chronic atrophic gastritis |
| CAG with IM: Chronic atrophic gastritis with intestinal metaplasia | ||
| CSG: Chronic superficial gastritis | ||
| GC: Gastric cancer | ||
| SIM: Severe intestinal metaplasia | ||
| WIM: Wild intestinal metaplasia | ||
| Liver | 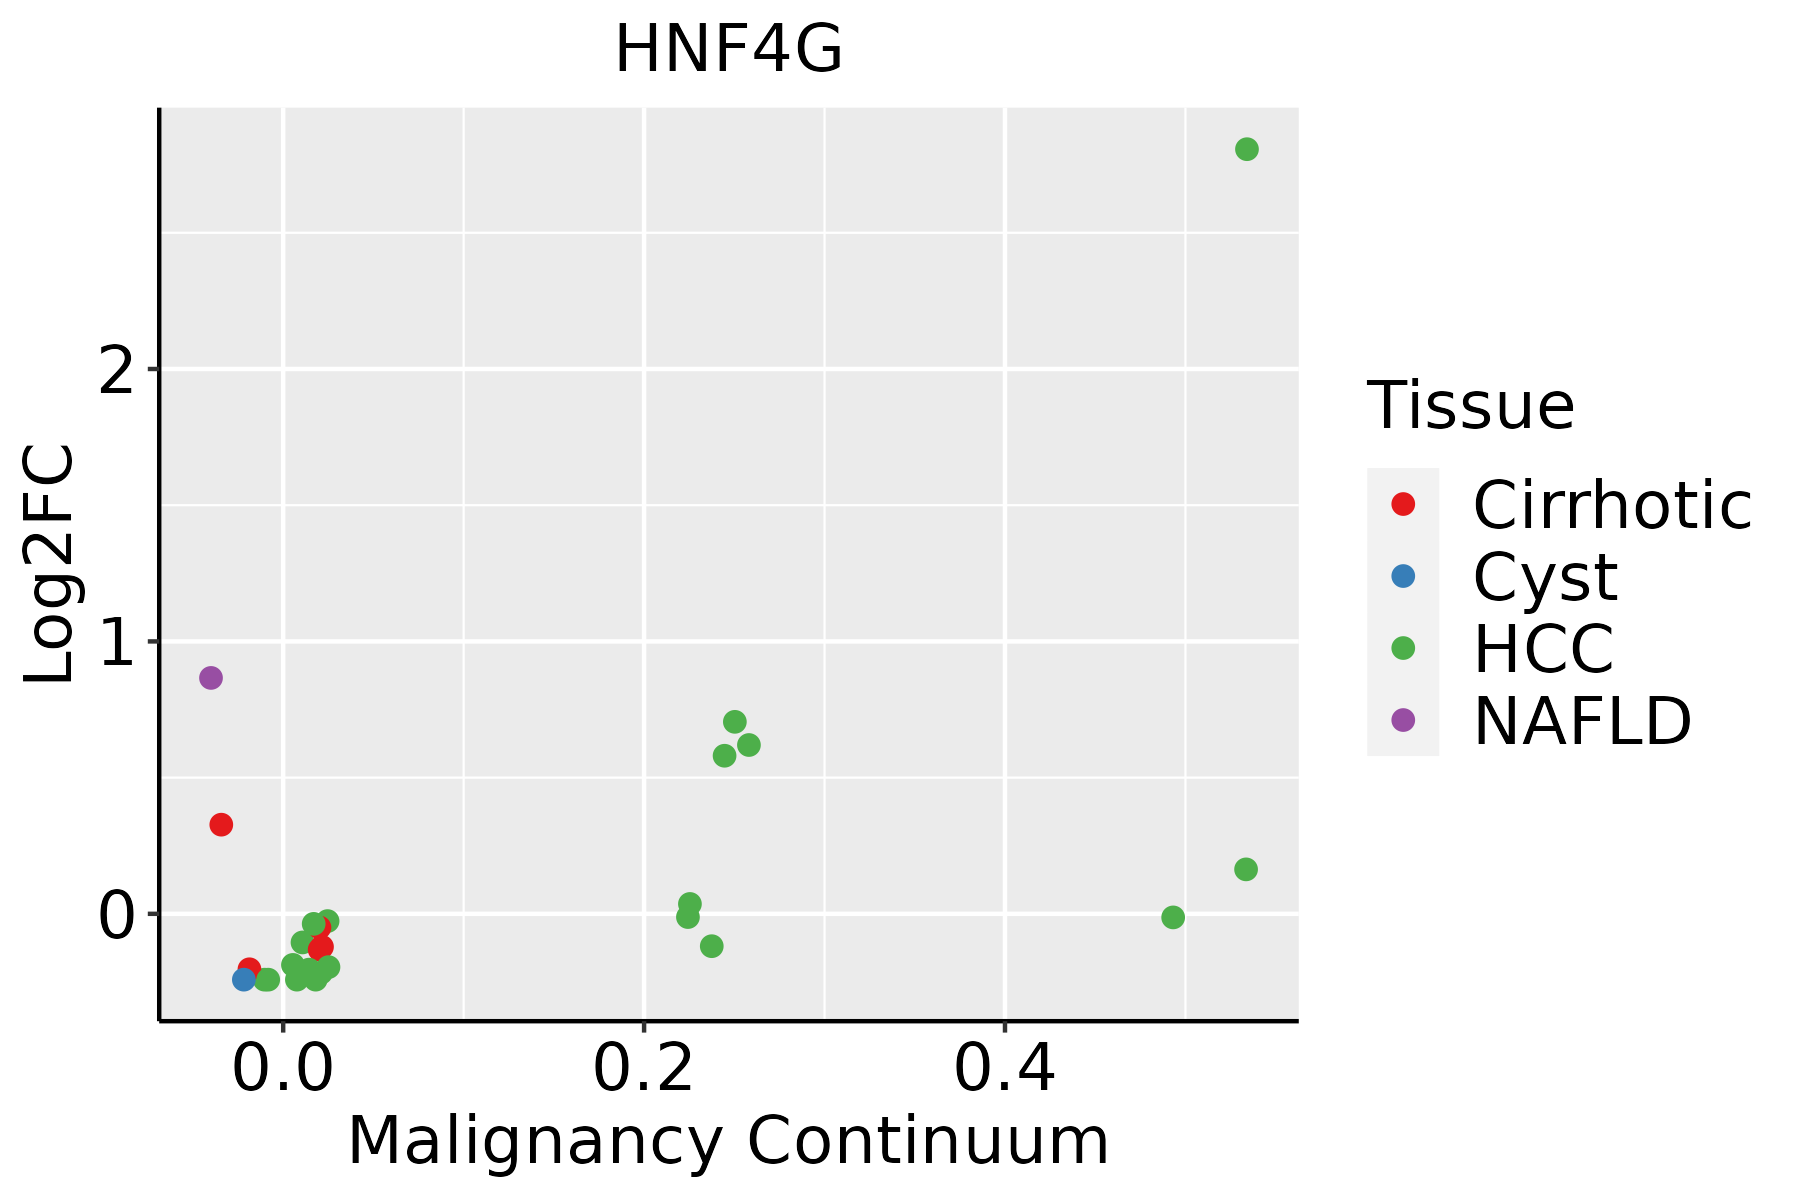 | HCC: Hepatocellular carcinoma |
| NAFLD: Non-alcoholic fatty liver disease |
| ∗log2FC in expression of this searched gene in stem-like cells from each diseased tissue sample relative to stem-like cells in normal samples in each tissue plotted against the malignancy continuum. Samples are colored based on if they are from different disease stage. |
Top |
Malignant transformation related pathway analysis |
| Find out the enriched GO biological processes and KEGG pathways involved in transition from healthy to precancer to cancer |
| Tissue | Disease Stage | Enriched GO biological Processes |
| Colorectum | AD |  |
| Colorectum | SER |  |
| Colorectum | MSS |  |
| Colorectum | MSI-H |  |
| Colorectum | FAP |  |
| ∗Top 15 enriched GO BP terms are showed in the bar plot of each disease state in each tissue. Each row represents a significant GO biological process which is colored according to the -log10(p.adjust). |
| Page: 1 2 3 4 5 6 7 8 9 |
| GO ID | Tissue | Disease Stage | Description | Gene Ratio | Bg Ratio | pvalue | p.adjust | Count |
| GO:0030522 | Colorectum | AD | intracellular receptor signaling pathway | 87/3918 | 265/18723 | 3.69e-06 | 1.03e-04 | 87 |
| GO:00305221 | Colorectum | SER | intracellular receptor signaling pathway | 63/2897 | 265/18723 | 2.47e-04 | 4.20e-03 | 63 |
| GO:00305222 | Colorectum | MSS | intracellular receptor signaling pathway | 84/3467 | 265/18723 | 1.47e-07 | 6.79e-06 | 84 |
| GO:00305223 | Colorectum | FAP | intracellular receptor signaling pathway | 67/2622 | 265/18723 | 6.84e-07 | 3.28e-05 | 67 |
| GO:00305224 | Colorectum | CRC | intracellular receptor signaling pathway | 61/2078 | 265/18723 | 2.00e-08 | 3.23e-06 | 61 |
| GO:00305226 | Liver | NAFLD | intracellular receptor signaling pathway | 55/1882 | 265/18723 | 1.39e-07 | 1.03e-05 | 55 |
| GO:003052212 | Liver | Cirrhotic | intracellular receptor signaling pathway | 105/4634 | 265/18723 | 5.44e-08 | 1.69e-06 | 105 |
| GO:003052222 | Liver | HCC | intracellular receptor signaling pathway | 171/7958 | 265/18723 | 3.00e-13 | 1.61e-11 | 171 |
| GO:00305225 | Stomach | GC | intracellular receptor signaling pathway | 28/1159 | 265/18723 | 4.04e-03 | 3.39e-02 | 28 |
| GO:003052211 | Stomach | CAG with IM | intracellular receptor signaling pathway | 28/1050 | 265/18723 | 9.76e-04 | 1.26e-02 | 28 |
| GO:003052221 | Stomach | CSG | intracellular receptor signaling pathway | 28/1034 | 265/18723 | 7.73e-04 | 1.06e-02 | 28 |
| Page: 1 |
| Pathway ID | Tissue | Disease Stage | Description | Gene Ratio | Bg Ratio | pvalue | p.adjust | qvalue | Count |
| Page: 1 |
Top |
Cell-cell communication analysis |
| Identification of potential cell-cell interactions between two cell types and their ligand-receptor pairs for different disease states |
| Ligand | Receptor | LRpair | Pathway | Tissue | Disease Stage |
| Page: 1 |
Top |
Single-cell gene regulatory network inference analysis |
| Find out the significant the regulons (TFs) and the target genes of each regulon across cell types for different disease states |
| TF | Cell Type | Tissue | Disease Stage | Target Gene | RSS | Regulon Activity |
| HNF4G | LYMEND | Cervix | CC | GBX1,FDX1,GNGT1, etc. | 1.09e-01 |  |
| HNF4G | MSC.MVA | Cervix | CC | GBX1,FDX1,GNGT1, etc. | 2.00e-01 | |
| HNF4G | STML | Cervix | CC | GBX1,FDX1,GNGT1, etc. | 2.44e-01 | |
| HNF4G | BSM | Cervix | CC | GBX1,FDX1,GNGT1, etc. | 7.78e-02 | |
| HNF4G | END | Cervix | Healthy | GBX1,FDX1,GNGT1, etc. | 1.04e-01 |  |
| HNF4G | MVA | Cervix | HSIL_HPV | GBX1,FDX1,GNGT1, etc. | 7.08e-02 |  |
| HNF4G | ABS | Colorectum | SER | LPP,EIF4G3,C1orf21, etc. | 2.75e-01 |  |
| ∗The dot plots of a searched regulon are shown for all cell subpopulations in each disease state of each tissue based on the regulon specific score inferred using pySCENIC and by calculating the average expression. |
| Page: 1 |
Top |
Somatic mutation of malignant transformation related genes |
| Annotation of somatic variants for genes involved in malignant transformation |
| Hugo Symbol | Variant Class | Variant Classification | dbSNP RS | HGVSc | HGVSp | HGVSp Short | SWISSPROT | BIOTYPE | SIFT | PolyPhen | Tumor Sample Barcode | Tissue | Histology | Sex | Age | Stage | Therapy Types | Drugs | Outcome |
| HNF4G | SNV | Missense_Mutation | rs772036366 | c.223N>T | p.Arg75Cys | p.R75C | Q14541 | protein_coding | deleterious(0) | probably_damaging(0.999) | TCGA-D8-A1J8-01 | Breast | breast invasive carcinoma | Female | >=65 | I/II | Hormone Therapy | nolvadex | SD |
| HNF4G | SNV | Missense_Mutation | c.1249C>G | p.Gln417Glu | p.Q417E | Q14541 | protein_coding | tolerated(0.54) | benign(0.01) | TCGA-E9-A22B-01 | Breast | breast invasive carcinoma | Female | >=65 | I/II | Hormone Therapy | tamoxiphen | SD | |
| HNF4G | insertion | Frame_Shift_Ins | novel | c.189_190insGTTC | p.Ser64ValfsTer5 | p.S64Vfs*5 | Q14541 | protein_coding | TCGA-AR-A0U0-01 | Breast | breast invasive carcinoma | Female | >=65 | I/II | Unknown | Unknown | SD | ||
| HNF4G | insertion | Frame_Shift_Ins | novel | c.78_79insCTTCAGATAAGGCTATTCCATGAAGCATTCCAAGATTATCACAAGG | p.Asn27LeufsTer19 | p.N27Lfs*19 | Q14541 | protein_coding | TCGA-BH-A0HU-01 | Breast | breast invasive carcinoma | Female | <65 | I/II | Chemotherapy | docetaxel | SD | ||
| HNF4G | SNV | Missense_Mutation | rs183146707 | c.916N>A | p.Gly306Ser | p.G306S | Q14541 | protein_coding | tolerated(1) | benign(0.003) | TCGA-2W-A8YY-01 | Cervix | cervical & endocervical cancer | Female | <65 | I/II | Chemotherapy | cisplatin | CR |
| HNF4G | SNV | Missense_Mutation | rs766767221 | c.607N>A | p.Asp203Asn | p.D203N | Q14541 | protein_coding | deleterious(0.05) | benign(0.165) | TCGA-AA-3672-01 | Colorectum | colon adenocarcinoma | Female | >=65 | III/IV | Unknown | Unknown | SD |
| HNF4G | SNV | Missense_Mutation | rs755923251 | c.874N>A | p.Asp292Asn | p.D292N | Q14541 | protein_coding | tolerated(0.2) | benign(0.005) | TCGA-AA-3672-01 | Colorectum | colon adenocarcinoma | Female | >=65 | III/IV | Unknown | Unknown | SD |
| HNF4G | SNV | Missense_Mutation | novel | c.1077N>T | p.Gln359His | p.Q359H | Q14541 | protein_coding | deleterious(0.05) | benign(0.027) | TCGA-AA-3947-01 | Colorectum | colon adenocarcinoma | Female | <65 | I/II | Unknown | Unknown | SD |
| HNF4G | SNV | Missense_Mutation | c.66N>T | p.Met22Ile | p.M22I | Q14541 | protein_coding | tolerated(0.16) | benign(0.001) | TCGA-CM-4746-01 | Colorectum | colon adenocarcinoma | Male | <65 | I/II | Unknown | Unknown | SD | |
| HNF4G | SNV | Missense_Mutation | c.67N>G | p.Gln23Glu | p.Q23E | Q14541 | protein_coding | tolerated(0.17) | benign(0.007) | TCGA-CM-4746-01 | Colorectum | colon adenocarcinoma | Male | <65 | I/II | Unknown | Unknown | SD |
| Page: 1 2 3 4 5 6 7 |
Top |
Related drugs of malignant transformation related genes |
| Identification of chemicals and drugs interact with genes involved in malignant transfromation |
| (DGIdb 4.0) |
| Entrez ID | Symbol | Category | Interaction Types | Drug Claim Name | Drug Name | PMIDs |
| Page: 1 |

Copyright 2023-Present -The University of Texas Health Science Center at Houston |