
|
|||||
|
 | |
| |
| |
| |
| |
| |
|
Gene: HNF4A |
Gene summary for HNF4A |
| Gene information | Species | Human | Gene symbol | HNF4A | Gene ID | 3172 |
| Gene name | hepatocyte nuclear factor 4 alpha | |
| Gene Alias | FRTS4 | |
| Cytomap | 20q13.12 | |
| Gene Type | protein-coding | GO ID | GO:0000003 | UniProtAcc | F1D8T1 |
Top |
Malignant transformation analysis |
| Identification of the aberrant gene expression in precancerous and cancerous lesions by comparing the gene expression of stem-like cells in diseased tissues with normal stem cells |
| Entrez ID | Symbol | Replicates | Species | Organ | Tissue | Adj P-value | Log2FC | Malignancy |
| 3172 | HNF4A | HTA11_3410_2000001011 | Human | Colorectum | AD | 4.42e-08 | -3.52e-01 | 0.0155 |
| 3172 | HNF4A | HTA11_2487_2000001011 | Human | Colorectum | SER | 2.57e-06 | 5.67e-01 | -0.1808 |
| 3172 | HNF4A | HTA11_347_2000001011 | Human | Colorectum | AD | 7.80e-31 | 1.06e+00 | -0.1954 |
| 3172 | HNF4A | HTA11_411_2000001011 | Human | Colorectum | SER | 8.60e-13 | 1.16e+00 | -0.2602 |
| 3172 | HNF4A | HTA11_2112_2000001011 | Human | Colorectum | SER | 1.95e-12 | 9.00e-01 | -0.2196 |
| 3172 | HNF4A | HTA11_83_2000001011 | Human | Colorectum | SER | 5.91e-04 | 4.65e-01 | -0.1526 |
| 3172 | HNF4A | HTA11_696_2000001011 | Human | Colorectum | AD | 1.21e-08 | 6.76e-01 | -0.1464 |
| 3172 | HNF4A | HTA11_1391_2000001011 | Human | Colorectum | AD | 3.21e-05 | 6.57e-01 | -0.059 |
| 3172 | HNF4A | HTA11_99999970781_79442 | Human | Colorectum | MSS | 1.96e-22 | -5.43e-01 | 0.294 |
| 3172 | HNF4A | HTA11_99999965062_69753 | Human | Colorectum | MSI-H | 2.74e-02 | 5.63e-01 | 0.3487 |
| 3172 | HNF4A | HTA11_99999965104_69814 | Human | Colorectum | MSS | 3.25e-17 | 1.01e+00 | 0.281 |
| 3172 | HNF4A | HTA11_99999971662_82457 | Human | Colorectum | MSS | 2.71e-17 | 1.29e+00 | 0.3859 |
| 3172 | HNF4A | HTA11_99999973899_84307 | Human | Colorectum | MSS | 5.86e-06 | 7.88e-01 | 0.2585 |
| 3172 | HNF4A | HTA11_99999974143_84620 | Human | Colorectum | MSS | 1.10e-10 | 9.19e-01 | 0.3005 |
| 3172 | HNF4A | F007 | Human | Colorectum | FAP | 4.21e-05 | -3.37e-01 | 0.1176 |
| 3172 | HNF4A | A002-C-010 | Human | Colorectum | FAP | 1.91e-10 | -4.26e-01 | 0.242 |
| 3172 | HNF4A | A001-C-207 | Human | Colorectum | FAP | 1.33e-07 | -4.28e-01 | 0.1278 |
| 3172 | HNF4A | A015-C-203 | Human | Colorectum | FAP | 2.28e-45 | -6.39e-01 | -0.1294 |
| 3172 | HNF4A | A015-C-204 | Human | Colorectum | FAP | 5.01e-10 | -4.33e-01 | -0.0228 |
| 3172 | HNF4A | A014-C-040 | Human | Colorectum | FAP | 6.78e-09 | -6.33e-01 | -0.1184 |
| Page: 1 2 3 4 |
| Tissue | Expression Dynamics | Abbreviation |
| Colorectum (GSE201348) |  | FAP: Familial adenomatous polyposis |
| CRC: Colorectal cancer | ||
| Colorectum (HTA11) |  | AD: Adenomas |
| SER: Sessile serrated lesions | ||
| MSI-H: Microsatellite-high colorectal cancer | ||
| MSS: Microsatellite stable colorectal cancer | ||
| GC | 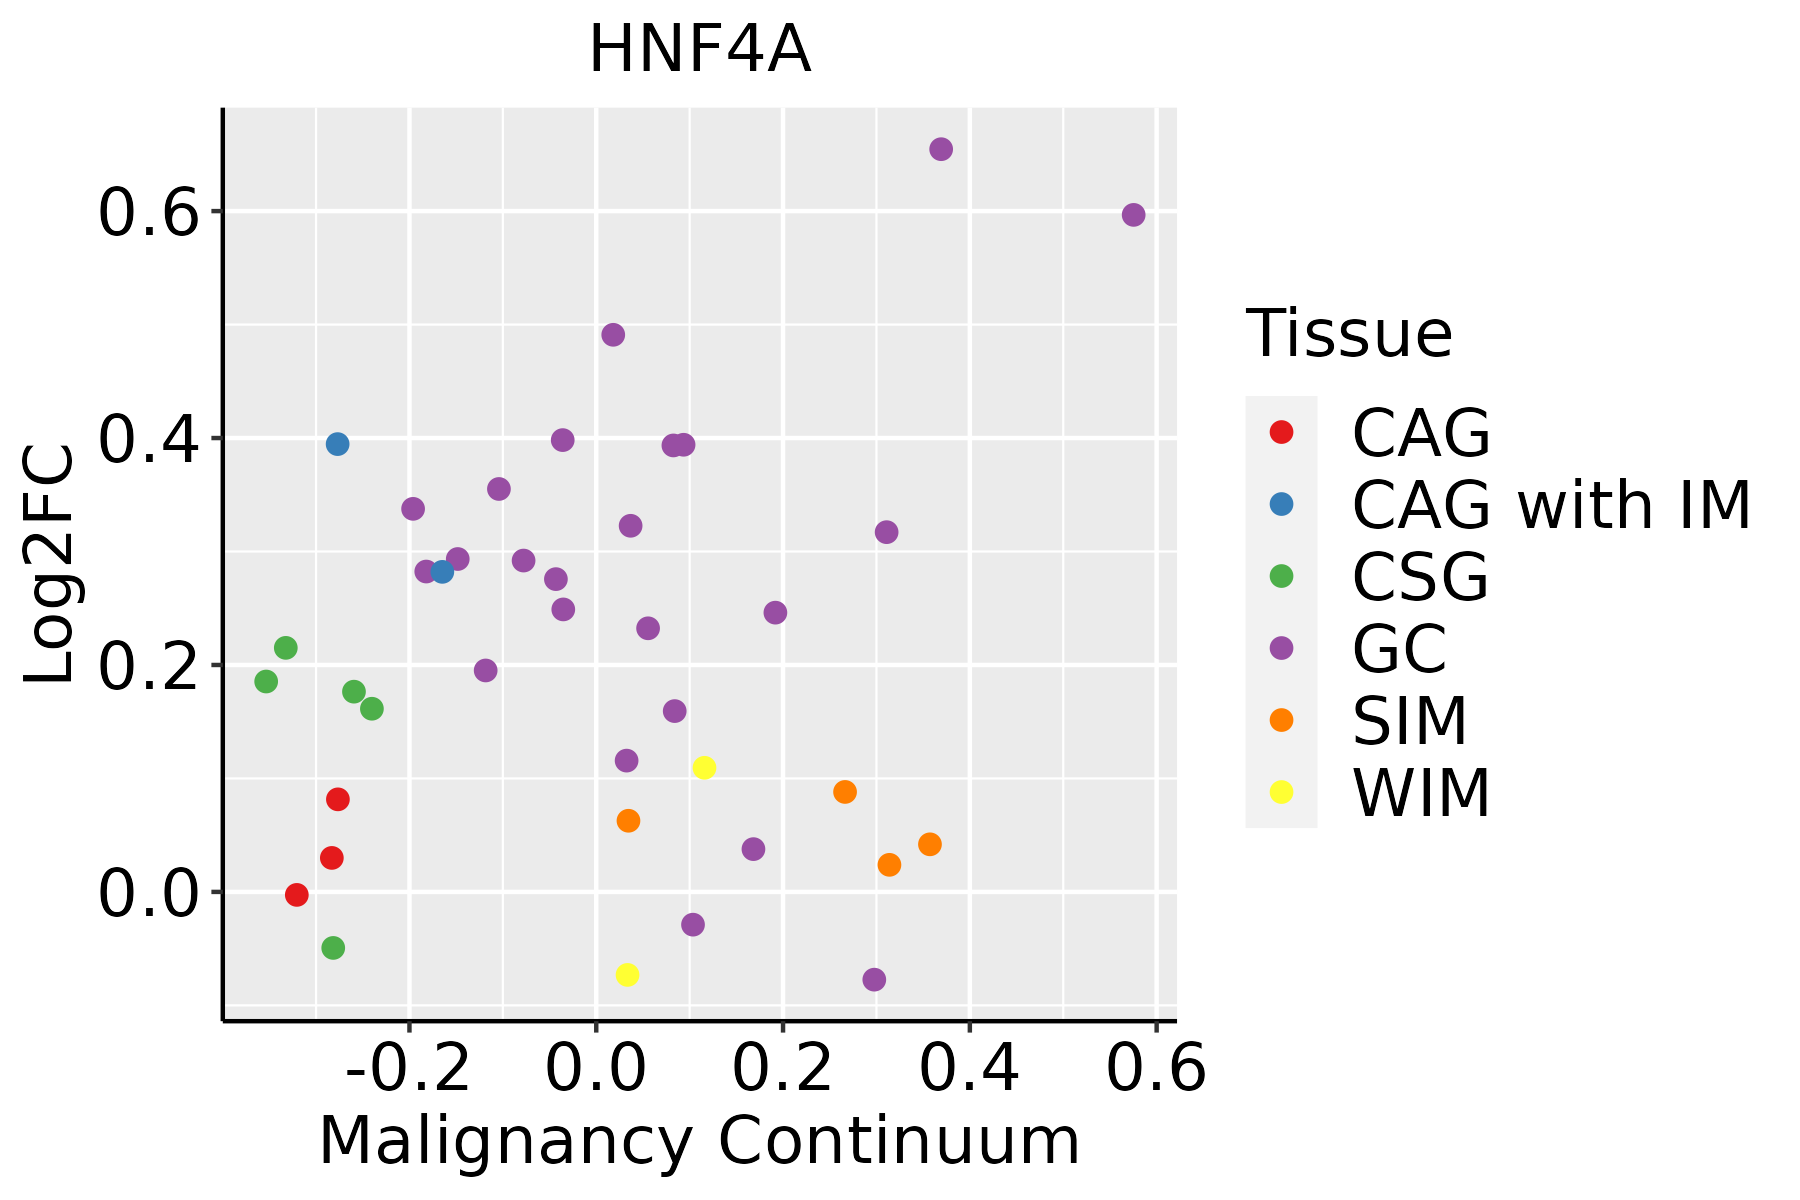 | CAG: Chronic atrophic gastritis |
| CAG with IM: Chronic atrophic gastritis with intestinal metaplasia | ||
| CSG: Chronic superficial gastritis | ||
| GC: Gastric cancer | ||
| SIM: Severe intestinal metaplasia | ||
| WIM: Wild intestinal metaplasia | ||
| Liver | 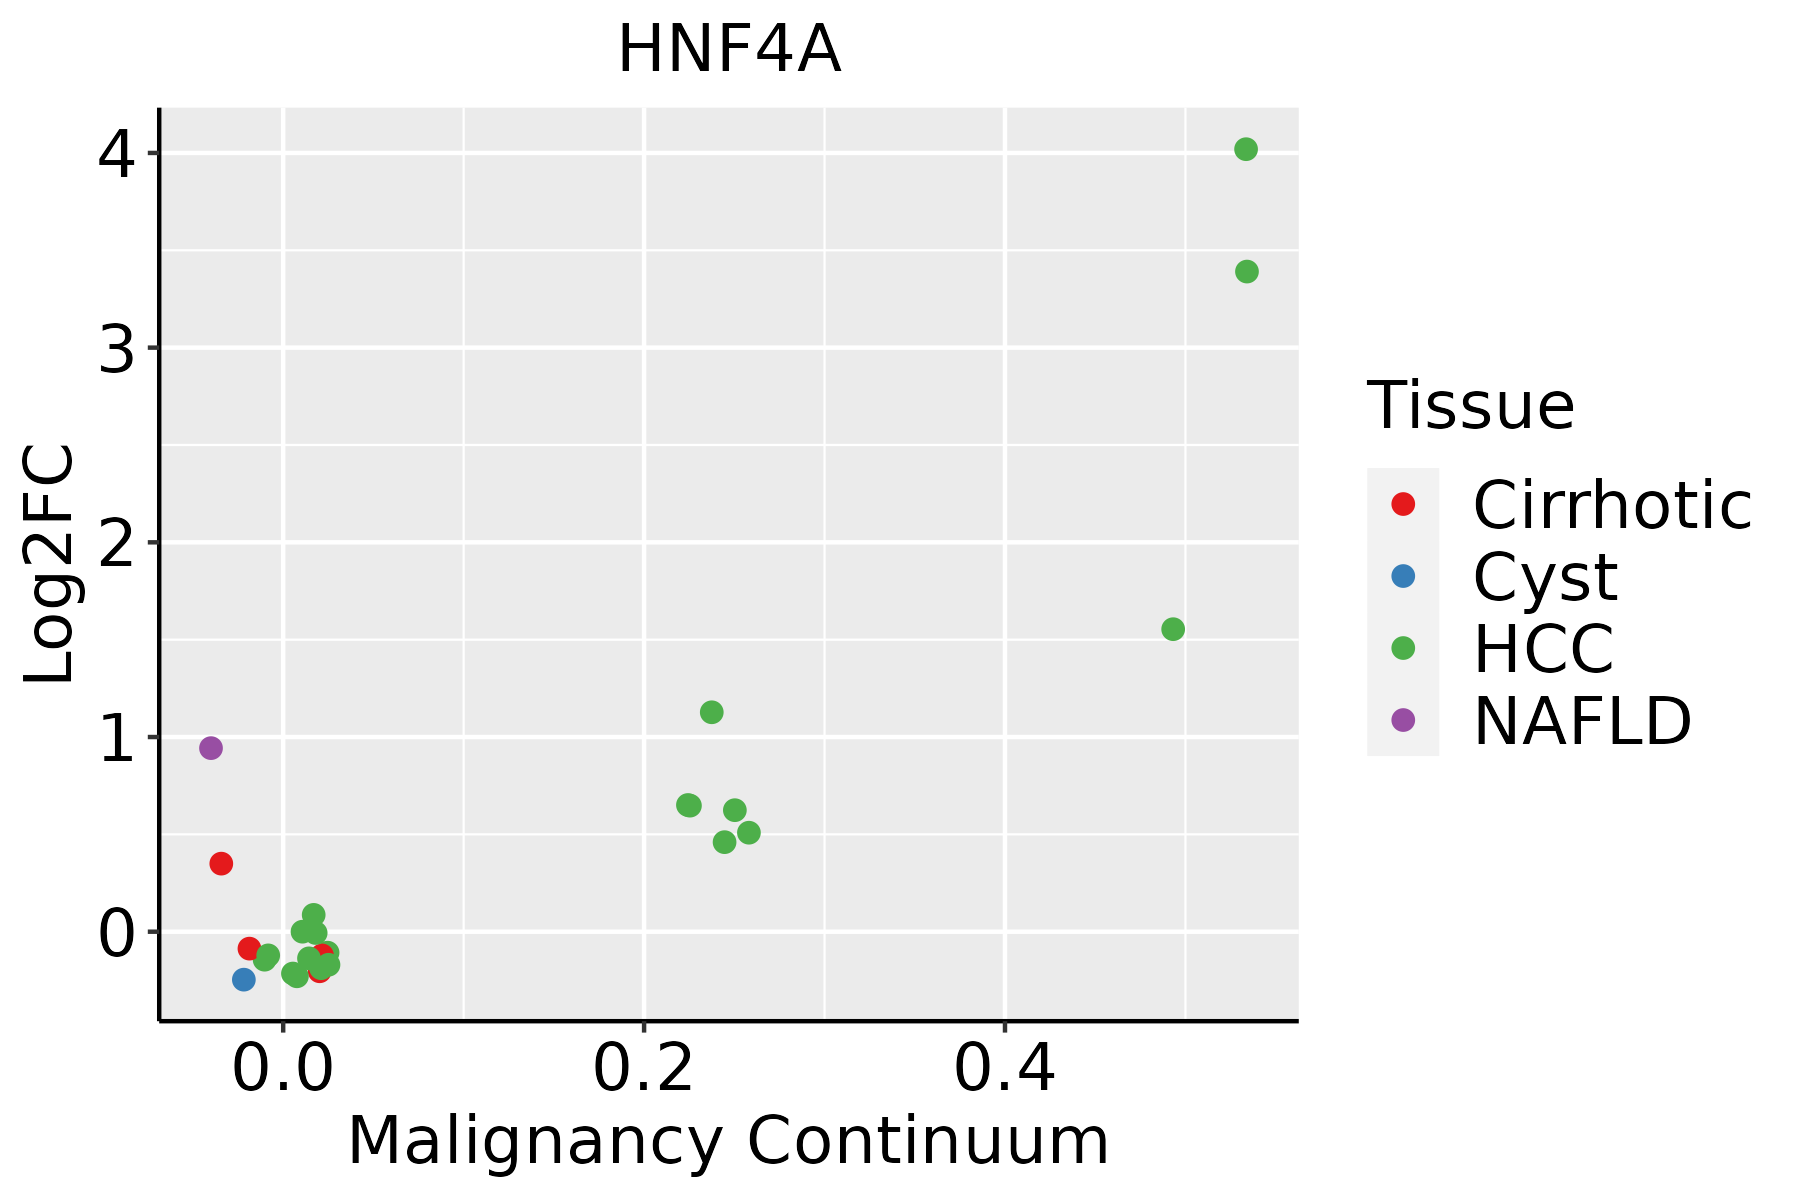 | HCC: Hepatocellular carcinoma |
| NAFLD: Non-alcoholic fatty liver disease |
| ∗log2FC in expression of this searched gene in stem-like cells from each diseased tissue sample relative to stem-like cells in normal samples in each tissue plotted against the malignancy continuum. Samples are colored based on if they are from different disease stage. |
Top |
Malignant transformation related pathway analysis |
| Find out the enriched GO biological processes and KEGG pathways involved in transition from healthy to precancer to cancer |
| Tissue | Disease Stage | Enriched GO biological Processes |
| Colorectum | AD |  |
| Colorectum | SER |  |
| Colorectum | MSS |  |
| Colorectum | MSI-H |  |
| Colorectum | FAP |  |
| ∗Top 15 enriched GO BP terms are showed in the bar plot of each disease state in each tissue. Each row represents a significant GO biological process which is colored according to the -log10(p.adjust). |
| Page: 1 2 3 4 5 6 7 8 9 |
| GO ID | Tissue | Disease Stage | Description | Gene Ratio | Bg Ratio | pvalue | p.adjust | Count |
| GO:0002064 | Colorectum | AD | epithelial cell development | 89/3918 | 220/18723 | 2.98e-11 | 3.52e-09 | 89 |
| GO:0048732 | Colorectum | AD | gland development | 149/3918 | 436/18723 | 6.07e-11 | 6.33e-09 | 149 |
| GO:0009743 | Colorectum | AD | response to carbohydrate | 86/3918 | 253/18723 | 8.43e-07 | 2.90e-05 | 86 |
| GO:0042060 | Colorectum | AD | wound healing | 128/3918 | 422/18723 | 2.73e-06 | 7.89e-05 | 128 |
| GO:0016049 | Colorectum | AD | cell growth | 143/3918 | 482/18723 | 2.83e-06 | 8.09e-05 | 143 |
| GO:0030522 | Colorectum | AD | intracellular receptor signaling pathway | 87/3918 | 265/18723 | 3.69e-06 | 1.03e-04 | 87 |
| GO:0007623 | Colorectum | AD | circadian rhythm | 72/3918 | 210/18723 | 4.50e-06 | 1.21e-04 | 72 |
| GO:0034284 | Colorectum | AD | response to monosaccharide | 76/3918 | 225/18723 | 4.64e-06 | 1.23e-04 | 76 |
| GO:0061008 | Colorectum | AD | hepaticobiliary system development | 55/3918 | 150/18723 | 6.34e-06 | 1.59e-04 | 55 |
| GO:0001889 | Colorectum | AD | liver development | 54/3918 | 147/18723 | 7.20e-06 | 1.77e-04 | 54 |
| GO:0001558 | Colorectum | AD | regulation of cell growth | 124/3918 | 414/18723 | 7.67e-06 | 1.86e-04 | 124 |
| GO:0033500 | Colorectum | AD | carbohydrate homeostasis | 84/3918 | 259/18723 | 9.10e-06 | 2.15e-04 | 84 |
| GO:0048511 | Colorectum | AD | rhythmic process | 94/3918 | 298/18723 | 1.00e-05 | 2.34e-04 | 94 |
| GO:0009746 | Colorectum | AD | response to hexose | 73/3918 | 219/18723 | 1.20e-05 | 2.65e-04 | 73 |
| GO:0009749 | Colorectum | AD | response to glucose | 71/3918 | 212/18723 | 1.31e-05 | 2.85e-04 | 71 |
| GO:0042593 | Colorectum | AD | glucose homeostasis | 83/3918 | 258/18723 | 1.44e-05 | 3.11e-04 | 83 |
| GO:0050708 | Colorectum | AD | regulation of protein secretion | 83/3918 | 268/18723 | 6.59e-05 | 1.07e-03 | 83 |
| GO:0009306 | Colorectum | AD | protein secretion | 105/3918 | 359/18723 | 1.05e-04 | 1.57e-03 | 105 |
| GO:0035592 | Colorectum | AD | establishment of protein localization to extracellular region | 105/3918 | 360/18723 | 1.18e-04 | 1.73e-03 | 105 |
| GO:0071692 | Colorectum | AD | protein localization to extracellular region | 106/3918 | 368/18723 | 1.86e-04 | 2.49e-03 | 106 |
| Page: 1 2 3 4 5 6 7 8 9 10 11 12 13 14 15 16 17 18 19 |
| Pathway ID | Tissue | Disease Stage | Description | Gene Ratio | Bg Ratio | pvalue | p.adjust | qvalue | Count |
| hsa04152 | Colorectum | AD | AMPK signaling pathway | 47/2092 | 121/8465 | 3.74e-04 | 2.82e-03 | 1.80e-03 | 47 |
| hsa041521 | Colorectum | AD | AMPK signaling pathway | 47/2092 | 121/8465 | 3.74e-04 | 2.82e-03 | 1.80e-03 | 47 |
| hsa041522 | Colorectum | MSS | AMPK signaling pathway | 41/1875 | 121/8465 | 1.91e-03 | 9.83e-03 | 6.03e-03 | 41 |
| hsa041523 | Colorectum | MSS | AMPK signaling pathway | 41/1875 | 121/8465 | 1.91e-03 | 9.83e-03 | 6.03e-03 | 41 |
| hsa041524 | Colorectum | FAP | AMPK signaling pathway | 37/1404 | 121/8465 | 8.97e-05 | 8.56e-04 | 5.21e-04 | 37 |
| hsa041525 | Colorectum | FAP | AMPK signaling pathway | 37/1404 | 121/8465 | 8.97e-05 | 8.56e-04 | 5.21e-04 | 37 |
| hsa041526 | Colorectum | CRC | AMPK signaling pathway | 31/1091 | 121/8465 | 1.04e-04 | 1.57e-03 | 1.07e-03 | 31 |
| hsa041527 | Colorectum | CRC | AMPK signaling pathway | 31/1091 | 121/8465 | 1.04e-04 | 1.57e-03 | 1.07e-03 | 31 |
| hsa041528 | Liver | NAFLD | AMPK signaling pathway | 28/1043 | 121/8465 | 6.26e-04 | 9.78e-03 | 7.88e-03 | 28 |
| hsa0415211 | Liver | NAFLD | AMPK signaling pathway | 28/1043 | 121/8465 | 6.26e-04 | 9.78e-03 | 7.88e-03 | 28 |
| hsa0415221 | Liver | Cirrhotic | AMPK signaling pathway | 49/2530 | 121/8465 | 7.90e-03 | 2.74e-02 | 1.69e-02 | 49 |
| hsa0415231 | Liver | Cirrhotic | AMPK signaling pathway | 49/2530 | 121/8465 | 7.90e-03 | 2.74e-02 | 1.69e-02 | 49 |
| hsa0415241 | Liver | HCC | AMPK signaling pathway | 77/4020 | 121/8465 | 2.32e-04 | 1.11e-03 | 6.18e-04 | 77 |
| hsa0415251 | Liver | HCC | AMPK signaling pathway | 77/4020 | 121/8465 | 2.32e-04 | 1.11e-03 | 6.18e-04 | 77 |
| Page: 1 |
Top |
Cell-cell communication analysis |
| Identification of potential cell-cell interactions between two cell types and their ligand-receptor pairs for different disease states |
| Ligand | Receptor | LRpair | Pathway | Tissue | Disease Stage |
| Page: 1 |
Top |
Single-cell gene regulatory network inference analysis |
| Find out the significant the regulons (TFs) and the target genes of each regulon across cell types for different disease states |
| TF | Cell Type | Tissue | Disease Stage | Target Gene | RSS | Regulon Activity |
| HNF4A | HEP | Liver | HCC | NBPF20,DHCR24,BCL2L11, etc. | 8.23e-01 |  |
| HNF4A | HEP | Liver | NAFLD | NBPF20,DHCR24,BCL2L11, etc. | 7.95e-01 |  |
| HNF4A | DUCT1 | Pancreas | PDAC | PIGR,SULT1C2,DNM2, etc. | 6.42e-01 |  |
| ∗The dot plots of a searched regulon are shown for all cell subpopulations in each disease state of each tissue based on the regulon specific score inferred using pySCENIC and by calculating the average expression. |
| Page: 1 |
Top |
Somatic mutation of malignant transformation related genes |
| Annotation of somatic variants for genes involved in malignant transformation |
| Hugo Symbol | Variant Class | Variant Classification | dbSNP RS | HGVSc | HGVSp | HGVSp Short | SWISSPROT | BIOTYPE | SIFT | PolyPhen | Tumor Sample Barcode | Tissue | Histology | Sex | Age | Stage | Therapy Types | Drugs | Outcome |
| HNF4A | SNV | Missense_Mutation | c.454N>T | p.Ile152Phe | p.I152F | P41235 | protein_coding | deleterious(0.02) | benign(0.048) | TCGA-A8-A09A-01 | Breast | breast invasive carcinoma | Female | <65 | I/II | Hormone Therapy | tamoxiphen | SD | |
| HNF4A | SNV | Missense_Mutation | c.186C>G | p.Ile62Met | p.I62M | P41235 | protein_coding | deleterious(0) | probably_damaging(0.926) | TCGA-AC-A23H-01 | Breast | breast invasive carcinoma | Female | >=65 | I/II | Unknown | Unknown | PD | |
| HNF4A | SNV | Missense_Mutation | c.337N>G | p.Arg113Gly | p.R113G | P41235 | protein_coding | deleterious(0) | probably_damaging(1) | TCGA-AR-A0TU-01 | Breast | breast invasive carcinoma | Female | <65 | I/II | Unspecific | Doxorubicin | SD | |
| HNF4A | insertion | Nonsense_Mutation | novel | c.645_646insGTGCAGTGGCACAGTCACAGTTCACTGTAGCCTCAACCTCCTGGGCT | p.Gln216ValfsTer10 | p.Q216Vfs*10 | P41235 | protein_coding | TCGA-AR-A0TY-01 | Breast | breast invasive carcinoma | Female | <65 | I/II | Unspecific | Paclitaxel | PD | ||
| HNF4A | insertion | Frame_Shift_Ins | novel | c.687_688insATGGTGAAACCCCGTCTCTA | p.Leu230MetfsTer23 | p.L230Mfs*23 | P41235 | protein_coding | TCGA-B6-A0IN-01 | Breast | breast invasive carcinoma | Female | <65 | I/II | Unknown | Unknown | PD | ||
| HNF4A | SNV | Missense_Mutation | novel | c.478N>T | p.Val160Phe | p.V160F | P41235 | protein_coding | tolerated(0.05) | benign(0.036) | TCGA-2W-A8YY-01 | Cervix | cervical & endocervical cancer | Female | <65 | I/II | Chemotherapy | cisplatin | CR |
| HNF4A | SNV | Missense_Mutation | rs376906221 | c.172G>A | p.Ala58Thr | p.A58T | P41235 | protein_coding | tolerated(0.48) | benign(0.003) | TCGA-C5-A1BJ-01 | Cervix | cervical & endocervical cancer | Female | <65 | I/II | Unknown | Unknown | SD |
| HNF4A | SNV | Missense_Mutation | c.1198N>G | p.Thr400Ala | p.T400A | P41235 | protein_coding | tolerated(0.82) | benign(0.028) | TCGA-FU-A3HZ-01 | Cervix | cervical & endocervical cancer | Female | <65 | I/II | Chemotherapy | cisplatin | CR | |
| HNF4A | SNV | Missense_Mutation | rs377476335 | c.388N>A | p.Val130Ile | p.V130I | P41235 | protein_coding | tolerated(0.07) | benign(0.134) | TCGA-FU-A3TX-01 | Cervix | cervical & endocervical cancer | Female | >=65 | I/II | Unknown | Unknown | SD |
| HNF4A | SNV | Missense_Mutation | c.1288C>T | p.Pro430Ser | p.P430S | P41235 | protein_coding | deleterious_low_confidence(0.03) | benign(0.012) | TCGA-AA-3693-01 | Colorectum | colon adenocarcinoma | Female | >=65 | III/IV | Unknown | Unknown | SD |
| Page: 1 2 3 4 5 6 7 8 9 10 |
Top |
Related drugs of malignant transformation related genes |
| Identification of chemicals and drugs interact with genes involved in malignant transfromation |
| (DGIdb 4.0) |
| Entrez ID | Symbol | Category | Interaction Types | Drug Claim Name | Drug Name | PMIDs |
| 3172 | HNF4A | DRUGGABLE GENOME, TRANSCRIPTION FACTOR, NUCLEAR HORMONE RECEPTOR | UREA | UREA | 8167573 | |
| 3172 | HNF4A | DRUGGABLE GENOME, TRANSCRIPTION FACTOR, NUCLEAR HORMONE RECEPTOR | MEDICATION | 16456494 | ||
| 3172 | HNF4A | DRUGGABLE GENOME, TRANSCRIPTION FACTOR, NUCLEAR HORMONE RECEPTOR | ALPHA INTERFERON | CETUXIMAB | 8777337 | |
| 3172 | HNF4A | DRUGGABLE GENOME, TRANSCRIPTION FACTOR, NUCLEAR HORMONE RECEPTOR | TESTOSTERONE | TESTOSTERONE | 9260906 | |
| 3172 | HNF4A | DRUGGABLE GENOME, TRANSCRIPTION FACTOR, NUCLEAR HORMONE RECEPTOR | INSULIN | INSULIN | 8945471,8712800 | |
| 3172 | HNF4A | DRUGGABLE GENOME, TRANSCRIPTION FACTOR, NUCLEAR HORMONE RECEPTOR | GNF-PF-1947 | CHEMBL585591 | ||
| 3172 | HNF4A | DRUGGABLE GENOME, TRANSCRIPTION FACTOR, NUCLEAR HORMONE RECEPTOR | NSC-39249 | CHEMBL482792 | ||
| 3172 | HNF4A | DRUGGABLE GENOME, TRANSCRIPTION FACTOR, NUCLEAR HORMONE RECEPTOR | lamotrigine | LAMOTRIGINE | 27610747,26213157 | |
| 3172 | HNF4A | DRUGGABLE GENOME, TRANSCRIPTION FACTOR, NUCLEAR HORMONE RECEPTOR | ROSIGLITAZONE | ROSIGLITAZONE | 15998575 | |
| 3172 | HNF4A | DRUGGABLE GENOME, TRANSCRIPTION FACTOR, NUCLEAR HORMONE RECEPTOR | ALBUMIN | ALBUMIN HUMAN | 8788167 |
| Page: 1 2 |

Copyright 2023-Present -The University of Texas Health Science Center at Houston |