
|
|||||
|
 | |
| |
| |
| |
| |
| |
|
Gene: HNF1B |
Gene summary for HNF1B |
| Gene information | Species | Human | Gene symbol | HNF1B | Gene ID | 6928 |
| Gene name | HNF1 homeobox B | |
| Gene Alias | ADTKD3 | |
| Cytomap | 17q12 | |
| Gene Type | protein-coding | GO ID | GO:0001655 | UniProtAcc | P35680 |
Top |
Malignant transformation analysis |
| Identification of the aberrant gene expression in precancerous and cancerous lesions by comparing the gene expression of stem-like cells in diseased tissues with normal stem cells |
| Entrez ID | Symbol | Replicates | Species | Organ | Tissue | Adj P-value | Log2FC | Malignancy |
| 6928 | HNF1B | S43 | Human | Liver | Cirrhotic | 7.02e-04 | -1.88e-01 | -0.0187 |
| 6928 | HNF1B | HCC1_Meng | Human | Liver | HCC | 6.55e-15 | -2.65e-01 | 0.0246 |
| 6928 | HNF1B | HCC2_Meng | Human | Liver | HCC | 5.85e-17 | -7.36e-02 | 0.0107 |
| 6928 | HNF1B | cirrhotic1 | Human | Liver | Cirrhotic | 2.48e-04 | 4.14e-02 | 0.0202 |
| 6928 | HNF1B | cirrhotic2 | Human | Liver | Cirrhotic | 3.73e-19 | 3.84e-01 | 0.0201 |
| 6928 | HNF1B | HCC1 | Human | Liver | HCC | 1.55e-02 | 1.14e+00 | 0.5336 |
| 6928 | HNF1B | HCC5 | Human | Liver | HCC | 4.96e-09 | 1.31e-01 | 0.4932 |
| 6928 | HNF1B | Pt13.a | Human | Liver | HCC | 6.22e-05 | -2.60e-01 | 0.021 |
| 6928 | HNF1B | Pt13.b | Human | Liver | HCC | 5.61e-03 | -2.10e-01 | 0.0251 |
| 6928 | HNF1B | Pt13.c | Human | Liver | HCC | 4.49e-06 | -2.95e-01 | 0.0076 |
| 6928 | HNF1B | Pt14.d | Human | Liver | HCC | 4.90e-02 | -2.34e-01 | 0.0143 |
| 6928 | HNF1B | S014 | Human | Liver | HCC | 2.82e-03 | -2.65e-01 | 0.2254 |
| 6928 | HNF1B | S015 | Human | Liver | HCC | 3.22e-04 | -2.63e-01 | 0.2375 |
| 6928 | HNF1B | S016 | Human | Liver | HCC | 9.64e-07 | -2.83e-01 | 0.2243 |
| 6928 | HNF1B | S028 | Human | Liver | HCC | 7.28e-06 | 6.76e-01 | 0.2503 |
| Page: 1 |
| Tissue | Expression Dynamics | Abbreviation |
| Liver | 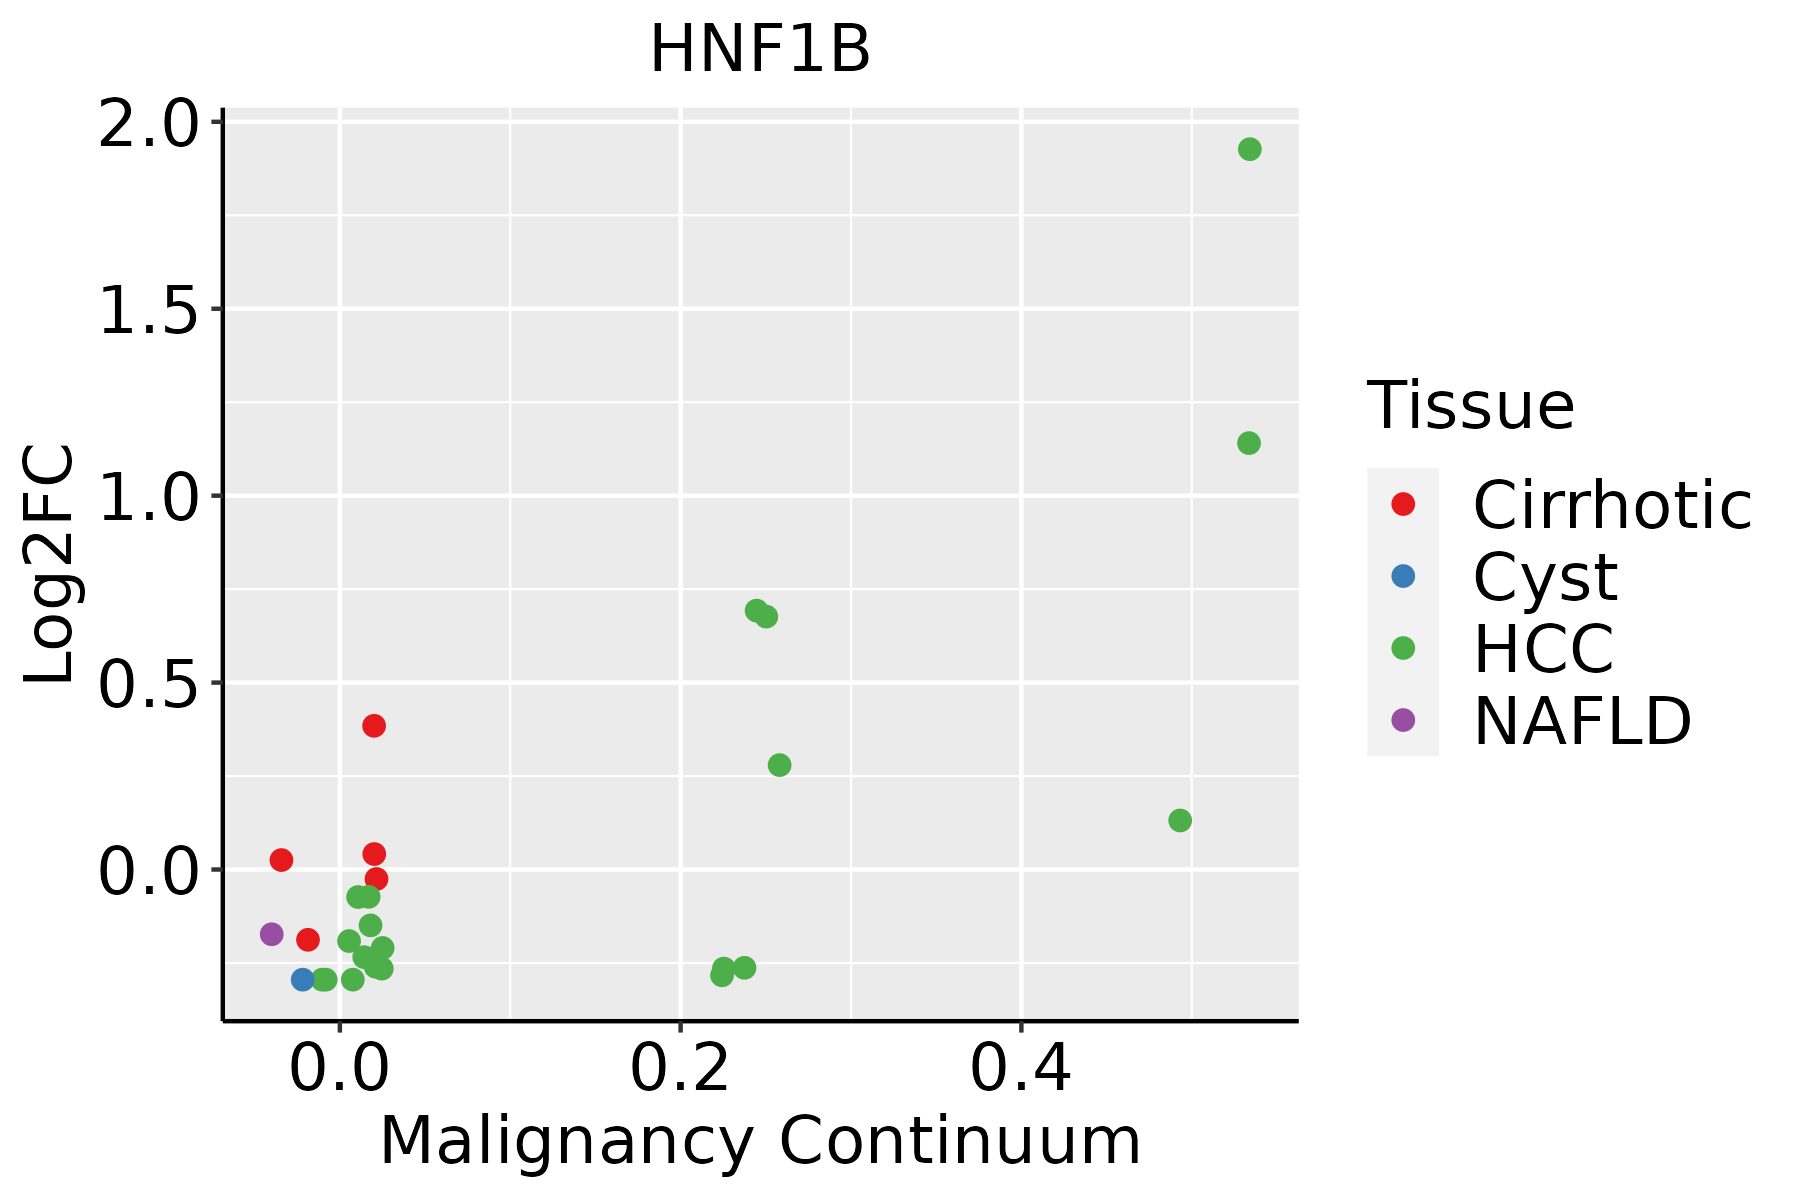 | HCC: Hepatocellular carcinoma |
| NAFLD: Non-alcoholic fatty liver disease |
| ∗log2FC in expression of this searched gene in stem-like cells from each diseased tissue sample relative to stem-like cells in normal samples in each tissue plotted against the malignancy continuum. Samples are colored based on if they are from different disease stage. |
Top |
Malignant transformation related pathway analysis |
| Find out the enriched GO biological processes and KEGG pathways involved in transition from healthy to precancer to cancer |
| Tissue | Disease Stage | Enriched GO biological Processes |
| Colorectum | AD |  |
| Colorectum | SER |  |
| Colorectum | MSS |  |
| Colorectum | MSI-H |  |
| Colorectum | FAP |  |
| ∗Top 15 enriched GO BP terms are showed in the bar plot of each disease state in each tissue. Each row represents a significant GO biological process which is colored according to the -log10(p.adjust). |
| Page: 1 2 3 4 5 6 7 8 9 |
| GO ID | Tissue | Disease Stage | Description | Gene Ratio | Bg Ratio | pvalue | p.adjust | Count |
| GO:000188912 | Liver | Cirrhotic | liver development | 81/4634 | 147/18723 | 2.99e-15 | 3.35e-13 | 81 |
| GO:006100812 | Liver | Cirrhotic | hepaticobiliary system development | 82/4634 | 150/18723 | 3.72e-15 | 4.09e-13 | 82 |
| GO:000974312 | Liver | Cirrhotic | response to carbohydrate | 101/4634 | 253/18723 | 6.24e-08 | 1.92e-06 | 101 |
| GO:000941012 | Liver | Cirrhotic | response to xenobiotic stimulus | 165/4634 | 462/18723 | 6.82e-08 | 2.09e-06 | 165 |
| GO:004873212 | Liver | Cirrhotic | gland development | 154/4634 | 436/18723 | 4.03e-07 | 9.42e-06 | 154 |
| GO:000762312 | Liver | Cirrhotic | circadian rhythm | 84/4634 | 210/18723 | 7.04e-07 | 1.50e-05 | 84 |
| GO:00329221 | Liver | Cirrhotic | circadian regulation of gene expression | 34/4634 | 68/18723 | 6.04e-06 | 9.74e-05 | 34 |
| GO:004851111 | Liver | Cirrhotic | rhythmic process | 103/4634 | 298/18723 | 8.47e-05 | 9.19e-04 | 103 |
| GO:0006367 | Liver | Cirrhotic | transcription initiation from RNA polymerase II promoter | 31/4634 | 77/18723 | 1.91e-03 | 1.20e-02 | 31 |
| GO:00703652 | Liver | Cirrhotic | hepatocyte differentiation | 9/4634 | 16/18723 | 6.94e-03 | 3.38e-02 | 9 |
| GO:0060260 | Liver | Cirrhotic | regulation of transcription initiation from RNA polymerase II promoter | 15/4634 | 33/18723 | 7.61e-03 | 3.60e-02 | 15 |
| GO:2000142 | Liver | Cirrhotic | regulation of DNA-templated transcription, initiation | 17/4634 | 40/18723 | 1.04e-02 | 4.61e-02 | 17 |
| GO:000188922 | Liver | HCC | liver development | 108/7958 | 147/18723 | 2.16e-14 | 1.41e-12 | 108 |
| GO:006100822 | Liver | HCC | hepaticobiliary system development | 109/7958 | 150/18723 | 5.72e-14 | 3.42e-12 | 109 |
| GO:004873222 | Liver | HCC | gland development | 242/7958 | 436/18723 | 2.26e-08 | 5.28e-07 | 242 |
| GO:000974322 | Liver | HCC | response to carbohydrate | 149/7958 | 253/18723 | 9.55e-08 | 1.89e-06 | 149 |
| GO:000941022 | Liver | HCC | response to xenobiotic stimulus | 248/7958 | 462/18723 | 6.47e-07 | 1.02e-05 | 248 |
| GO:00063671 | Liver | HCC | transcription initiation from RNA polymerase II promoter | 52/7958 | 77/18723 | 7.87e-06 | 9.27e-05 | 52 |
| GO:0006352 | Liver | HCC | DNA-templated transcription, initiation | 78/7958 | 130/18723 | 4.19e-05 | 4.11e-04 | 78 |
| GO:000762321 | Liver | HCC | circadian rhythm | 117/7958 | 210/18723 | 7.29e-05 | 6.54e-04 | 117 |
| Page: 1 2 |
| Pathway ID | Tissue | Disease Stage | Description | Gene Ratio | Bg Ratio | pvalue | p.adjust | qvalue | Count |
| Page: 1 |
Top |
Cell-cell communication analysis |
| Identification of potential cell-cell interactions between two cell types and their ligand-receptor pairs for different disease states |
| Ligand | Receptor | LRpair | Pathway | Tissue | Disease Stage |
| Page: 1 |
Top |
Single-cell gene regulatory network inference analysis |
| Find out the significant the regulons (TFs) and the target genes of each regulon across cell types for different disease states |
| TF | Cell Type | Tissue | Disease Stage | Target Gene | RSS | Regulon Activity |
| HNF1B | ABS | Colorectum | Healthy | AC124319.2,RAB23,TENM2, etc. | 3.65e-01 |  |
| HNF1B | ASC | Colorectum | Healthy | AC124319.2,RAB23,TENM2, etc. | 1.37e-01 | |
| HNF1B | DUCT1 | Pancreas | ADJ | ONECUT2,FGFR2,ANXA4, etc. | 7.03e-01 |  |
| ∗The dot plots of a searched regulon are shown for all cell subpopulations in each disease state of each tissue based on the regulon specific score inferred using pySCENIC and by calculating the average expression. |
| Page: 1 |
Top |
Somatic mutation of malignant transformation related genes |
| Annotation of somatic variants for genes involved in malignant transformation |
| Hugo Symbol | Variant Class | Variant Classification | dbSNP RS | HGVSc | HGVSp | HGVSp Short | SWISSPROT | BIOTYPE | SIFT | PolyPhen | Tumor Sample Barcode | Tissue | Histology | Sex | Age | Stage | Therapy Types | Drugs | Outcome |
| HNF1B | SNV | Missense_Mutation | novel | c.1333G>A | p.Ala445Thr | p.A445T | P35680 | protein_coding | tolerated(0.09) | benign(0.062) | TCGA-A7-A6VV-01 | Breast | breast invasive carcinoma | Female | <65 | I/II | Chemotherapy | cyclophosphamide | CR |
| HNF1B | SNV | Missense_Mutation | novel | c.910N>G | p.Arg304Gly | p.R304G | P35680 | protein_coding | deleterious(0.01) | possibly_damaging(0.824) | TCGA-A8-A08G-01 | Breast | breast invasive carcinoma | Female | <65 | I/II | Chemotherapy | 5-fluorouracil | CR |
| HNF1B | SNV | Missense_Mutation | novel | c.1606N>T | p.Asp536Tyr | p.D536Y | P35680 | protein_coding | deleterious(0) | probably_damaging(0.964) | TCGA-AN-A046-01 | Breast | breast invasive carcinoma | Female | >=65 | I/II | Unknown | Unknown | SD |
| HNF1B | SNV | Missense_Mutation | novel | c.1617C>A | p.Ser539Arg | p.S539R | P35680 | protein_coding | deleterious(0.01) | possibly_damaging(0.899) | TCGA-DG-A2KL-01 | Cervix | cervical & endocervical cancer | Female | <65 | I/II | Chemotherapy | cisplatin | SD |
| HNF1B | SNV | Missense_Mutation | novel | c.502N>G | p.Leu168Val | p.L168V | P35680 | protein_coding | deleterious(0) | probably_damaging(0.998) | TCGA-EK-A2RK-01 | Cervix | cervical & endocervical cancer | Female | >=65 | I/II | Unknown | Unknown | SD |
| HNF1B | SNV | Missense_Mutation | novel | c.130G>C | p.Glu44Gln | p.E44Q | P35680 | protein_coding | tolerated(0.11) | possibly_damaging(0.724) | TCGA-IR-A3LH-01 | Cervix | cervical & endocervical cancer | Female | <65 | I/II | Chemotherapy | cisplatin | CR |
| HNF1B | SNV | Missense_Mutation | rs866277746 | c.421N>A | p.Asp141Asn | p.D141N | P35680 | protein_coding | deleterious(0) | probably_damaging(0.999) | TCGA-A6-6141-01 | Colorectum | colon adenocarcinoma | Male | <65 | I/II | Chemotherapy | 5-fu | SD |
| HNF1B | SNV | Missense_Mutation | novel | c.775G>C | p.Glu259Gln | p.E259Q | P35680 | protein_coding | deleterious(0.05) | benign(0.084) | TCGA-AA-3819-01 | Colorectum | colon adenocarcinoma | Female | <65 | I/II | Unknown | Unknown | SD |
| HNF1B | SNV | Missense_Mutation | novel | c.517N>A | p.Val173Ile | p.V173I | P35680 | protein_coding | tolerated(0.1) | possibly_damaging(0.513) | TCGA-AA-3864-01 | Colorectum | colon adenocarcinoma | Male | >=65 | I/II | Unknown | Unknown | SD |
| HNF1B | SNV | Missense_Mutation | novel | c.1616N>T | p.Ser539Ile | p.S539I | P35680 | protein_coding | deleterious(0) | possibly_damaging(0.899) | TCGA-AD-6889-01 | Colorectum | colon adenocarcinoma | Male | >=65 | I/II | Chemotherapy | xeloda | PD |
| Page: 1 2 3 4 5 6 |
Top |
Related drugs of malignant transformation related genes |
| Identification of chemicals and drugs interact with genes involved in malignant transfromation |
| (DGIdb 4.0) |
| Entrez ID | Symbol | Category | Interaction Types | Drug Claim Name | Drug Name | PMIDs |
| 6928 | HNF1B | TRANSCRIPTION FACTOR, CLINICALLY ACTIONABLE, TRANSCRIPTION FACTOR COMPLEX | platinum | PLATINUM | 27561454 | |
| 6928 | HNF1B | TRANSCRIPTION FACTOR, CLINICALLY ACTIONABLE, TRANSCRIPTION FACTOR COMPLEX | metformin | METFORMIN |
| Page: 1 |

Copyright 2023-Present -The University of Texas Health Science Center at Houston |