
|
|||||
|
 | |
| |
| |
| |
| |
| |
|
Gene: HN1L |
Gene summary for HN1L |
| Gene information | Species | Human | Gene symbol | HN1L | Gene ID | 90861 |
| Gene name | Jupiter microtubule associated homolog 2 | |
| Gene Alias | C16orf34 | |
| Cytomap | 16p13.3 | |
| Gene Type | protein-coding | GO ID | GO:0005575 | UniProtAcc | Q9H910 |
Top |
Malignant transformation analysis |
| Identification of the aberrant gene expression in precancerous and cancerous lesions by comparing the gene expression of stem-like cells in diseased tissues with normal stem cells |
| Entrez ID | Symbol | Replicates | Species | Organ | Tissue | Adj P-value | Log2FC | Malignancy |
| 90861 | HN1L | P1T-E | Human | Esophagus | ESCC | 2.43e-08 | 5.49e-01 | 0.0875 |
| 90861 | HN1L | P2T-E | Human | Esophagus | ESCC | 3.97e-37 | 8.36e-01 | 0.1177 |
| 90861 | HN1L | P4T-E | Human | Esophagus | ESCC | 1.01e-36 | 1.05e+00 | 0.1323 |
| 90861 | HN1L | P5T-E | Human | Esophagus | ESCC | 2.45e-41 | 8.42e-01 | 0.1327 |
| 90861 | HN1L | P8T-E | Human | Esophagus | ESCC | 9.86e-38 | 8.51e-01 | 0.0889 |
| 90861 | HN1L | P9T-E | Human | Esophagus | ESCC | 5.28e-06 | 1.43e-01 | 0.1131 |
| 90861 | HN1L | P10T-E | Human | Esophagus | ESCC | 7.17e-25 | 3.51e-01 | 0.116 |
| 90861 | HN1L | P11T-E | Human | Esophagus | ESCC | 8.43e-14 | 7.49e-01 | 0.1426 |
| 90861 | HN1L | P12T-E | Human | Esophagus | ESCC | 1.00e-65 | 1.11e+00 | 0.1122 |
| 90861 | HN1L | P15T-E | Human | Esophagus | ESCC | 3.63e-49 | 1.03e+00 | 0.1149 |
| 90861 | HN1L | P16T-E | Human | Esophagus | ESCC | 9.52e-16 | 3.82e-01 | 0.1153 |
| 90861 | HN1L | P17T-E | Human | Esophagus | ESCC | 6.56e-14 | 6.78e-01 | 0.1278 |
| 90861 | HN1L | P19T-E | Human | Esophagus | ESCC | 3.69e-08 | 9.04e-01 | 0.1662 |
| 90861 | HN1L | P20T-E | Human | Esophagus | ESCC | 4.69e-30 | 5.88e-01 | 0.1124 |
| 90861 | HN1L | P21T-E | Human | Esophagus | ESCC | 2.36e-41 | 8.32e-01 | 0.1617 |
| 90861 | HN1L | P22T-E | Human | Esophagus | ESCC | 4.21e-35 | 5.78e-01 | 0.1236 |
| 90861 | HN1L | P23T-E | Human | Esophagus | ESCC | 2.31e-31 | 7.09e-01 | 0.108 |
| 90861 | HN1L | P24T-E | Human | Esophagus | ESCC | 1.60e-25 | 5.45e-01 | 0.1287 |
| 90861 | HN1L | P26T-E | Human | Esophagus | ESCC | 1.21e-32 | 6.08e-01 | 0.1276 |
| 90861 | HN1L | P27T-E | Human | Esophagus | ESCC | 3.39e-29 | 5.86e-01 | 0.1055 |
| Page: 1 2 3 4 5 6 |
| Tissue | Expression Dynamics | Abbreviation |
| Esophagus | 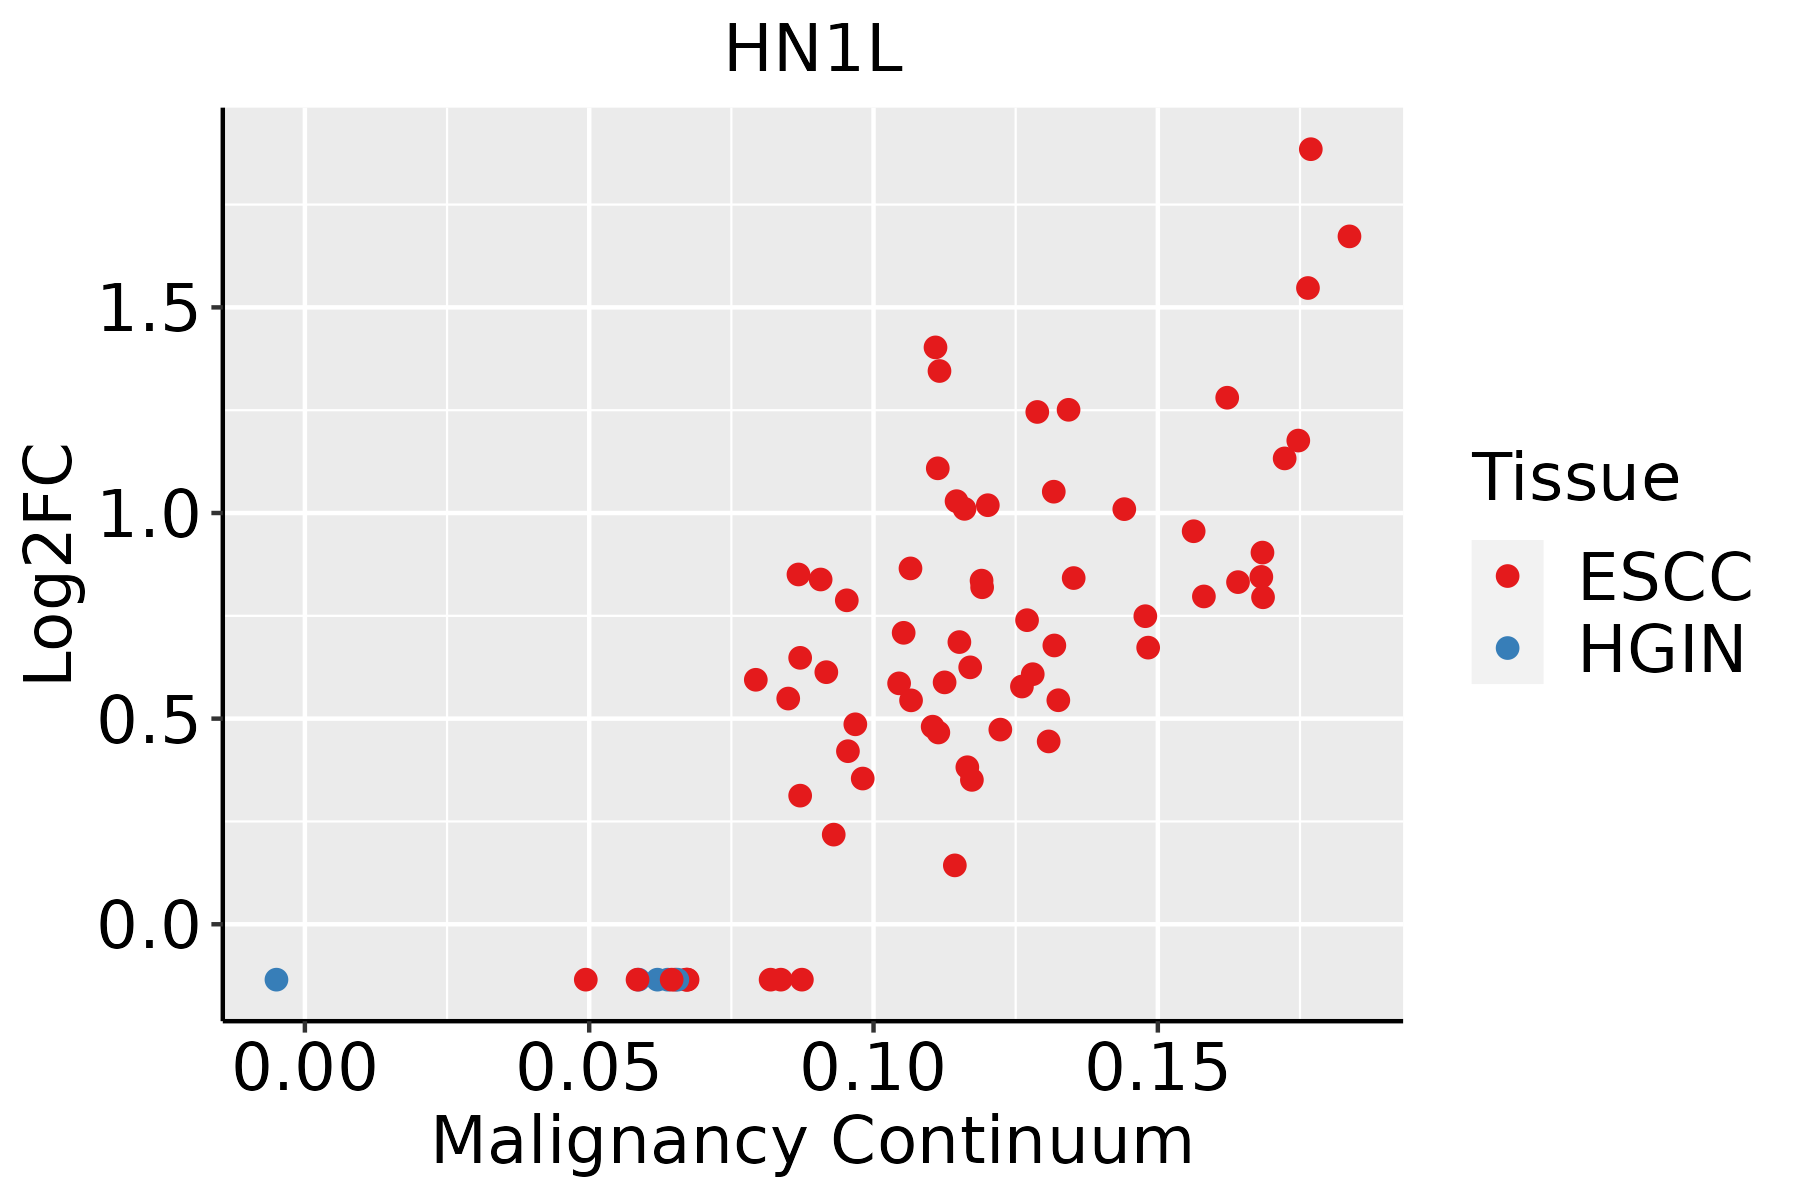 | ESCC: Esophageal squamous cell carcinoma |
| HGIN: High-grade intraepithelial neoplasias | ||
| LGIN: Low-grade intraepithelial neoplasias | ||
| Oral Cavity | 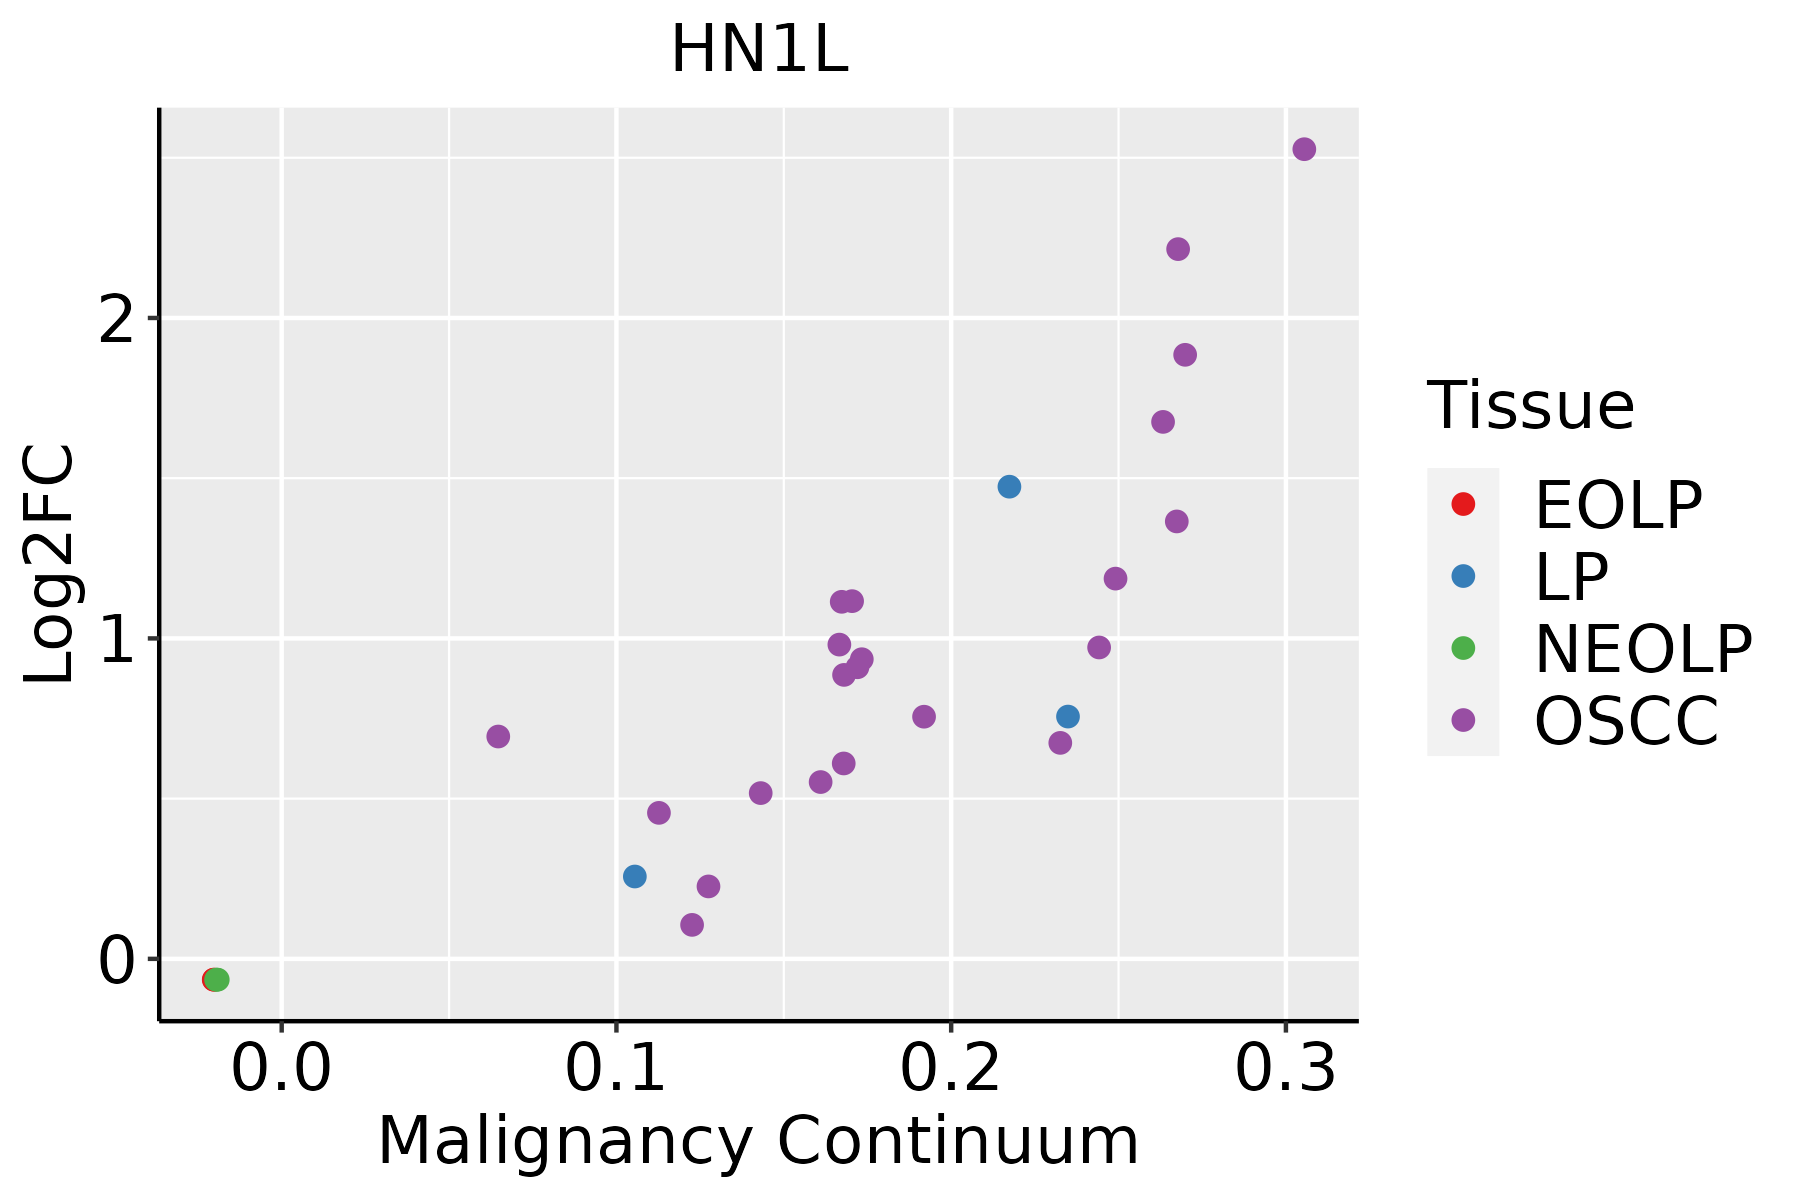 | EOLP: Erosive Oral lichen planus |
| LP: leukoplakia | ||
| NEOLP: Non-erosive oral lichen planus | ||
| OSCC: Oral squamous cell carcinoma | ||
| Prostate | 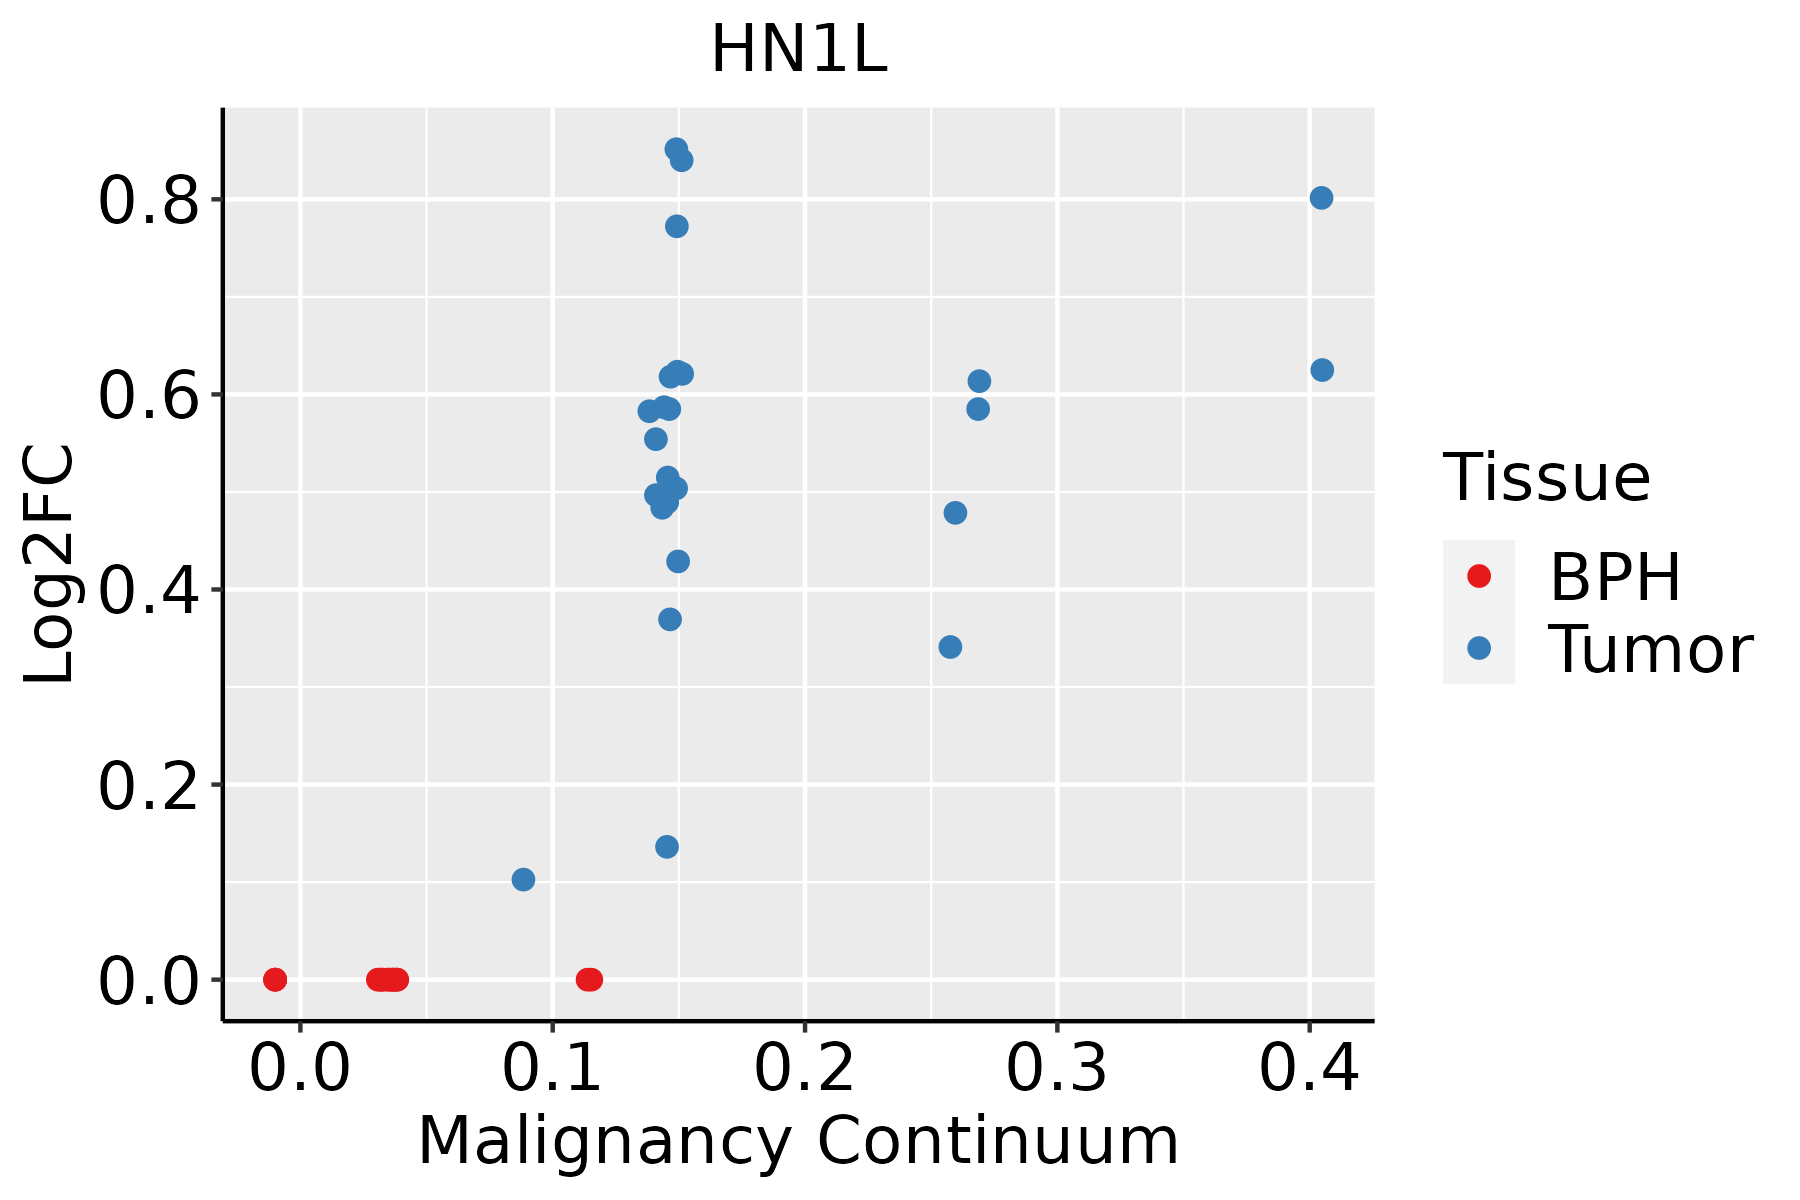 | BPH: Benign Prostatic Hyperplasia |
| Skin | 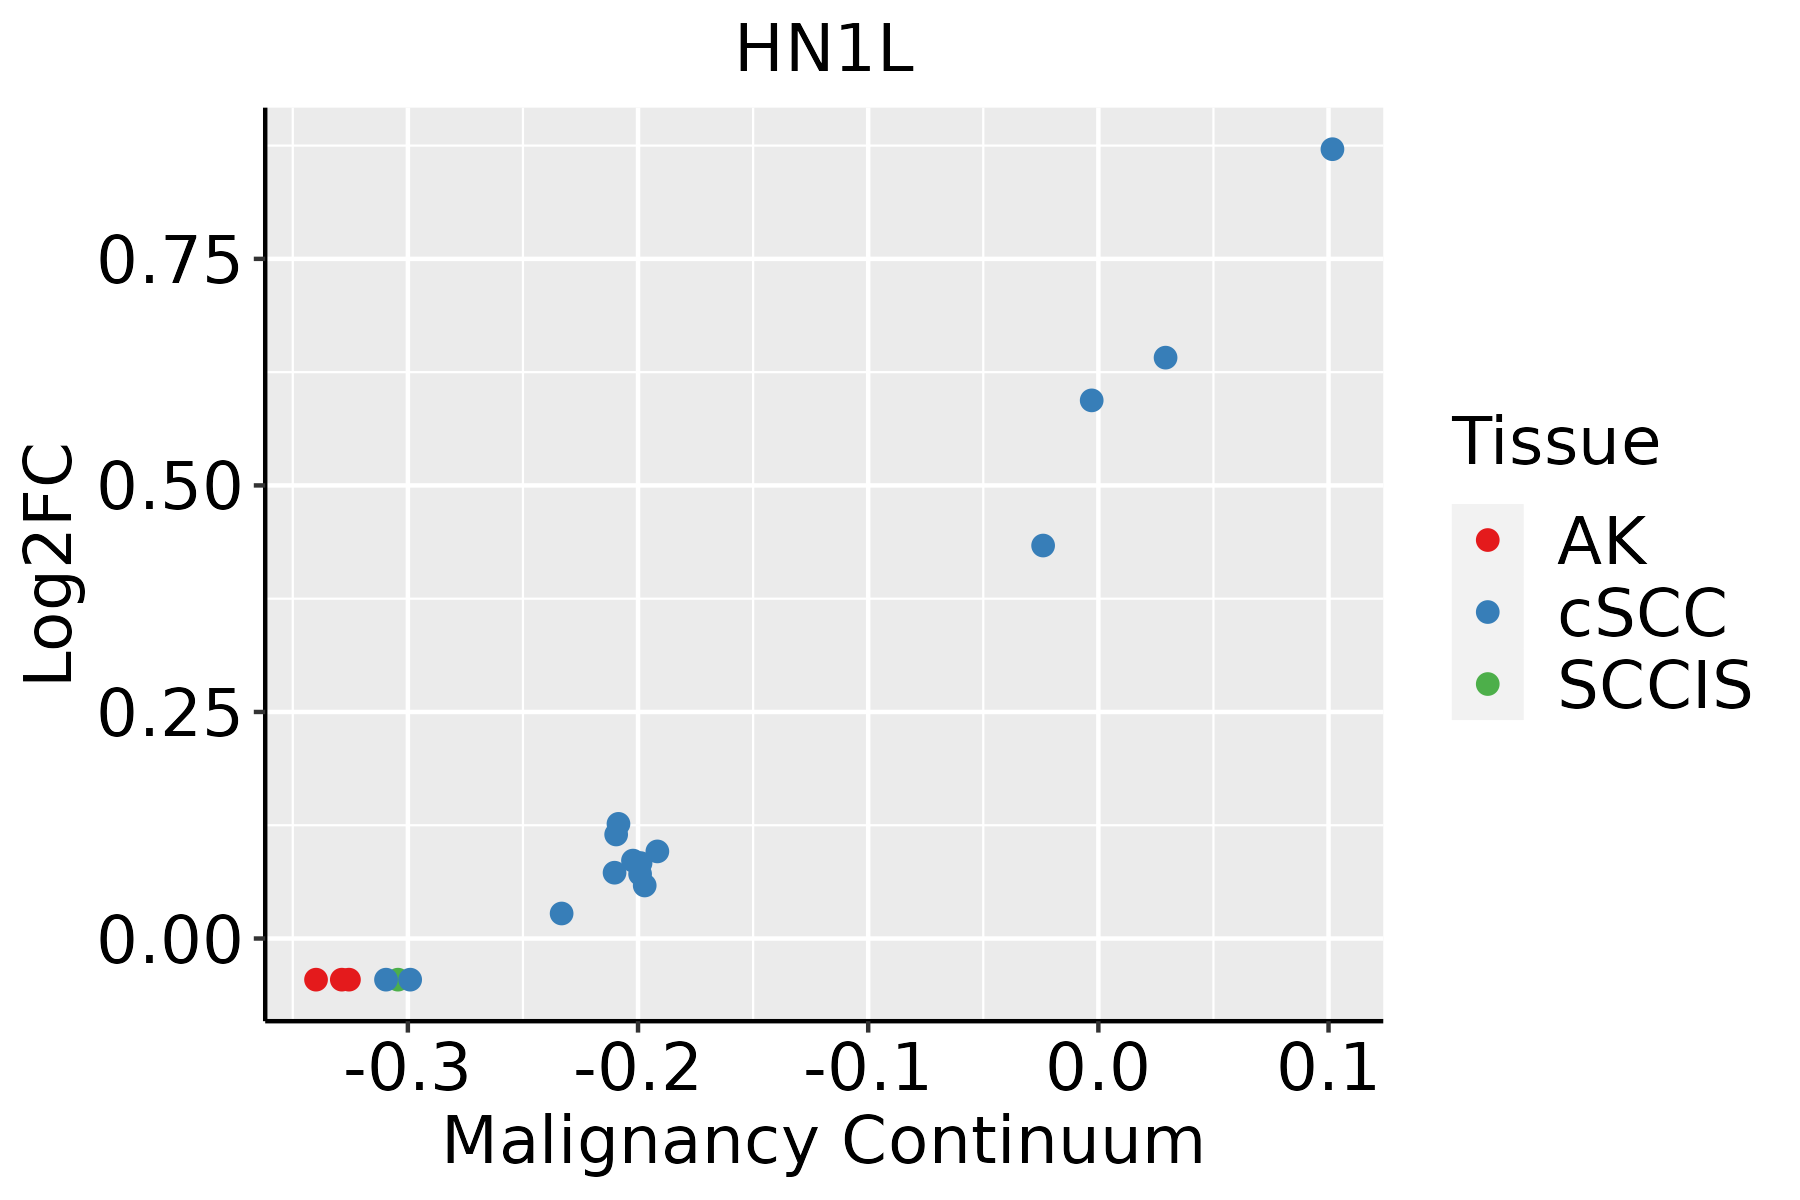 | AK: Actinic keratosis |
| cSCC: Cutaneous squamous cell carcinoma | ||
| SCCIS:squamous cell carcinoma in situ |
| ∗log2FC in expression of this searched gene in stem-like cells from each diseased tissue sample relative to stem-like cells in normal samples in each tissue plotted against the malignancy continuum. Samples are colored based on if they are from different disease stage. |
Top |
Malignant transformation related pathway analysis |
| Find out the enriched GO biological processes and KEGG pathways involved in transition from healthy to precancer to cancer |
| Tissue | Disease Stage | Enriched GO biological Processes |
| Colorectum | AD |  |
| Colorectum | SER |  |
| Colorectum | MSS |  |
| Colorectum | MSI-H |  |
| Colorectum | FAP |  |
| ∗Top 15 enriched GO BP terms are showed in the bar plot of each disease state in each tissue. Each row represents a significant GO biological process which is colored according to the -log10(p.adjust). |
| Page: 1 2 3 4 5 6 7 8 9 |
| GO ID | Tissue | Disease Stage | Description | Gene Ratio | Bg Ratio | pvalue | p.adjust | Count |
| Page: 1 |
| Pathway ID | Tissue | Disease Stage | Description | Gene Ratio | Bg Ratio | pvalue | p.adjust | qvalue | Count |
| Page: 1 |
Top |
Cell-cell communication analysis |
| Identification of potential cell-cell interactions between two cell types and their ligand-receptor pairs for different disease states |
| Ligand | Receptor | LRpair | Pathway | Tissue | Disease Stage |
| Page: 1 |
Top |
Single-cell gene regulatory network inference analysis |
| Find out the significant the regulons (TFs) and the target genes of each regulon across cell types for different disease states |
| TF | Cell Type | Tissue | Disease Stage | Target Gene | RSS | Regulon Activity |
| ∗The dot plots of a searched regulon are shown for all cell subpopulations in each disease state of each tissue based on the regulon specific score inferred using pySCENIC and by calculating the average expression. |
| Page: 1 |
Top |
Somatic mutation of malignant transformation related genes |
| Annotation of somatic variants for genes involved in malignant transformation |
| Hugo Symbol | Variant Class | Variant Classification | dbSNP RS | HGVSc | HGVSp | HGVSp Short | SWISSPROT | BIOTYPE | SIFT | PolyPhen | Tumor Sample Barcode | Tissue | Histology | Sex | Age | Stage | Therapy Types | Drugs | Outcome |
| HN1L | SNV | Missense_Mutation | c.136A>G | p.Asn46Asp | p.N46D | Q9H910 | protein_coding | tolerated(0.06) | possibly_damaging(0.725) | TCGA-E9-A1NI-01 | Breast | breast invasive carcinoma | Female | <65 | I/II | Chemotherapy | doxorubicin | CR | |
| HN1L | SNV | Missense_Mutation | c.194N>A | p.Gly65Glu | p.G65E | Q9H910 | protein_coding | deleterious(0) | probably_damaging(0.976) | TCGA-HG-A2PA-01 | Cervix | cervical & endocervical cancer | Female | <65 | I/II | Unspecific | Taxol | PD | |
| HN1L | SNV | Missense_Mutation | c.196G>A | p.Gly66Ser | p.G66S | Q9H910 | protein_coding | deleterious(0) | probably_damaging(1) | TCGA-A6-6780-01 | Colorectum | colon adenocarcinoma | Male | >=65 | I/II | Unknown | Unknown | SD | |
| HN1L | SNV | Missense_Mutation | c.374C>T | p.Ser125Leu | p.S125L | Q9H910 | protein_coding | tolerated(0.35) | benign(0.003) | TCGA-AA-3510-01 | Colorectum | colon adenocarcinoma | Male | >=65 | I/II | Unknown | Unknown | SD | |
| HN1L | SNV | Missense_Mutation | novel | c.496N>T | p.Arg166Trp | p.R166W | Q9H910 | protein_coding | deleterious(0) | probably_damaging(0.999) | TCGA-AA-3522-01 | Colorectum | colon adenocarcinoma | Male | >=65 | I/II | Unknown | Unknown | SD |
| HN1L | SNV | Missense_Mutation | novel | c.171N>G | p.Ile57Met | p.I57M | Q9H910 | protein_coding | tolerated(0.25) | benign(0.017) | TCGA-AA-3715-01 | Colorectum | colon adenocarcinoma | Male | >=65 | I/II | Unknown | Unknown | PD |
| HN1L | SNV | Missense_Mutation | c.374C>T | p.Ser125Leu | p.S125L | Q9H910 | protein_coding | tolerated(0.35) | benign(0.003) | TCGA-AA-3984-01 | Colorectum | colon adenocarcinoma | Female | <65 | I/II | Unknown | Unknown | SD | |
| HN1L | SNV | Missense_Mutation | c.515G>A | p.Arg172His | p.R172H | Q9H910 | protein_coding | deleterious(0) | probably_damaging(0.999) | TCGA-AD-A5EJ-01 | Colorectum | colon adenocarcinoma | Female | >=65 | I/II | Unknown | Unknown | SD | |
| HN1L | SNV | Missense_Mutation | novel | c.371A>G | p.Lys124Arg | p.K124R | Q9H910 | protein_coding | tolerated(0.19) | benign(0.049) | TCGA-CA-6717-01 | Colorectum | colon adenocarcinoma | Male | <65 | I/II | Chemotherapy | oxaliplatin | CR |
| HN1L | SNV | Missense_Mutation | c.374N>T | p.Ser125Leu | p.S125L | Q9H910 | protein_coding | tolerated(0.35) | benign(0.003) | TCGA-F5-6814-01 | Colorectum | rectum adenocarcinoma | Male | <65 | I/II | Unknown | Unknown | SD |
| Page: 1 2 3 |
Top |
Related drugs of malignant transformation related genes |
| Identification of chemicals and drugs interact with genes involved in malignant transfromation |
| (DGIdb 4.0) |
| Entrez ID | Symbol | Category | Interaction Types | Drug Claim Name | Drug Name | PMIDs |
| Page: 1 |

Copyright 2023-Present -The University of Texas Health Science Center at Houston |